Medicinal Plants Recommended by the World
Health Organization: DNA Barcode
Identification Associated with Chemical
Analyses Guarantees Their Quality
Rafael Melo Palhares1,2,3*, Marcela Gonçalves Drummond2, Bruno dos Santos Alves Figueiredo Brasil4, Gustavo Pereira Cosenza5, Maria das Graças Lins Brandão5,6,
Guilherme Oliveira3
1Programa de Pós-graduação em Genética, Universidade Federal de Minas Gerais, Belo Horizonte, Brazil,
2Myleus Biotechnology Research Team, Belo Horizonte, Brazil,3Grupo de Genômica e Biologia Computacional, Centro de Pesquisa Rene Rachou, FIOCRUZ, Belo Horizonte, Brasil,4EMBRAPA Agroenergia, Brasilia, Brazil,5Laboratório de Farmacognosia, Faculdade de Farmácia, Universidade Federal de Minas Gerais, Belo Horizonte, Brasil,6CEPLAMT, Museu de História Natural e Jardim Botânico & Faculdade de Farmácia, Universidade Federal de Minas Gerais, Belo Horizonte, Brasil
Abstract
Medicinal plants are used throughout the world, and the regulations defining their proper use, such as identification of the correct species and verification of the presence, purity and concentration of the required chemical compounds, are widely recognized. Herbal medi-cines are made from vegetal drugs, the processed products of medicinal species. These processed materials present a number of challenges in terms of botanical identification, and according to the World Health Organization (WHO), the use of incorrect species is a threat to consumer safety. The samples used in this study consisted of the dried leaves, flowers and roots of 257 samples from 8 distinct species approved by the WHO for the production of medicinal herbs and sold in Brazilian markets. Identification of the samples in this study using DNA barcoding (matK,rbcLandITS2regions) revealed that the level of substitutions may be as high as 71%. Using qualitative and quantitative chemical analyses, this study identified situations in which the correct species was being sold, but the chemical com-pounds were not present. Even more troubling, some samples identified as substitutions using DNA barcoding contained the chemical compounds from the correct species at the minimum required concentration. This last situation may lead to the use of unknown species or species whose safety for human consumption remains unknown. This study concludes that DNA barcoding should be used in a complementary manner for species identification with chemical analyses to detect and quantify the required chemical compounds, thus im-proving the quality of this class of medicines.
OPEN ACCESS
Citation:Palhares RM, Gonçalves Drummond M, dos Santos Alves Figueiredo Brasil B, Pereira Cosenza G, das Graças Lins Brandão M, Oliveira G (2015) Medicinal Plants Recommended by the World Health Organization: DNA Barcode Identification Associated with Chemical Analyses Guarantees Their Quality. PLoS ONE 10(5): e0127866. doi:10.1371/journal.pone.0127866
Academic Editor:Dirk Steinke, Biodiversity Insitute of Ontario - University of Guelph, CANADA
Received:January 5, 2015
Accepted:April 20, 2015
Published:May 15, 2015
Copyright:© 2015 Palhares et al. This is an open access article distributed under the terms of the
Creative Commons Attribution License, which permits unrestricted use, distribution, and reproduction in any medium, provided the original author and source are credited.
Data Availability Statement:All relevant data are within the paper and its Supporting Information files. DNA sequences are deposited on GenBank and the accession numbers are within the paper. GenBank acession number: KJ750965 through KJ751173; KJ751175 through KJ751402; KM519459 through KM519583.
Funding:This project was funded by CNPq (Conselho Nacional de Pesquisa–Brasil) (INCT
Introduction
The global market of products derived from plants is estimated at $83 billion US and continues to grow [1]. Furthermore, it is estimated that approximately 25% of modern drugs and as many as 60% of antitumor drugs [2] are derived from natural products [3]. According to the WHO, between 65% and 80% of the populations of developing countries currently use medici-nal plants as remedies [1]. The development of new products from natural sources is also en-couraged because it is estimated that of the 300,000 plant species that exist in the world, only 15% have been evaluated to determine their pharmacological potential [4]. Studies demonstrat-ing the efficacy and importance of medicinal plants are bedemonstrat-ing carried out worldwide in coun-tries that span a wide range of developmental stages [5–9]. Due to the widespread use of medicinal plants, the WHO published the Monographs on Selected Medicinal Plants volumes 1 through 5 from 1999 to 2010; these volumes contain a list of species with recognized medici-nal benefits and the accepted means to correctly use them [10–14]. In addition to following WHO recommendations, Brazil has its own agency that regulates the use of medicinal plants, the National Health Surveillance Agency (from the Portuguese ANVISA—Agência Nacional de Vigilância Sanitária). ANVISA also has its own list of approved species for manufacturing herbal medicines [15]. Although Brazil is rich in biodiversity and medicinal plants, most of these plants on this list are exotic species that were introduced to the country during the early phases of European colonization in the 1500s [16–18].
To guarantee the quality of herbal medicines, certain steps established in the Pharmacopoe-ias must be followed, including correct identification of the plant species, analysis of the purity and confirmation of the presence and minimum concentration of the active ingredients (chem-ical marker(s)) [19]. In this regard, one of the main challenges encountered in the herbal medi-cine industry is ensuring unequivocal species identification of the raw material that will be used to manufacture the herbal medicine. There are several plant identification techniques, but in many cases, the identification is based mainly on botanical analysis, that can be problematic due to the high phenotypic variation among taxa, the commercialization of processed raw plant material and/or unidentifiable plant parts and the lack of highly trained professionals in plant taxonomy [20–22]. Furthermore, quality control for herbal drugs is currently performed according to a set of pharmaceutical analyses, beginning by direct observation of the morpho-logical, sensory and microscopic characteristics of each type of plant material. If the identity of the plant part is verified, the sample is submitted for chemical characterization using chro-matographic methods to verify the presence of specific substances in comparison with a chemi-cal profile in the literature or found in standard samples [23–27]. Misidentification and substitutions are a reality, with confirmed reports from several countries [7,28–30], including a recent study from our group in which we demonstrated substitutions of species of“quina”
(Cinchonaspp.) in Brazilian markets [31]. These issues are of high concern because they may cause fatalities among users [32,33]. Under these conditions, DNA barcoding may be a power-ful tool. The DNA barcode consists of one or more short, standardized DNA region(s) that can be used to identify a species [34]. and is a powerful tool that can be applied to address the prob-lems in botanically identifying highly processed plant materials [35–38] in addition to other uses, such as the identification of endangered species and the use in forensic DNA researches [39,40]. Since 2009 the Plant Working Group from the Barcode of Life project established that the official regions for DNA Barcodes of plants arerbcLandmatK[41]. Despite this, those re-gions are not 100% efficient in discriminating plant species and other rere-gions are used by dif-ferent researchers to improve the efficiency of the official DNA Barcode [42–44].
Here we propose the use of DNA barcoding technology to identify the raw material used to manufacture herbal medicines. Along with the CBOL recommendations and based on previous
de apoio à pesquisa do Estado de Minas Gerais Brasil) (INCT APQ-0084/08). MGD is grateful to CNPQ for the research fellowship provided (process number 300702/2012-4). RMP is grateful to CNPQ for the research fellowship provided (process number143127/2011-0). The funding agencies played no role in the study design, data collection and analysis, decision to publish or preparation of the manuscript.
studies, we evaluated the addition of the nuclearITS2region to the barcode core ofmatKandrbcL [20]. After the initial identification step, our group carried out chemical analyses to demonstrate the presence and concentration of the essential chemical compound of the herbal medicine. Our results indicate that DNA barcoding should be used as a screening step during the herbal medicine manufacturing process, and only samples that are correctly identified should proceed to chemical validation. This proposed workflow would improve the safety, speed and reliability of this process.
Materials and Methods
Sample collection
A total of 257 samples from 8 species that are recognized by the WHO and ANVISA as medici-nal species and approved for use in the preparation of remedies were purchased in the Central Market (19° 55' 22.465" S 43° 56' 35.058" W) in the city of Belo Horizonte in the state of Minas Gerais, Brazil. Belo Horizonte’s metropolitan region holds approximately 6 million inhabitants and possesses a large traditional popular market as well as several drugstores and pharmacies specialized in phytoterapy and medicinal plants. The collectors purchased the samples, as regu-lar customers, from 20 stores, during the years of 2012 to 2014. Products sold as dried plant parts or as powdered tissues, either simply packed or encapsulated, were sampled. Samples were stored in an acclimatized and humidity free room before DNA extraction. The studied species, popular names and used parts wereHamamelis virginianaL. (Hamamelis—leaves), Matricaria recutitaL. (Chamomile, flowers),Maytenus ilicifoliaMart. Ex Reiss (Espinheira Santa, leaves),Mikania glomerataSpreng. (Guaco, leaves),Panax ginsengC. A. Mey (Asian Ginseng, roots),Passiflora incarnataL. (passion flower, leaves),Peumus boldusMolina (Boldo-do-Chile, leaves) andValeriana officinalisL. (Valerian, roots) (Table 1).
Characteristics of the samples
The acquired samples included, flowers, leaves and roots. The samples were collected in two forms, as the dried parts described above and as powdered tissues. No mixtures were analyzed
Table 1. Species analyzed in this study and their therapeutical recommendations.
Species Recommended uses Number of
samples
H.virginiana
L.
Topically for minor skin lesions, bruises and sprains, local inflammation of the skin and mucous membranes, hemorrhoids and varicose veins [11]
32
Internal uses External uses Inhalation
M.recutitaL. Symptomatic treatment of digestive ailments, treatment of restlessness and insomnia due to nervous disorders [10]
Inflammation and irritations of the skin and mucosa, including irritations and infections of the mouth and gums, and hemorrhoids [10]
Symptomatic relief on irritations of the respiratory tract due to common cold [10]
31
M.ilicifolia
Mart. Ex Reiss
Treatment of dyspepsia, gastritis and gastroduodenal ulcer [15] 33
M.glomerata
Sprengl.
Bronchodilatador and expectorant [15] 31
P.ginsengC. A. Mey
Prophylactic and restorative agent for enhancement of mental and physical capacities, in cases of weakness, exhaustion, tiredness, and loss of concentration, and during convalescence [10]
31
P.incarnataL. Mild sedative for nervous restlessness, insomnia and anxiety. Treatment of gastrointestinal disorders of nervous origins [12]
30
P.boldus
Molina
Treatment of functional dyspepsia and gastrointestinal disorders, cholagogue and choleretic [15] 34
V.officinalisL. Mild sedative and sleep promoting agent. Often used as a milder alternative or a possible substitute for stronger synthetic sedatives in treatment of nervous excitation and anxiety-induced sleep disturbances [10]
35
due to limitations inherent to the Sanger sequencing method. In the laboratory, each sample was recorded and kept under uniform conditions in a climate-controlled room at DATA-PLAMT (Aromatic, medicinal and poisonous center for data and sample storage at the Univer-sidade Federal de Minas Gerais).
DNA extraction
DNA was extracted from the leaves, flowers and roots of the plants using the DNeasy plant mini kit (Qiagen, Venlo—Netherlands) with modifications. Approximately 20 mg of each sam-ple was pulverized using a mortar at room temperature. The powder was mixed with 600μL of buffer AP1 supplied with the kit and incubated at 65°C and 400 rpm for 1 hour in a heat block (Thermomixer compact; Eppendorf, Germany). After incubation, 230μL of buffer AP2 from the DNeasy kit was added, and the samples were incubated on ice for 30 minutes. The later steps of the extraction were carried out following instructions from the manufacturer (DNeasy plant handbook, Qiagen, Venlo—Netherlands). After extraction, the DNA samples were visual-ized on a 1% agarose gel stained with GelRed (Biotium, California, USA). The 100-bp DNA standard from Invitrogen (California, USA) was used for the analysis of the genomic DNA. Eighteen samples did not present the total DNA band on the agarose gel and, consequently, did not yield any amplicon in the subsequent PCR reaction. These samples could not be analyzed as the correct species or a substitutions, leaving the final dataset with a total of 239 samples.
PCR and sequencing
DNA amplification was carried out using primers selected from the Royal Botanic Gardens Kew Phase 2 Protocols and Update on Plant DNA Barcoding as follows: formatK, forward
5’—ACCCAGTCCATCTGGAAATCTTGGTTC—3’(primer 1R_KIM-f) and reverse5’— CGTACAGTACTTTTGTGTTTACGAG—3’(primer 3F_KIM-r); forrbcL, forward5’— ATGTCACCACAAACAGAGACTAAAGC—3’(primer rbcLa_f) and reverse5’—
GAAACGGTCTCTCCAACGCAT—3’(primer rbcLa_jf634R); and for ITS2, forward5'— ATGCGATACTTGGTGTGAAT—3'(primer ITS-S2F) and reverse5'—GACGCTTCTCCAGAC TACAAT—3'(primer ITS3R) (http://www.kew.org/barcoding/protocols.html).
The PCR reactions were performed using a final volume of 25μL containing 2 U of Ampli-Taq Gold polymerase in GeneAmp 106 PCR Buffer II (100 mM Tris-HCl, pH 8.3; 500 mM KCl), 1.5 mM MgCl2(Applied Biosystems, Foster City, CA), 0.2 mM dNTPs, 0.6μM of each primer, and 100 to 200 ng of DNA.
The amplification was carried out in a GeneAmp PCR System 9700 Thermocycler (Applied Biosystems, Foster City, CA) using the following conditions:matk—an initial denaturation step
at 98°C for 2 minutes; followed by 40 cycles at 98°C for 10 seconds, 52°C for 30 seconds and 72°C for 40 seconds; with a final extension period at 72°C for 10 minutes;rbcL—an initial
dena-turation step at 95°C for 3 minutes; followed by 45 cycles at 94°C for 30 seconds, 50°C for 40 seconds and 72°C for 40 seconds; with a final extension period at 72°C for 5 minutes; ITS2—an initial denaturation step at 95°C for 5 minutes; followed by 40 cycles at 94°C for 30 seconds, 56°C for 30 seconds and 72°C for 45 seconds; with a final extension period at 72°C for 10 min-utes. After amplification, the DNA samples were visualized on a 1% agarose gel stained with GelRed (Biotium, California, USA). Six samples did not yield any amplicon in the subsequent PCR reaction. These samples could not be analyzed as the correct species or a substitutions, leaving the final dataset with a total of 233 samples.
Brazil) using an ABI3130 automated sequencer (Applied Biosystems, Foster City, CA) with BigDye v3.1.
Data analysis
The obtained DNA sequences were edited using the SeqScape v2.7 software program (Applied Biosystems, Foster City, CA). Bases with a QV lower than 15 (i.e., a probability of error of 3.2%) were manually edited, and samples for which the entire sequence (or the majority of it) had a lower QV were discarded due to the high probability of error and/or impossibility of analyses [45]. Samples that amplified high-quality sequences from any one of the three genes (rbcL,matKorITS2) were included in the analyses. The sequences produced in this work were submitted to GenBank (accession numbers KJ750965 through KJ751173 formatKsequences, KJ751175 through KJ751402 forrbcLsequences and KM519459 through KM519583 forITS2 sequences). Some of the sequences forITS2(61 sequences/32,97% of the total ITS-2 dataset) had fewer than 200 base pairs and could therefore not be deposited in GenBank. Those se-quences are available as supporting information (S1 File).
The reference sequences used to identify the generated sequences were mined from the Bar-code of Life Data Systems (BOLD) (http://v3.boldsystems.org/index.php/databases) for thematK andrbcLregions and from GenBank (http://www.ncbi.nlm.nih.gov/genbank/) for the ITS2 re-gion. BOLD archives are today the more reliable databases regarding DNA barcodes for refer-ence species, since the criteria for a researcher to deposit a sequrefer-ence is carefully reviewed and the specimen must be taxonomically identified by an expert. Some of the criteria include the deposit of at least five specimens vouchers of the reference species, the personal information of the bota-nist that made the identification of the specimens and several metadata that brings more security as to the correct identification. Since the official DNA barcode regions chosen for plant arematk andrbcL, GenBank had to be used for the ITS2 region, but when possible the ITS2 region was mined from BOLD. The reference sequences included every species from the eight genera ana-lyzed in this study. Every query sequence that did not group with one of these genera was submit-ted to a Plant Identification via BOLD and to a MEGABLAST search on GenBank; the genera returned from these identifications were added to the phylogenetic analyses. The phylogenetic analyses and tree assembly were performed using the neighbor-joining (K2P) statistical method [41] in MEGA 5.2.2 [46]. The query sequences were identified according to the reference se-quences with which they formed a cluster with a 98% similarity cutoff. Samples that grouped with a genus other than the eight target genera were promptly classified as substitutions.
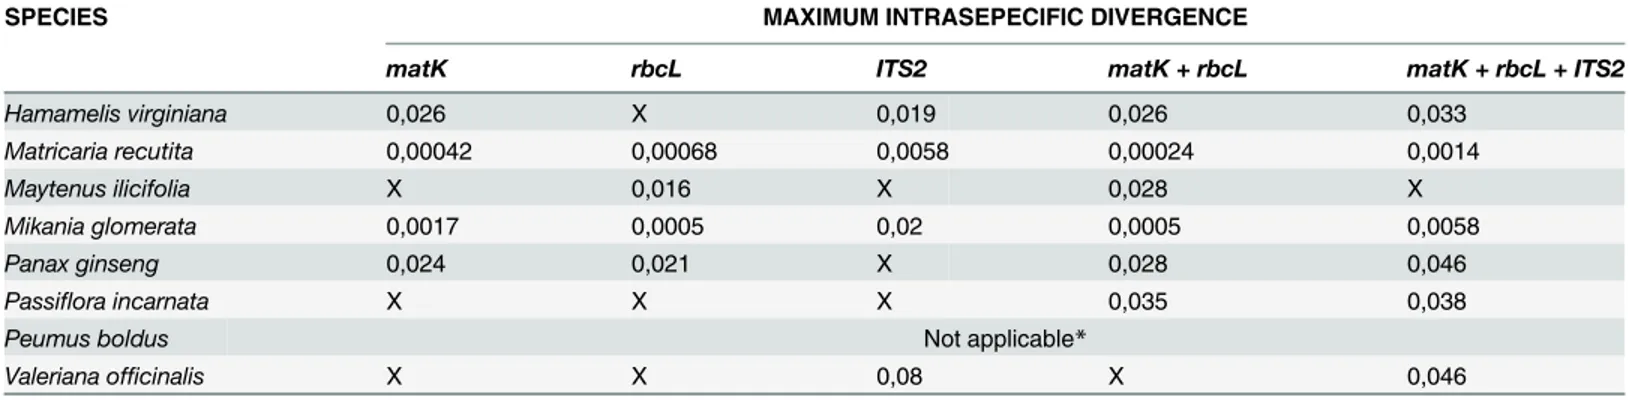
To better identify the samples grouped within the 8-genus set of this study, the barcode gap approach was used [34]. For the barcode gap, the pairwise distance for each of the 8 genera was calculated individually using MEGA 5.2.2. The result was then exported to PAST [47], and a frequency histogram was assembled. The barcode gap was calculated for each of the three genes individually, formatKandrbcLtogether, and formatK,rbcLandITS2together. For each calculation, a barcode gap was considered to exist if the frequency histogram showed a clear distinction between the intra- and interspecific genetic variation. When this distinction was unclear, no barcode gap was said to exist. Samples that presented a genetic variation higher than the maximum intraspecific variation were considered to be substitutions, and samples that presented genetic variation lower than the maximum intraspecific variation could not be identified as either a substitution or the correct species.
Chemical analysis
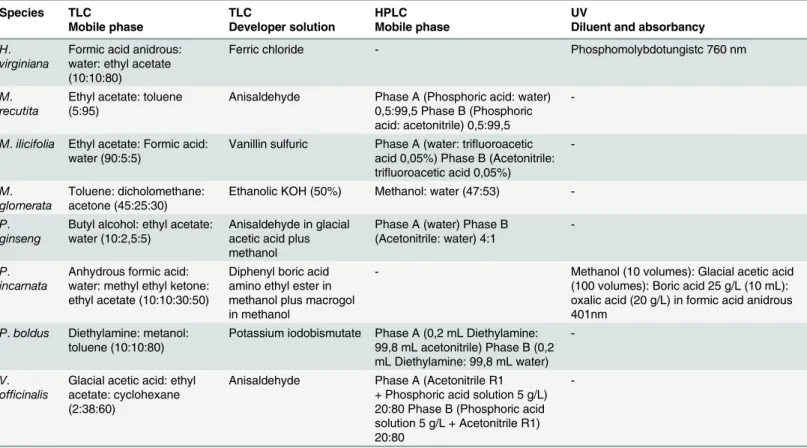
analysis, the concentration of the substances was determined using high-performance liquid chromatography (HPLC) or ultra-violet (UV) spectroscopy. The latter was performed only for a subset of the samples to demonstrate that the correctly identified samples may not have the minimum required concentration of the target chemical compounds and that samples identi-fied as substitutions may have the chemical compounds at the minimum required concentra-tion. Because each species has its own approved method for certification, the chemical analyses and the results interpretation followed the methods described on the American (P.ginseng), Brazilian (M.ilicifoliaandM.glomerata) and British Pharmacopoeias (H.virginiana,M. recu-tita,P.incarnata,P.boldus and V.officinalis). Those methods are briefly detailed inTable 2.
Results
DNA barcoding efficiency
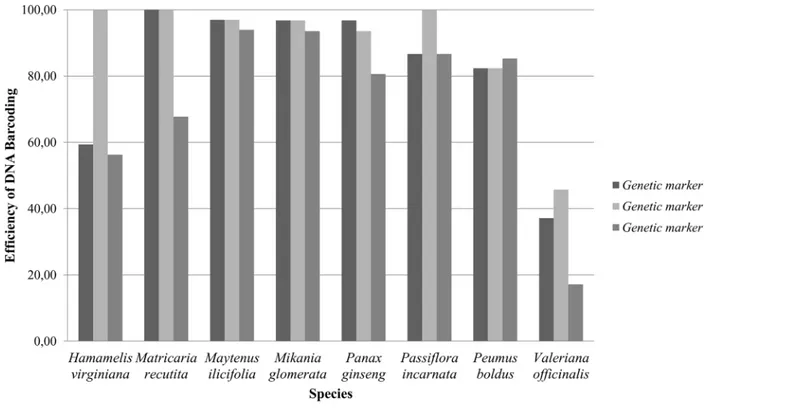
Among the 257 samples used in this study, the protocols for DNA extraction, PCR and se-quencing worked for 209 (81.32%), 228 (88.72%) and 185 (71.98%) of the samples for the markersmatK,rbcLandITS2, respectively. These proportions varied greatly among the various species, withM.ilicifoliaandM.glomeratayielding the best results andV.officinalisgenerating the worst ones (Fig 1). With the exception ofP.boldus, theITS2marker had the fewest samples that passed through the steps of DNA extraction, PCR and sequencing, whereas therbcLregion had the most samples passing through these steps (Fig 1).
In particular, the DNA barcoding protocol did not work properly for herbal medicines ac-quired from drugstores (M.glomeratasample 16,P.ginsengsample 07,P.incarnatasample 08, andP.boldussamples 14 and 17 through 20), with the exception of sample 08 fromP.incarnata. Table 2. Conditions used for the chemical analyses.
Species TLC TLC HPLC UV
Mobile phase Developer solution Mobile phase Diluent and absorbancy
H.
virginiana
Formic acid anidrous: water: ethyl acetate (10:10:80)
Ferric chloride - Phosphomolybdotungistc 760 nm
M.
recutita
Ethyl acetate: toluene (5:95)
Anisaldehyde Phase A (Phosphoric acid: water) 0,5:99,5 Phase B (Phosphoric acid: acetonitrile) 0,5:99,5
-M.ilicifolia Ethyl acetate: Formic acid: water (90:5:5)
Vanillin sulfuric Phase A (water: trifluoroacetic acid 0,05%) Phase B (Acetonitrile: trifluoroacetic acid 0,05%)
-M.
glomerata
Toluene: dicholomethane: acetone (45:25:30)
Ethanolic KOH (50%) Methanol: water (47:53)
-P.
ginseng
Butyl alcohol: ethyl acetate: water (10:2,5:5)
Anisaldehyde in glacial acetic acid plus methanol
Phase A (water) Phase B (Acetonitrile: water) 4:1
-P.
incarnata
Anhydrous formic acid: water: methyl ethyl ketone: ethyl acetate (10:10:30:50)
Diphenyl boric acid amino ethyl ester in methanol plus macrogol in methanol
- Methanol (10 volumes): Glacial acetic acid
(100 volumes): Boric acid 25 g/L (10 mL): oxalic acid (20 g/L) in formic acid anidrous 401nm
P.boldus Diethylamine: metanol: toluene (10:10:80)
Potassium iodobismutate Phase A (0,2 mL Diethylamine: 99,8 mL acetonitrile) Phase B (0,2 mL Diethylamine: 99,8 mL water)
-V.
officinalis
Glacial acetic acid: ethyl acetate: cyclohexane (2:38:60)
Anisaldehyde Phase A (Acetonitrile R1 + Phosphoric acid solution 5 g/L) 20:80 Phase B (Phosphoric acid solution 5 g/L + Acetonitrile R1) 20:80
Samples that failed during the DNA barcoding protocol during the DNA extraction step, amplification step, or sequencing step were labeled as“No sequence”and were not considered in further analyses.
Molecular markers efficacy
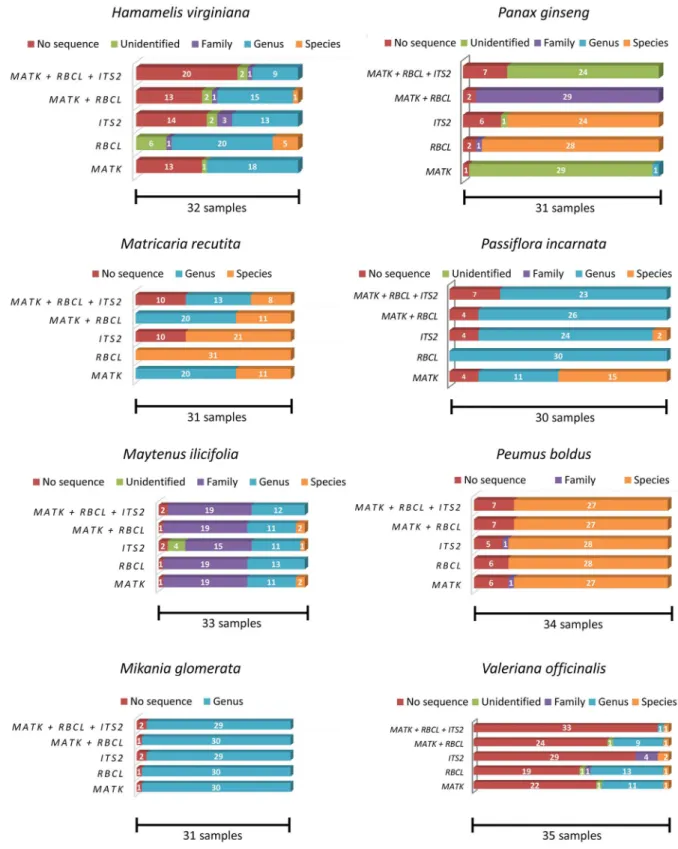
ThematK,rbcL, andITS2markers and their combinations achieved various levels of identifica-tion success for each of the eight medicinal species studied here (Fig 2). In many cases, identifi-cation at the species level was not possible for the species assayed in this work and with the markers used, considering the current amount of species reference sequences (DNA barcodes vouchers) deposited at BOLD and GenBank (S1 Table) because the genetic diversity within the genus was not sufficient to correctly identify a given sample at the species level. Because most of the substitutions found here involved species from different genera or even families, this re-sult did not negatively impact the substitution analyses of this study. When samples were grouped within one of the eight medicinal genera, a barcode gap analysis was applied (Table 3). In some of these cases, it was possible to reach a final conclusion regarding the species identifi-cation, e.g., samples fromMatricaria recutita. However, in other cases, the identification re-mained inconclusive, again because the genetic variation within the genus was not high enough (lower than 1%), even after applying the barcode gap.
Molecular identification and species substitution
The phylogenetic analyses applied to the sequences retrieved from the DNA barcoding meth-odology revealed that all 8 analyzed medicinal species, with the exception ofM.glomerata, had samples that were substituted with other species, genera or even other families (S1–S40Figs). Fig 1. Percentage of samples analyzed according to species and genetic marker.
Fig 2. Identification levels for the analyzed samples when using each or a combination of the chosen markers.No sequence: samples for which the DNA barcoding protocol did not work. Unidentified: samples that could not be identified. The sequences from these samples did not show similarity levels above 98% to any of the sequences within the databases. Family: samples that could be identified at the family level. The sequences from these samples showed equal similarity levels to database sequences from multiple species belonging to the same family. Genus: samples that could be identified to the genus level. The sequences from these samples showed equal similarity levels to database sequences from multiple species belonging to the same genus. Species: samples that could be identified to the species level. The sequences from these samples showed similarity levels above 98% to database sequences from a unique species.
From the samples that passed through the DNA barcoding protocol, 42.06% belonged to the expected genus but could not be identified to the species level; these samples were therefore classified as“inconclusive”in terms of substitutions. The remaining samples were classified as either substitute (71.11%) or authentic (28.89%), depending on the concordance between the expected and observed species (Fig 3). The proportion of samples classified as substitutions varied greatly among the eight species. For example, 100% of the samples presented asP. Table 3. Barcode gap analyses.
SPECIES MAXIMUM INTRASEPECIFIC DIVERGENCE
matK rbcL ITS2 matK + rbcL matK + rbcL + ITS2
Hamamelis virginiana 0,026 X 0,019 0,026 0,033
Matricaria recutita 0,00042 0,00068 0,0058 0,00024 0,0014
Maytenus ilicifolia X 0,016 X 0,028 X
Mikania glomerata 0,0017 0,0005 0,02 0,0005 0,0058
Panax ginseng 0,024 0,021 X 0,028 0,046
Passiflora incarnata X X X 0,035 0,038
Peumus boldus Not applicable*
Valeriana officinalis X X 0,08 X 0,046
The numbers represent the maximum intra-specific divergence. Values above this number were considered as a different species. X—The Barcode Gap was not calculated because there was no clear division between intra- and interspecific genetic divergence.
*The genusPeumuspossess only one specie, which makes the Barcode Gap not applicable.
doi:10.1371/journal.pone.0127866.t003
Fig 3. DNA final barcode identification of the analyzed samples.
ginsengwere actually from the genusPfaffia, a Brazilian ginseng, whereas only 3.45% of the samples presented asP.bolduswere substitutions (Fig 3).
ForH.virginiana, half of the samples (16) belonged to the genusHamamelis (Hamamelida-ceae), and one sample belonged to the same family but was from a genus that could not be de-fined. Five samples could not be identified, and the remaining ten samples were distributed among another seven different families. It is interesting to note the presence of samples identi-fied as Brazilian native species, such asSolanumandLantana, as well as the presence of other species that are also imported to Brazil, such asTilia.
All of the samples fromM.recutita(Asteraceae) corresponded to the correct genus, but twenty samples presented a certain level of genetic diversity for the markermatK(S26 Fig). When the barcode gap analysis was applied, these samples were assigned to a species other thanM.recutita. Despite these observations, those samples were not linked to any other species and their genetic diversity was found to be extremely low (lower than 0,01%).
Although some of the samples labeled asM.ilicifolia(Celastraceae) were found to belong to the genusMaytenus, the majority were identified at the family level (Fabaceae) as one of two species,Zollernia ilicifoliaorLecointea peruviana, and one sample was identified as the genus Roupala(Proteaceae), which includes species that are native to Brazil but morphologically dis-tinct fromM.ilicifoliaand with no previous reports of use in folk medicine (S1 Table).
Neither of the sequences forM.glomerata(Asteraceae) was successful as a tool able to identi-fy substitution because it was impossible to distinguish betweenM.glomerataandM.laevigata.
In the case ofP.ginseng, a species that originated in Asia and was imported to Brazil, most of the samples were identified asPfaffia spp. (Amaranthaceae). This genus contains the species Pfaf-fia glomerata, a plant that is native to Brazil and popularly known as Brazilian ginseng. The only exception for this group was one sample that was identified only at the family level (Amarantha-ceae) but could not be distinguished among the generaPfaffia,HebantheandPseudoplantago.
In the analyses ofP.incarnata(Passifloraceae), two clear substitutions were found of the speciesSenna alexandrina(Fabaceae). All other samples belonged to the genusPassiflora.
Most of the samples ofPeumus(Monimiaceae), a genus with only one species (P.boldus, http://www.theplantlist.org/browse/A/Monimiaceae/Peumus/), were identified as the correct species. One exception was identified asVernonia colorata(Asteraceae) (S1 Table).
ForV.officinalis, the whole process of DNA extraction, amplification and sequencing did not work well and the sequences obtained were mostly low quality. From thirty-five samples, only nineteen (54,28%) could be analyzed using DNA barcoding. Of these, thirteen belonged to the genusValerianabut could not be identified at the species level. Two samples that were identified only at the family level belonged to Asteraceae. One sample was identified as belong-ing to a different genus (Cissampelos). Two other samples were identified as different species: Ageratum conyzoidesandStellaria vestita. One sample could not be identified.
Chemical analysis
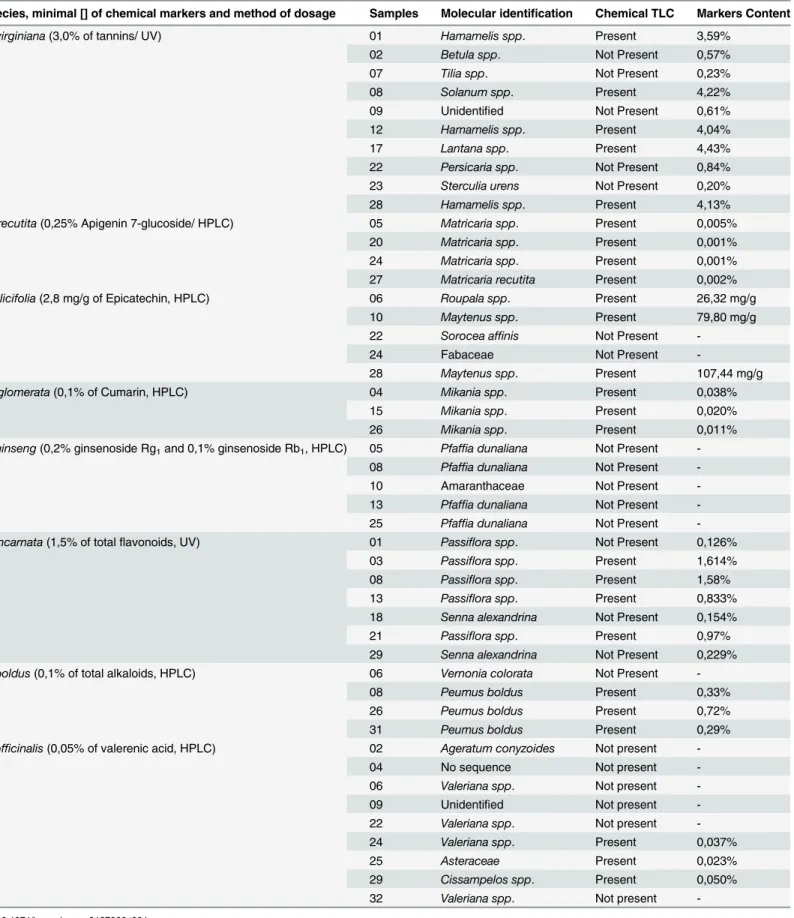
present. As expected, the samples that showed negative results via TLC also showed negative results via HPLC or UV. However, for some samples that were positive via TLC, the chemical marker was not present at the minimum concentration required for validation. This finding was true for samples fromM.recutita,M.glomerata P.incarnataandV.officinalis(Table 4).
Molecular and chemical correlation
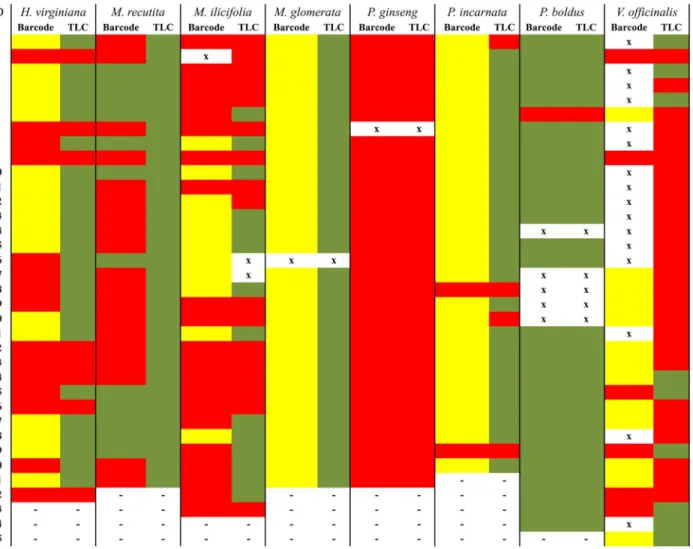
In some cases, samples that were identified as substitutions using molecular analysis actually did contain the expected chemical marker from the labeled species. That was the case for sam-ples fromH.virginiana,M.recutitaandM.ilicifolia(Fig 4). On the other hand, every sample that matched the labeled species according to molecular identification was also positive on the TLC analyses (Fig 4).
During the final step of concentration analyses, HPLC or UV, two interesting points arose. First, the presence of the correct chemical marker(s) in a sample does not mean that the sample contained the minimum concentration required. This result was observed for samples ofM. Fig 4. Comparison between the DNA barcode and TLC findings.ID: sample number. Green: samples that were identified as the expected medicinal species using DNA barcoding and that contained the expected chemical marker from the medicinal species according to TLC. Yellow: samples that were not identified within the genus of the medicinal species using DNA barcoding. Red: samples that were identified using DNA barcoding as a genus or family that varied from the expected one and that did not contain the chemical marker according to TLC. X: samples that did not generate any sequence using DNA barcoding or that could not be tested using TLC. -: absent samples.
Table 4. Molecular identification versus TLC, HPLC and UV analyses.
Species, minimal [] of chemical markers and method of dosage Samples Molecular identification Chemical TLC Markers Content
H.virginiana(3,0% of tannins/ UV) 01 Hamamelis spp. Present 3,59%
02 Betula spp. Not Present 0,57%
07 Tilia spp. Not Present 0,23%
08 Solanum spp. Present 4,22%
09 Unidentified Not Present 0,61%
12 Hamamelis spp. Present 4,04%
17 Lantana spp. Present 4,43%
22 Persicaria spp. Not Present 0,84%
23 Sterculia urens Not Present 0,20%
28 Hamamelis spp. Present 4,13%
M.recutita(0,25% Apigenin 7-glucoside/ HPLC) 05 Matricaria spp. Present 0,005%
20 Matricaria spp. Present 0,001%
24 Matricaria spp. Present 0,001%
27 Matricaria recutita Present 0,002%
M.ilicifolia(2,8 mg/g of Epicatechin, HPLC) 06 Roupala spp. Present 26,32 mg/g
10 Maytenus spp. Present 79,80 mg/g
22 Sorocea affinis Not Present
-24 Fabaceae Not Present
-28 Maytenus spp. Present 107,44 mg/g
M.glomerata(0,1% of Cumarin, HPLC) 04 Mikania spp. Present 0,038%
15 Mikania spp. Present 0,020%
26 Mikania spp. Present 0,011%
P.ginseng(0,2% ginsenoside Rg1and 0,1% ginsenoside Rb1, HPLC) 05 Pfaffia dunaliana Not Present
-08 Pfaffia dunaliana Not Present
-10 Amaranthaceae Not Present
-13 Pfaffia dunaliana Not Present
-25 Pfaffia dunaliana Not Present
-P.incarnata(1,5% of totalflavonoids, UV) 01 Passiflora spp. Not Present 0,126%
03 Passiflora spp. Present 1,614%
08 Passiflora spp. Present 1,58%
13 Passiflora spp. Present 0,833%
18 Senna alexandrina Not Present 0,154%
21 Passiflora spp. Present 0,97%
29 Senna alexandrina Not Present 0,229%
P.boldus(0,1% of total alkaloids, HPLC) 06 Vernonia colorata Not Present
-08 Peumus boldus Present 0,33%
26 Peumus boldus Present 0,72%
31 Peumus boldus Present 0,29%
V.officinalis(0,05% of valerenic acid, HPLC) 02 Ageratum conyzoides Not present
-04 No sequence Not present
-06 Valeriana spp. Not present
-09 Unidentified Not present
-22 Valeriana spp. Not present
-24 Valeriana spp. Present 0,037%
25 Asteraceae Present 0,023%
29 Cissampelos spp. Present 0,050%
32 Valeriana spp. Not present
recutita,M.glomerataandP.incarnata(Table 4). Second, some samples that were identified as substitutions using DNA barcoding but contained the expected chemical marker from the medicinal species also presented the minimum concentration required for validation on HPLC or UV (Table 4). This result was observed for samples fromH.virginiana,M.ilicifoliaand V.officinalis.
Overall,V.officinaliswas the most difficult species to work with during these analyses. The medicinal part ofV.officinalisplants is the roots.V.officinalisroot cells contain a light brown resin [10] that was most likely responsible for the unsatisfactory results of the genetic analyses because it completely inhibited the PCR or generated problems during the amplification pro-cess. Modifications made to the protocols to attempt to resolve this problem were not effective. Only nine samples were positive according to TLC, and of the samples submitted to HPLC, only one (sample 29) met the minimum required concentration. Curiously, this sample was identified from DNA barcoding as belonging to theCissampelosgenus. (Table 4).
Discussion
Plants used to prepare herbal medicines are marketed as crude drugs, and the quality of these materials is currently verified by a set of botanical, physicochemical and chemical analyses that have been established by Pharmacopoeias and other official compendia [48]. Those methods, however, are not completely reliable for species identification, and several studies have revealed species substitutions [19,22,31,49].
DNA-based methods, such as the use of specific DNA sequences as markers for species identification, are used in a range of field, including agriculture [50–52] and zootechny [53–
55], and comprise various methods, such as RAPF, AFLP, PCR-DGGE, real-time PCR and se-quencing-based systems, such as SSR [50,56–59]. Choosing the most appropriate method de-pends on several factors, including the focus of the study [60]. However, the availability of a variety of methods and approaches can also hamper research; the lack of standardization and universality decreases the reproducibility of studies. However, the proposed goal of the DNA barcode project [34] to catalogue universal markers for all life on Earth has the potential to unify DNA-based methods used for species identification.
Using common sets of primers, databases and standards to catalogue species by research groups all around the world increases the level of reliability and the number of species available for study (which has reached the greatest level ever achieved by the scientific community) while also making it possible to identify an ever-growing number of species. The definition of an official DNA barcode for plants was a crucial step, and the sequences chosen have already proven themselves to be of great value [9,60,61]. The discovery of universal primers for the DNA barcode would be the perfect scenario, but this goal may not be achieved. Small nuances in different families, orders and species are responsible for different levels of amplification and in some cases the use of different primers might be the best strategy to follow to make the am-plification and sequencing more efficient.
Processed samples, such as the ones analyzed on this study, are often hard-working, since the isolation of good-quality DNA may be difficult to achieve [62]. Even though we were able to analyze the majority of the samples (233 from 257) using at least one of the three markers, better ways to work with processed samples are becoming available and will be applied in fu-ture studies [43]. An example is the DNA mini-Barcode, based on the analyses of smaller re-gions. A DNA mini-barcode forrbcLis already available [63].
approach has limitations. For all of the samples, the use of therbcLandmatksequences togeth-er only improved species identification in two cases, one forHamamelis(sample 16) and one forPeumus(sample 6); in both of these cases, the samples could be identified to the species level only when the two markers were used together (S4andS34Figs).
The use of the DNA barcoding technology enabled us to detect several substitutions among the analyzed samples. Most substitutions involved species from different genera (or even a dif-ferent family) than those of the expected medicinal species. When analyzing multiple species within the same genus,matKandrbcLwere only rarely able to correctly identify the samples. That was the case for samples belonging to some of the analyzed species. For example, the markers could not distinguish betweenM.glomerataandM.laevigata. Both species are used in folk medicine in Brazil and have the same geographical distribution and several morphological and chemical similarities. For these reasons, it is believed thatM.laevigata, which is not includ-ed in the ANVISA list of approvinclud-ed species for herbal minclud-edicines, is frequently usinclud-ed as a substi-tute forM.glomerata[64]. ForM.ilicifolia, most of the samples belonged toZollernia ilicifolia orLecointea peruviana. These species share similar morphology and likeM.ilicifolia, belong to the clade Lecointea, together with the closely related generaExostyles,Harleyodendronand Holocalyx[65,66]. Most of theP.incarnatasamples belonged to the genusPassiflorabut could not be identified at the species level. ThematKregion showed promising results for differenti-ating species within the genusPassiflora(S26 Fig), but our analysis was ultimately unsuccessful because none of the databases contained this sequence forP.incarnata. Brazil is one of the greatest producers ofPassifloraspecies for food [67], and it is likely that some of that produc-tion ends up being marketed as herbal medicine.
The difficulty in differentiating closely related species is supported by the fact that the meth-odologies used to perform distance-based species discriminations based on DNA barcodes are still being worked out [68,69]. Furthermore, the difficulty in identifying closely related species is especially pronounced in plants [70]. For this reason, the barcode sequences were only recent-ly defined, and the search for better loci continues [43,69]. In this study, we attempted to use the ITS2 region to improve the accuracy of species identification. However, our attempt was not successful, primarily due to difficulties encountered in working with the sequence and the fact that it did not add additional variability compared with analysis based onmatKandrbcL. Some of the substitutions that we identified, such as the generaSolanumandLantanaforH. virginianaor the generaAgeratumandCissampelosforV.officinalis, are most likely a conse-quence of the ease of obtaining samples of the substitutes, which are native to Brazil. In fact, Hamamelis is native to North America, andV.officinalisis native to Europe; it is necessary to im-port both plants for use in Brazil. The same is also true forP.ginseng, but in this specific case, a mistake may have occurred because the Brazilian ginseng (Pfaffia glomerata) and the Asian gin-seng (P.ginseng) are both known as ginseng. Another case of substitution due to popular name confusion may have occurred when the genusSorocea(Moraceae), to which the speciesSorocea bonplandiibelongs, was used as a substituted forM.ilicifolia;Sorocea bonplandiihas the same popular name asM.ilicifoliain Brazil (Espinheira santa) and a similar morphology [65]. Finally, a similar explanation might be responsible for the only substitution found forP.boldus. The genusVernoniacontains the speciesV.condensata, which is known in Brazil as“Boldo baiano”
The parallels between the genetic and chemical analyses proved that it is possible for a sam-ple to pass quality control tests even if it does not belong to the correct species. This result was observed for samples that were identified as substitutions using DNA barcoding but exhibited similarity with the correct species according to TLC and contained concentrations of chemical markers that were above the required minimums (H.virginianasamples 08 and 17,M.ilicifolia sample 06, andV.officinalissample 29). These results may be attributed to the specificity of the chemical markers; even though some of these chemicals substances used as markers, such as valerenic acid, are very specific, others (such as tannins) are common to a large variety of plants. However, these analyses also demonstrated that correct species identification is not suf-ficient because the active compound may not be present in the samples or may be below the minimum required concentration. Thus, when taking into account the results of DNA barcod-ing, TLC and HPLC or UV, the complementarity of the tests becomes clear.
In addition to the health implications of the correct use of the approved medicinal species, another factor that should be considered is the possible environmental impacts of these plants. It is estimated that one in every five vegetal species in the world is threatened. It has been sug-gested that the herbal market poses a threat to biodiversity through the over-harvesting of raw materials [31,74–76]. In a previous study, our group demonstrated positive results regarding the inhibition of native species collection in the wild by pharmaceutical companies following the establishment of rules from the Brazilian Health Ministry [77]. The impact of the use of na-tive materials sold in popular markets, however, is difficult to estimate because these materials are obtained from various suppliers and from unmanaged forests. If the findings of this study are cross-referenced with the Official List of Endangered Species of the Brazilian Flora [78], the generaSolanum(one species),Maytenus(four species),Mikania(six species),Pfaffia(three species),Passiflora(five species), andVernonia(fifteen species) are all represented, demon-strating that correct species identification is required to prevent the use of threatened species.
Conclusions
The present study showed a great number of species substitutions and mislabeling, demon-strating that the current surveillance methods are not being efficient to control he herbal medi-cine market. Also, we showed that the traditional methodologies of species identification using chemical analysis are, in the majority of cases, not adequate to correctly identify a plant species. Thus, we propose the use of DNA barcode as a powerful first screening step. Applying the DNA barcode technique to the quality control of herbal medicine production will make the process safer, more reliable, and cheaper because substitutions will be promptly discarded without requiring more expensive chemical analyses that are otherwise necessary.
Supporting Information
S2 Fig. Phylogenetic treeHammamelis virginiana rbcL.The evolutionary history was in-ferred using the Neighbor-Joining method. The optimal tree with the sum of branch length = 0.67568534 is shown. The percentage of replicate trees in which the associated taxa clustered together in the bootstrap test (500 replicates) are shown next to the branches. The tree is drawn to scale, with branch lengths in the same units as those of the evolutionary dis-tances used to infer the phylogenetic tree. The evolutionary disdis-tances were computed using the Maximum Composite Likelihood method and are in the units of the number of base substitu-tions per site. The analysis involved 370 nucleotide sequences. Codon posisubstitu-tions included were 1st+2nd+3rd+Noncoding. All positions containing gaps and missing data were eliminated. There were a total of 215 positions in the final dataset. Evolutionary analyses were conducted in MEGA5.
(PDF)
S3 Fig. Phylogenetic treeHammamelis virginiana ITS2.The evolutionary history was in-ferred using the Neighbor-Joining method. The optimal tree with the sum of branch length = 0.71702123 is shown. The percentage of replicate trees in which the associated taxa clustered together in the bootstrap test (500 replicates) are shown next to the branches. The tree is drawn to scale, with branch lengths in the same units as those of the evolutionary dis-tances used to infer the phylogenetic tree. The evolutionary disdis-tances were computed using the Maximum Composite Likelihood method and are in the units of the number of base substitu-tions per site. The analysis involved 207 nucleotide sequences. Codon posisubstitu-tions included were 1st+2nd+3rd+Noncoding. All positions containing gaps and missing data were eliminated. There were a total of 13 positions in the final dataset. Evolutionary analyses were conducted in MEGA5.
(PDF)
S4 Fig. Phylogenetic treeHammamelis virginiana matK + rbcL.The evolutionary history was inferred using the Neighbor-Joining method. The optimal tree with the sum of branch length = 0.86650001 is shown. The percentage of replicate trees in which the associated taxa clustered together in the bootstrap test (500 replicates) are shown next to the branches. The tree is drawn to scale, with branch lengths in the same units as those of the evolutionary dis-tances used to infer the phylogenetic tree. The evolutionary disdis-tances were computed using the Maximum Composite Likelihood method and are in the units of the number of base substitu-tions per site. The analysis involved 189 nucleotide sequences. Codon posisubstitu-tions included were 1st+2nd+3rd+Noncoding. All positions containing gaps and missing data were eliminated. There were a total of 620 positions in the final dataset. Evolutionary analyses were conducted in MEGA5.
(PDF)
S6 Fig. Phylogenetic treeMatricaria recutita matK.The evolutionary history was inferred using the Neighbor-Joining method. The optimal tree with the sum of branch
length = 0.00478244 is shown. The percentage of replicate trees in which the associated taxa clustered together in the bootstrap test (500 replicates) are shown next to the branches. The tree is drawn to scale, with branch lengths in the same units as those of the evolutionary dis-tances used to infer the phylogenetic tree. The evolutionary disdis-tances were computed using the Maximum Composite Likelihood method and are in the units of the number of base substitu-tions per site. The analysis involved 36 nucleotide sequences. Codon posisubstitu-tions included were 1st+2nd+3rd+Noncoding. All positions containing gaps and missing data were eliminated. There were a total of 631 positions in the final dataset. Evolutionary analyses were conducted in MEGA5.
(PDF)
S7 Fig. Phylogenetic treeMatricaria recutita rbcL.The evolutionary history was inferred using the Neighbor-Joining method. The optimal tree with the sum of branch
length = 0.00211645 is shown. The percentage of replicate trees in which the associated taxa clustered together in the bootstrap test (500 replicates) are shown next to the branches. The tree is drawn to scale, with branch lengths in the same units as those of the evolutionary dis-tances used to infer the phylogenetic tree. The evolutionary disdis-tances were computed using the Maximum Composite Likelihood method and are in the units of the number of base substitu-tions per site. The analysis involved 36 nucleotide sequences. Codon posisubstitu-tions included were 1st+2nd+3rd+Noncoding. All positions containing gaps and missing data were eliminated. There were a total of 473 positions in the final dataset. Evolutionary analyses were conducted in MEGA5.
(PDF)
S8 Fig. Phylogenetic treeMatricaria recutita ITS2.The evolutionary history was inferred using the Neighbor-Joining method. The optimal tree with the sum of branch
length = 0.12287265 is shown. The percentage of replicate trees in which the associated taxa clustered together in the bootstrap test (500 replicates) are shown next to the branches. The tree is drawn to scale, with branch lengths in the same units as those of the evolutionary dis-tances used to infer the phylogenetic tree. The evolutionary disdis-tances were computed using the Maximum Composite Likelihood method and are in the units of the number of base substitu-tions per site. The analysis involved 27 nucleotide sequences. Codon posisubstitu-tions included were 1st+2nd+3rd+Noncoding. All positions containing gaps and missing data were eliminated. There were a total of 191 positions in the final dataset. Evolutionary analyses were conducted in MEGA5.
(PDF)
S9 Fig. Phylogenetic treeMatricaria recutita matK + rbcL.The evolutionary history was in-ferred using the Neighbor-Joining method. The optimal tree with the sum of branch
S10 Fig. Phylogenetic treeMatricaria recutita matK + rbcL + ITS2.The evolutionary history was inferred using the Neighbor-Joining method. The optimal tree with the sum of branch length = 0.00534820 is shown. The percentage of replicate trees in which the associated taxa clustered together in the bootstrap test (500 replicates) are shown next to the branches. The tree is drawn to scale, with branch lengths in the same units as those of the evolutionary dis-tances used to infer the phylogenetic tree. The evolutionary disdis-tances were computed using the Maximum Composite Likelihood method and are in the units of the number of base substitu-tions per site. The analysis involved 24 nucleotide sequences. Codon posisubstitu-tions included were 1st+2nd+3rd+Noncoding. All positions containing gaps and missing data were eliminated. There were a total of 1319 positions in the final dataset. Evolutionary analyses were conducted in MEGA5.
(PDF)
S11 Fig. Phylogenetic treeMaytenus ilicifolia matK.The evolutionary history was inferred using the Neighbor-Joining method. The optimal tree with the sum of branch
length = 0.39435507 is shown. The percentage of replicate trees in which the associated taxa clustered together in the bootstrap test (500 replicates) are shown next to the branches. The tree is drawn to scale, with branch lengths in the same units as those of the evolutionary dis-tances used to infer the phylogenetic tree. The evolutionary disdis-tances were computed using the Maximum Composite Likelihood method and are in the units of the number of base substitu-tions per site. The analysis involved 112 nucleotide sequences. Codon posisubstitu-tions included were 1st+2nd+3rd+Noncoding. All positions containing gaps and missing data were eliminated. There were a total of 98 positions in the final dataset. Evolutionary analyses were conducted in MEGA5.
(PDF)
S12 Fig. Phylogenetic treeMaytenus ilicifolia rbcL.The evolutionary history was inferred using the Neighbor-Joining method. The optimal tree with the sum of branch
length = 0.16105704 is shown. The percentage of replicate trees in which the associated taxa clustered together in the bootstrap test (500 replicates) are shown next to the branches. The tree is drawn to scale, with branch lengths in the same units as those of the evolutionary dis-tances used to infer the phylogenetic tree. The evolutionary disdis-tances were computed using the Maximum Composite Likelihood method and are in the units of the number of base substitu-tions per site. The analysis involved 84 nucleotide sequences. Codon posisubstitu-tions included were 1st+2nd+3rd+Noncoding. All positions containing gaps and missing data were eliminated. There were a total of 370 positions in the final dataset. Evolutionary analyses were conducted in MEGA5.
(PDF)
S13 Fig. Phylogenetic treeMaytenus ilicifolia ITS2.The evolutionary history was inferred using the Neighbor-Joining method. The optimal tree with the sum of branch
S14 Fig. Phylogenetic treeMaytenus ilicifolia matK + rbcL.The evolutionary history was in-ferred using the Neighbor-Joining method. The optimal tree with the sum of branch
length = 0.22908763 is shown. The percentage of replicate trees in which the associated taxa clustered together in the bootstrap test (500 replicates) are shown next to the branches. The tree is drawn to scale, with branch lengths in the same units as those of the evolutionary dis-tances used to infer the phylogenetic tree. The evolutionary disdis-tances were computed using the Maximum Composite Likelihood method and are in the units of the number of base substitu-tions per site. The analysis involved 75 nucleotide sequences. Codon posisubstitu-tions included were 1st+2nd+3rd+Noncoding. All positions containing gaps and missing data were eliminated. There were a total of 518 positions in the final dataset. Evolutionary analyses were conducted in MEGA5.
(PDF)
S15 Fig. Phylogenetic treeMaytenus ilicifolia matK + rbcL + ITS2.The evolutionary history was inferred using the Neighbor-Joining method. The optimal tree with the sum of branch length = 0.31908268 is shown. The percentage of replicate trees in which the associated taxa clustered together in the bootstrap test (500 replicates) are shown next to the branches. The tree is drawn to scale, with branch lengths in the same units as those of the evolutionary dis-tances used to infer the phylogenetic tree. The evolutionary disdis-tances were computed using the Maximum Composite Likelihood method and are in the units of the number of base substitu-tions per site. The analysis involved 39 nucleotide sequences. Codon posisubstitu-tions included were 1st+2nd+3rd+Noncoding. All positions containing gaps and missing data were eliminated. There were a total of 858 positions in the final dataset. Evolutionary analyses were conducted in MEGA5.
(PDF)
S16 Fig. Phylogenetic treeMikania glomerata matK.The evolutionary history was inferred using the Neighbor-Joining method. The optimal tree with the sum of branch
length = 0.00738890 is shown. The percentage of replicate trees in which the associated taxa clustered together in the bootstrap test (500 replicates) are shown next to the branches. The tree is drawn to scale, with branch lengths in the same units as those of the evolutionary dis-tances used to infer the phylogenetic tree. The evolutionary disdis-tances were computed using the Maximum Composite Likelihood method and are in the units of the number of base substitu-tions per site. The analysis involved 46 nucleotide sequences. Codon posisubstitu-tions included were 1st+2nd+3rd+Noncoding. All positions containing gaps and missing data were eliminated. There were a total of 679 positions in the final dataset. Evolutionary analyses were conducted in MEGA5.
(PDF)
S17 Fig. Phylogenetic treeMikania glomerata rbcL.The evolutionary history was inferred using the Neighbor-Joining method. The optimal tree with the sum of branch
S18 Fig. Phylogenetic treeMikania glomerata ITS2.The evolutionary history was inferred using the Neighbor-Joining method. The optimal tree with the sum of branch
length = 0.21453668 is shown. The percentage of replicate trees in which the associated taxa clustered together in the bootstrap test (500 replicates) are shown next to the branches. The tree is drawn to scale, with branch lengths in the same units as those of the evolutionary dis-tances used to infer the phylogenetic tree. The evolutionary disdis-tances were computed using the Maximum Composite Likelihood method and are in the units of the number of base substitu-tions per site. The analysis involved 49 nucleotide sequences. Codon posisubstitu-tions included were 1st+2nd+3rd+Noncoding. All positions containing gaps and missing data were eliminated. There were a total of 220 positions in the final dataset. Evolutionary analyses were conducted in MEGA5.
(PDF)
S19 Fig. Phylogenetic treeMikania glomerata matK + rbcL.The evolutionary history was in-ferred using the Neighbor-Joining method. The optimal tree with the sum of branch
length = 0.00165371 is shown. The percentage of replicate trees in which the associated taxa clustered together in the bootstrap test (500 replicates) are shown next to the branches. The tree is drawn to scale, with branch lengths in the same units as those of the evolutionary dis-tances used to infer the phylogenetic tree. The evolutionary disdis-tances were computed using the Maximum Composite Likelihood method and are in the units of the number of base substitu-tions per site. The analysis involved 45 nucleotide sequences. Codon posisubstitu-tions included were 1st+2nd+3rd+Noncoding. All positions containing gaps and missing data were eliminated. There were a total of 1210 positions in the final dataset. Evolutionary analyses were conducted in MEGA5.
(PDF)
S20 Fig. Phylogenetic treeMikania glomerata matK + rbcL + ITS2.The evolutionary history was inferred using the Neighbor-Joining method. The optimal tree with the sum of branch length = 0.02267872 is shown. The percentage of replicate trees in which the associated taxa clustered together in the bootstrap test (500 replicates) are shown next to the branches. The tree is drawn to scale, with branch lengths in the same units as those of the evolutionary dis-tances used to infer the phylogenetic tree. The evolutionary disdis-tances were computed using the Maximum Composite Likelihood method and are in the units of the number of base substitu-tions per site. The analysis involved 41 nucleotide sequences. Codon posisubstitu-tions included were 1st+2nd+3rd+Noncoding. All positions containing gaps and missing data were eliminated. There were a total of 1435 positions in the final dataset. Evolutionary analyses were conducted in MEGA5.
(PDF)
S21 Fig. Phylogenetic treePanax ginseng matK.The evolutionary history was inferred using the Neighbor-Joining method. The optimal tree with the sum of branch length = 0.24952737 is shown. The percentage of replicate trees in which the associated taxa clustered together in the bootstrap test (500 replicates) are shown next to the branches. The tree is drawn to scale, with branch lengths in the same units as those of the evolutionary distances used to infer the phylo-genetic tree. The evolutionary distances were computed using the Maximum Composite Likeli-hood method and are in the units of the number of base substitutions per site. The analysis involved 180 nucleotide sequences. Codon positions included were 1st+2nd+3rd+Noncoding. All positions containing gaps and missing data were eliminated. There were a total of 490 posi-tions in the final dataset. Evolutionary analyses were conducted in MEGA5.
S22 Fig. Phylogenetic treePanax ginseng rbcL.The evolutionary history was inferred using the Neighbor-Joining method. The optimal tree with the sum of branch length = 0.10182289 is shown. The percentage of replicate trees in which the associated taxa clustered together in the bootstrap test (500 replicates) are shown next to the branches. The tree is drawn to scale, with branch lengths in the same units as those of the evolutionary distances used to infer the phylo-genetic tree. The evolutionary distances were computed using the Maximum Composite Likeli-hood method and are in the units of the number of base substitutions per site. The analysis involved 72 nucleotide sequences. Codon positions included were 1st+2nd+3rd+Noncoding. All positions containing gaps and missing data were eliminated. There were a total of 360 posi-tions in the final dataset. Evolutionary analyses were conducted in MEGA5.
(PDF)
S23 Fig. Phylogenetic treePanax ginseng ITS2.The evolutionary history was inferred using the Neighbor-Joining method. The optimal tree with the sum of branch length = 1,22004815 is shown. The percentage of replicate trees in which the associated taxa clustered together in the bootstrap test (500 replicates) are shown next to the branches. The tree is drawn to scale, with branch lengths in the same units as those of the evolutionary distances used to infer the phylo-genetic tree. The evolutionary distances were computed using the Maximum Composite Likeli-hood method and are in the units of the number of base substitutions per site. The analysis involved 234 nucleotide sequences. Codon positions included were 1st+2nd+3rd+Noncoding. All positions containing gaps and missing data were eliminated. There were a total of 78 posi-tions in the final dataset. Evolutionary analyses were conducted in MEGA5.
(PDF)
S24 Fig. Phylogenetic treePanax ginseng matK + rbcL.The evolutionary history was inferred using the Neighbor-Joining method. The optimal tree with the sum of branch
length = 0.27861795 is shown. The percentage of replicate trees in which the associated taxa clustered together in the bootstrap test (500 replicates) are shown next to the branches. The tree is drawn to scale, with branch lengths in the same units as those of the evolutionary dis-tances used to infer the phylogenetic tree. The evolutionary disdis-tances were computed using the Maximum Composite Likelihood method and are in the units of the number of base substitu-tions per site. The analysis involved 72 nucleotide sequences. Codon posisubstitu-tions included were 1st+2nd+3rd+Noncoding. All positions containing gaps and missing data were eliminated. There were a total of 850 positions in the final dataset. Evolutionary analyses were conducted in MEGA5.
(PDF)
S25 Fig. Phylogenetic treePanax ginseng matK + rbcL + ITS2.The evolutionary history was inferred using the Neighbor-Joining method. The optimal tree with the sum of branch length = 0.29889235 is shown. The percentage of replicate trees in which the associated taxa clustered together in the bootstrap test (500 replicates) are shown next to the branches. The tree is drawn to scale, with branch lengths in the same units as those of the evolutionary dis-tances used to infer the phylogenetic tree. The evolutionary disdis-tances were computed using the Maximum Composite Likelihood method and are in the units of the number of base substitu-tions per site. The analysis involved 65 nucleotide sequences. Codon posisubstitu-tions included were 1st+2nd+3rd+Noncoding. All positions containing gaps and missing data were eliminated. There were a total of 935 positions in the final dataset. Evolutionary analyses were conducted in MEGA5.
S26 Fig. Phylogenetic treePassiflora incarnata matK.The evolutionary history was inferred using the Neighbor-Joining method. The optimal tree with the sum of branch
length = 0.83753081 is shown. The percentage of replicate trees in which the associated taxa clustered together in the bootstrap test (500 replicates) are shown next to the branches. The tree is drawn to scale, with branch lengths in the same units as those of the evolutionary dis-tances used to infer the phylogenetic tree. The evolutionary disdis-tances were computed using the Kimura 2-parameter method and are in the units of the number of base substitutions per site. The analysis involved 191 nucleotide sequences. Codon positions included were 1st+2nd+3rd +Noncoding. All positions containing gaps and missing data were eliminated. There were a total of 530 positions in the final dataset. Evolutionary analyses were conducted in MEGA5. (PDF)
S27 Fig. Phylogenetic treePassiflora incarnata rbcL.The evolutionary history was inferred using the Neighbor-Joining method. The optimal tree with the sum of branch
length = 0.64321259 is shown. The percentage of replicate trees in which the associated taxa clustered together in the bootstrap test (500 replicates) are shown next to the branches. The tree is drawn to scale, with branch lengths in the same units as those of the evolutionary dis-tances used to infer the phylogenetic tree. The evolutionary disdis-tances were computed using the Kimura 2-parameter method and are in the units of the number of base substitutions per site. The analysis involved 234 nucleotide sequences. Codon positions included were 1st+2nd+3rd +Noncoding. All positions containing gaps and missing data were eliminated. There were a total of 512 positions in the final dataset. Evolutionary analyses were conducted in MEGA5. (PDF)
S28 Fig. Phylogenetic treePassiflora incarnata ITS2.The evolutionary history was inferred using the Neighbor-Joining method. The optimal tree with the sum of branch
length = 2.20614488 is shown. The percentage of replicate trees in which the associated taxa clustered together in the bootstrap test (500 replicates) are shown next to the branches. The tree is drawn to scale, with branch lengths in the same units as those of the evolutionary dis-tances used to infer the phylogenetic tree. The evolutionary disdis-tances were computed using the Kimura 2-parameter method and are in the units of the number of base substitutions per site. The analysis involved 259 nucleotide sequences. Codon positions included were 1st+2nd+3rd +Noncoding. All positions containing gaps and missing data were eliminated. There were a total of 77 positions in the final dataset. Evolutionary analyses were conducted in MEGA5. (PDF)
S29 Fig. Phylogenetic treePassiflora incarnata matK + rbcL.The evolutionary history was inferred using the Neighbor-Joining method. The optimal tree with the sum of branch length = 0.46000144 is shown. The percentage of replicate trees in which the associated taxa clustered together in the bootstrap test (500 replicates) are shown next to the branches. The tree is drawn to scale, with branch lengths in the same units as those of the evolutionary dis-tances used to infer the phylogenetic tree. The evolutionary disdis-tances were computed using the Kimura 2-parameter method and are in the units of the number of base substitutions per site. The analysis involved 64 nucleotide sequences. Codon positions included were 1st+2nd+3rd+-Noncoding. All positions containing gaps and missing data were eliminated. There were a total of 1045 positions in the final dataset. Evolutionary analyses were conducted in MEGA5. (PDF)
clustered together in the bootstrap test (500 replicates) are shown next to the branches. The tree is drawn to scale, with branch lengths in the same units as those of the evolutionary dis-tances used to infer the phylogenetic tree. The evolutionary disdis-tances were computed using the Kimura 2-parameter method and are in the units of the number of base substitutions per site. The analysis involved 46 nucleotide sequences. Codon positions included were 1st+2nd+3rd+-Noncoding. All positions containing gaps and missing data were eliminated. There were a total of 1191 positions in the final dataset. Evolutionary analyses were conducted in MEGA5. (PDF)
S31 Fig. Phylogenetic treePeumus boldus matK.The evolutionary history was inferred using the Neighbor-Joining method. The optimal tree with the sum of branch length = 0.46390557 is shown. The percentage of replicate trees in which the associated taxa clustered together in the bootstrap test (500 replicates) are shown next to the branches. The tree is drawn to scale, with branch lengths in the same units as those of the evolutionary distances used to infer the phylo-genetic tree. The evolutionary distances were computed using the Kimura 2-parameter method and are in the units of the number of base substitutions per site. The analysis involved 53 nucle-otide sequences. Codon positions included were 1st+2nd+3rd+Noncoding. All positions con-taining gaps and missing data were eliminated. There were a total of 421 positions in the final dataset. Evolutionary analyses were conducted in MEGA5.
(PDF)
S32 Fig. Phylogenetic treePeumus boldus rbcL.The evolutionary history was inferred using the Neighbor-Joining method. The optimal tree with the sum of branch length = 0.13298911 is shown. The percentage of replicate trees in which the associated taxa clustered together in the bootstrap test (500 replicates) are shown next to the branches. The tree is drawn to scale, with branch lengths in the same units as those of the evolutionary distances used to infer the phylo-genetic tree. The evolutionary distances were computed using the Kimura 2-parameter method and are in the units of the number of base substitutions per site. The analysis involved 53 nucle-otide sequences. Codon positions included were 1st+2nd+3rd+Noncoding. All positions con-taining gaps and missing data were eliminated. There were a total of 502 positions in the final dataset. Evolutionary analyses were conducted in MEGA5.
(PDF)
S33 Fig. Phylogenetic treePeumus boldus ITS2.The evolutionary history was inferred using the Neighbor-Joining method. The optimal tree with the sum of branch length = 0.40028624 is shown. The percentage of replicate trees in which the associated taxa clustered together in the bootstrap test (500 replicates) are shown next to the branches. The tree is drawn to scale, with branch lengths in the same units as those of the evolutionary distances used to infer the phylo-genetic tree. The evolutionary distances were computed using the Kimura 2-parameter method and are in the units of the number of base substitutions per site. The analysis involved 92 nucle-otide sequences. Codon positions included were 1st+2nd+3rd+Noncoding. All positions con-taining gaps and missing data were eliminated. There were a total of 65 positions in the final dataset. Evolutionary analyses were conducted in MEGA5.
(PDF)
Kimura 2-parameter method and are in the units of the number of base substitutions per site. The analysis involved 48 nucleotide sequences. Codon positions included were 1st+2nd+3rd+-Noncoding. All positions containing gaps and missing data were eliminated. There were a total of 928 positions in the final dataset. Evolutionary analyses were conducted in MEGA5. (PDF)
S35 Fig. Phylogenetic treePeumus boldus matK + rbcL + ITS2.The evolutionary history was inferred using the Neighbor-Joining method. The optimal tree with the sum of branch
length = 0.17636441 is shown. The percentage of replicate trees in which the associated taxa clustered together in the bootstrap test (500 replicates) are shown next to the branches. The tree is drawn to scale, with branch lengths in the same units as those of the evolutionary dis-tances used to infer the phylogenetic tree. The evolutionary disdis-tances were computed using the Kimura 2-parameter method and are in the units of the number of base substitutions per site. The analysis involved 31 nucleotide sequences. Codon positions included were 1st+2nd+3rd+-Noncoding. All positions containing gaps and missing data were eliminated. There were a total of 998 positions in the final dataset. Evolutionary analyses were conducted in MEGA5. (PDF)
S36 Fig. Phylogenetic treeValeriana officinalis matK.The evolutionary history was inferred using the Neighbor-Joining method. The optimal tree with the sum of branch
length = 1.06223373 is shown. The percentage of replicate trees in which the associated taxa clustered together in the bootstrap test (500 replicates) are shown next to the branches. The tree is drawn to scale, with branch lengths in the same units as those of the evolutionary dis-tances used to infer the phylogenetic tree. The evolutionary disdis-tances were computed using the Kimura 2-parameter method and are in the units of the number of base substitutions per site. The analysis involved 125 nucleotide sequences. Codon positions included were 1st+2nd+3rd +Noncoding. All positions containing gaps and missing data were eliminated. There were a total of 525 positions in the final dataset. Evolutionary analyses were conducted in MEGA5. (PDF)
S37 Fig. Phylogenetic treeValeriana officinalis rbcL.The evolutionary history was inferred using the Neighbor-Joining method. The optimal tree with the sum of branch
length = 0.45263449 is shown. The percentage of replicate trees in which the associated taxa clustered together in the bootstrap test (500 replicates) are shown next to the branches. The tree is drawn to scale, with branch lengths in the same units as those of the evolutionary dis-tances used to infer the phylogenetic tree. The evolutionary disdis-tances were computed using the Kimura 2-parameter method and are in the units of the number of base substitutions per site. The analysis involved 155 nucleotide sequences. Codon positions included were 1st+2nd+3rd +Noncoding. All positions containing gaps and missing data were eliminated. There were a total of 474 positions in the final dataset. Evolutionary analyses were conducted in MEGA5. (PDF)
S38 Fig. Phylogenetic treeValeriana officinalis ITS2.The evolutionary history was inferred using the Neighbor-Joining method. The optimal tree with the sum of branch