Heating rate dependence of anatase to rutile transformation
Pietro Galizia
1,2,∗, Giovanni Maizza
2, Carmen Galassi
11CNR-ISTEC National Research Council of Italy - Institute of Science and Technology for Ceramics,
Faenza (RA), 48018 Italy
2Polytechnic of Turin, Department of Applied Science and Technology, Torino (TO), 10129 Italy
Received 22 August 2016; Received in revised form 28 October 2016; Accepted 16 November 2016
Abstract
Commercial titania powders were calcined in order to investigate the influence of the heating history on the thermally stable phase (rutile). Temperatures from 620 to 700 °C and heating rates from 50 to 300 °C/h were used in order to evaluate their influence on the kinetics of transformation and microstructure evolution. The quantitative analysis of anatase-rutile mixtures based on X-ray diffraction intensities was performed. The re-sults were plotted as cumulative transformation rate vs. cumulative coarsening rate in order to address the heating history of the anatase to rutile transformation. As the main result it was found that the amount of anatase transformed into rutile increases with increasing heating rate at fixed soaking time and temperature of calcination. Through linear extrapolation of experimental data obtained from the calcined commercial titania Degussa P25, it was found that 83 nm for the rutile crystallite size is the lowest limit needed for getting 100% of rutile powders. A substantial improvement in the anatase to rutile kinetic transformation was achieved after pressing the starting powders in order to exploit the interface nucleation.
Keywords: titania, calcination, X-ray diffraction, polymorphic phase transformation kinetic
I. Introduction
Titanium dioxide (TiO2) is a very well-known di-electric material in each of its naturally occurring poly-morphic phases: anatase (tetragonal I4/amd), brookite
(orthorhombicPcab), and rutile (tetragonalP42/mnm)
[1]. Since 1941 the rutile, with a dielectric constant of around 100–150 (at room temperature and in the range of 100 Hz to 1 MHz) [2,3] showed the highest values [4,5]. Therefore a great quantity of research has been brought out to study the preparation, anomalous be-haviour and potential applications of this material [6– 12]. Today, the titania powder is mainly used in the anatase form in applications such as solar energy storage cells [13,14], catalysts and degradation of organic com-pounds [15–20]. Rutile does not show the high photo-reactivity of anatase [21] and is used mainly for pig-ments due to its effective high light scattering [22] and
also for its large static dielectric constant [19,23]. More-over there are many researches that have demonstrated
∗Corresponding author: tel:+39 0546699777,
e-mail:[email protected](P. Galizia) e-mail:[email protected](G. Maizza) e-mail:[email protected](C. Galassi)
rutile’s photocatalytic activity similar to anatase when the crystal size of both phases was comparable [24]. This goal was achieved when the rutile was not pre-pared as thermally stable phase as reported by Eraiah
et al.[25].
The Degussa P25 TiO2 (P25) is a largely used commercial material supplied as a powder mixture of anatase (major) and rutile and amorphous (minor) phases with different ratios depending on the batch [26].
The powder is a mixture of anatase and rutile in the ratio about 3:1, and rutile is present as separate phase and does not exist on the surface of the individual par-ticles of anatase [27]. The existence of two different
phases, their unknown precise amount, and the nano-metric sized particles may give some problems dur-ing the synthesis, shapdur-ing and sinterdur-ing of ceramic ma-terials. In particular, the presence of nanosized parti-cles, especially when mixed with micronic powders and high density difference between anatase (size: 24.5 nm;
bulk density: 3.893 g/cm3, ICDD-PDF-2 code number
00-021-1272) and rutile (size: 44.1 nm; bulk density: 4.25 g/cm3 ICDD-PDF-2 code number 00-021-1276),
nanopar-ticles with high surface area contributes non-negligibly to the chemical potential by changing the activation en-ergy for the phase transformation. For example, in the phase diagrams taken into consideration, there is a sig-nificant difference from the value reported by Dachille
et al. [28], which plotted the extrapolations to
atmo-spheric pressure of the anatase-rutile boundaries inter-secting the temperature axis at 605 °C, in comparison to the anatase-rutile phase transition temperature reported more recently by Sunet al.[25] and fixed at 780 °C.
Fur-ther, the phase stability, that, at room temperature and for macro-crystalline powders, is higher for rutile than for anatase, reverses when particle size becomes less than 10–15 nm [29–31]. Thus, by varying the initial size of TiO2nanoparticles the phase transformation reaction path changes, both in terms of transition onset point and growth rate. The significant change of transfor-mation rate and activation energy (about 165.6 kJ/mol
and over 330 kJ/mol, respectively, for rutile nucleation,
within nanocrystalline anatase particles and coarse ones [32,33]) result into a transition temperature that can vary from 400 °C to 1200 °C [25,34,35].
The anatase to rutile transformation occurs with a coarsening mechanism. On the other hand, the rutile cleation is dominated by surface nucleation (surface nu-cleation>interface nucleation>bulk nucleation) [36].
This transformation can be regarded as reconstructive phase transformation, which requires repositioning of both Ti cations and change in the oxygen arrangement. This implies that at the interface of two anatase parti-cles atomic migration is the primary driving force for the formation and growth of rutile nuclei. The migra-tion is strongly dependent on potential driving forces for anatase to rutile transition that decreases at increas-ing anatase particle size and correlated surface area. The transition driving force is due to the atoms in the de-fect sites which have higher energy than those in the main lattice and can favourably act as nucleation sites for the rutile phase formation at the surface of anatase crystallites. Thus, rutile nuclei keep consuming anatase particles from their interface until its total free energy becomes equal to or smaller than that of anatase. There-fore, it is easier to overcome the energy barrier to start the transformation of anatase to rutile with finer parti-cles due to their higher free surface area and concentra-tion of anatase particle-particle contact points. Since the anatase particle-particle boundaries are the nucleation sites for the polymorphic phase transition, the phase transformation rate of nanocrystalline anatase can be re-lated to the “concentration” of anatase particles [32]. The kinetics of the anatase-to-rutile phase transforma-tion was investigated by several researchers (as well summarized by Zhang and Banfield [32]) and studied as a function of temperature, pressure, particle size, ad-ditive/dopant, hydrothermal condition but the influence
of heating rate during the transformation has not been emphasized.
This work aims to find the best calcination cycle - in
air and with “natural” cooling in oven (without quench-ing treatment) - in order to achieve the highest trans-formation rate of the anatase into rutile in commercial P25 powder, while keeping the crystallite size and par-ticle size distribution, respectively, as low and as uni-form as possible [8], and to improve the quality of the calcined P25 powder for applications as a filler or pre-cursor for functional ceramic composites [37,38]. Liet al. [3] observed that the particle sizes become larger
and non-uniform with the increase of the annealing tem-perature. Therefore temperature and time of calcination must be kept as low as possible. So the approach is to increase the heating rate in order to boost the non-equilibrium transition from anatase to rutile by exploit-ing the higher surface areas, so as to reduce the activa-tion energy needed for transiactiva-tion [36]; the requested en-ergy will be available if the surface area and particle ra-dius of anatase particles, respectively, are as high and as low as possible when the onset temperature (related to the particle size at the starting point) is reached. The full transformation was achieved by shaping the powders in a compacted green body in order to increase the con-tact points between the particles of anatase. In this way the coarsening mechanism was exploited increasing the “concentration” of anatase particles, while keeping the heating rate as high as possible.
We believe that the control of a mild thermal treat-ment of commercial P25 will allow to reduce dispersity and aggregation of rutile particles with nanometre size.
II. Experimental procedure
All phase transformation experiments were carried out under normal pressure (1 atm) in a Nannetti Klin FCN 16 furnace controlled using an Ero-Electronic PKP controller. Three samples (#1, #2, #3) used in the kinetic experiments were based on∼20 g TiO2 (Degussa P25)
powders. For the fourth sample (#4), 4 g of TiO2 (De-gussa P25) powder was subjected to cold linear press-ing at 70 MPa to produce 30 mm diameter, 3 mm thick disk. Isostatic pressing at 300 MPa was applied to the disk to obtain green homogeneous TiO2 body. All the samples were fired by setting the heat treatment cycles reported in Table 1. From one cycle to the following one the samples were cooled down to room temperature by free cooling of the furnace. In Table 1, the cooling times (tc) which passed from the calcination temperature to
605 °C, which is the equilibrium temperature at atmo-spheric pressure reported by Dachilleet al.[28], are
re-ported. The crystallite’s growth and relative phase con-tents for anatase and rutile were quantitatively evaluated by Powder X-Ray Diffraction (PXRD) analysis by using
Bruker D8 Advanced X-ray diffractometer (θ–θ) with
a LYNXEYE detector. PXRD patterns were recorded with Cu Kαradiation in the range 0°≤2θ≤60° which
includes most of the main anatase and rutile diffraction
Table 1. Heating treatments performed on samples of Degussa P25 powder
Sample Step,i Heating rate,[°C q Calcination Permanence time,t Cooling time,tc
/h] temperature,T [°C] [h] [min]
#1
1 100 620 0.5 1
2 100 640 1 3
3 100 640 5 3
4 100 620 50 1
5 100 700 1 7
#2 12 200100 680700 11 57
#3 1 300 700 1 7
#4 1 300 700 1 7
III. Results
Figure 1 shows the PXRD patterns of P25 samples. All peaks belong to the anatase and rutile phases and no other phase is detected within the X-ray detection limit. The average crystallite sizes (DAfor anatase and
DR for rutile) were calculated by Scherrer’s formula,
D = kλ/βcosθ, based on the precise 2θpositions and
full width at half maxima (β) of the diffraction peaks
with background-subtracted and Lorentzian correction of 0.037° onβdue to the instrumental peak broadening.
The values ofβandθare taken for anatase crystal planes
(101) and rutile one (110). The shape factor (k) and the
X-ray wavelength (λ) were fixed at 0.9 and 0.15418 nm,
respectively. Following this formula, the XRD calcula-tion does not give the true average crystal size but an apparent one, which, anyway, depends on the first.
The phase composition is calculated by the Spurr and Meyer’s equation formula [39]:
WR=
AR
A0
= AR
0.884AA+AR
(1)
whereWRis the rutile weight fraction,AAandARare
in-tegrated diffraction peak intensities (after
background-subtraction) of the strongest peaks of anatase (101) and rutile (110) fitted by Pearson VII curves, respectively, andA0 is the total integrated 101 and 110 peaks inten-sity. It has been supposed that the possible amount of amorphous phase [26,40], about 9% [41], corresponds to anatase particles with crystallites smaller than 30 Å. The measured particle sizes and percentage amount of calculated phases for each heat treatment step are shown in Table 2. The commercial powder TiO2(Degussa P25) that has an average size of about 30 nm, was also charac-terized as supplied for comparison, and used as standard for initial composition.
IV. Discussion
The measured average crystallite sizes and the per-centage amount of detected phases for each heat treat-ment (data reported in Table 2) were processed in or-der to evaluate the role of heating rate and the thermal history. For this purpose in Fig. 2 the cumulative
Table 2. The measured particle sizes and percentage amount of calculated phases
Sample Step,i [wt.WR DR DA Slope /wt.] [nm] [nm] [10-3nm-1]
P25 0 0.15 36 24
-#1
1 0.22 42 26 11±1
2 0.35 53 29 11±2
3 0.63 71 32 13±2
4 0.82 87 37 11±2
5 0.91 94 41 11±2
#2 12 0.540.88 6189 3038 1716±1
±2
#3 1 0.86 75 35 18±1
#4 1 1 >100 -
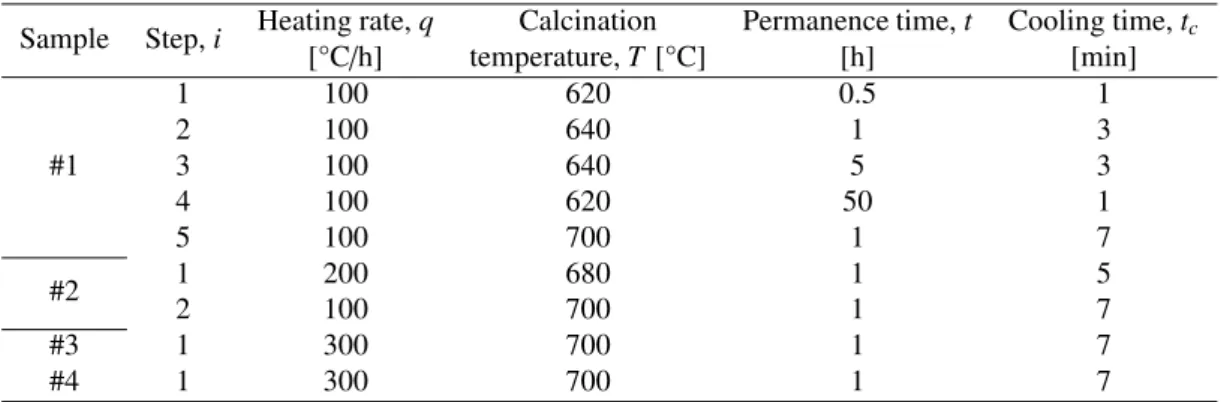
-Figure 2. Plot showing the correlation between transformation rate and coarsening rate of anatase and
rutile for each step of kinetic experiments run at the condition reported in Table 1
formation rate, ˙α, and the cumulative coarsening rate, ˙d,
were approximated and plotted, respectively, as follows:
˙
α=
n X
i=0
WA/Ri+1−WA/Ri
/ti+1 (2)
˙
d= n X
i=0
DA/Ri+1−DA/Ri
/ti+1 (3)
wheretiis the overall time of the stepicalculated as the
sum of the time spent to reach the calcination temper-ature from 465 °C [31], plus the soaking time, plus the time of free cooling (tc) down to 605 °C [28].
From the plot (Fig. 2) it can be seen that the slope of anatase curves is always higher than rutile one and this is coherent with the coarsening mechanism. Anatase coarsening rate is always lower than rutile’s one. This means that adjacent anatase crystallites tend to trans-form to rutile rather than to coarsen, so even if the anatase crystallite sizes increase during the treatment, this phenomenon is hidden or decremented by the trans-formation to rutile which consumes the anatase par-ticles. This was shown by Gribb and Banfield [29] who found partially reacted anatase particles. So, both anatase and rutile particle sizes increase with the
in-crease in temperature, but the growth rate is different.
The rutile has much higher growth rate than anatase. The curves, plotted in Fig. 2, confirm also the effect
of the starting crystallite size and the “concentration” of anatase particles on the kinetics of the anatase-to-rutile phase transformation. Considering the last step of the curves #1 and #2 – the same heating rate (Ta-ble 1), with different initialDAi andWAi (Table 2) – the
slope (WRi+1 −WRi)/(DRi+1 −DRi) increases from about
0.011 nm-1 to 0.016 nm-1, respectively. Nevertheless, it is not possible to distinguish the specific contributions
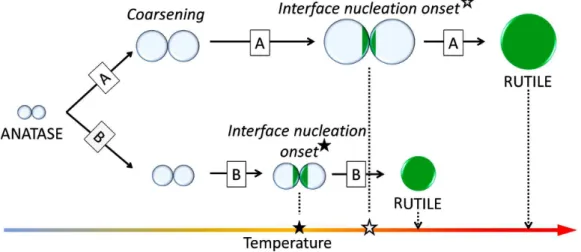
Figure 4. Diagram showing steps involved in the phase transformation of nanocrystalline anatase particles over lower heating rate (A) and over higher heating rate (B)
of DAi and WAi. From the data reported in Table 2 it
seems there is a close correlation between DA/R and
WA/R which is not strongly influenced by the thermal
history. In fact, a linear correlation between them (with a quite highR2 =0.95 and 0.94 for the anatase and
ru-tile, respectively) was found (Fig. 3). According to the model proposed by Zhang and Bandfield [32] the ki-netic of anatase to rutile transformation is a function of the numeric fraction of anatase particles and thus it is directly proportional toWA and inversely proportional
to (DA/2)3. So, in order to boost the kinetics of
transfor-mation of a given anatase and rutile nanopowder mix-ture, it is fundamental to supply enough thermal energy to the system in short time. This suppresses the coars-ening of adjacent anatase particles [42] and their stabi-lization at higher temperatures. In fact, the highest slope of 0.019 nm-1 was achieved at the highest heating rate starting from the powders characterized by the highest value of WA and the lowest DA. The above discussed
heating rate role in the anatase to rutile transformation is summarized as graphical kinetic model in Fig. 4.
The coarsening mechanism was also confirmed and exploited by pressing the starting powder into a disk in order to increase the anatase-anatase contact-points. In this way the anatase to rutile mechanism was signifi-cantly improved achieving the full transformation to ru-tile.
According to the linear correlation between DR and
WR(WR=0.014DR−0.33) and the results achieved by
increasing the heating rate and anatase-anatase contact-points, it should not be possible to get 100% of rutile powders characterized by aDRsmaller than 97±14 nm.
V. Conclusions
The influence of heating rate and thermal history on the anatase to rutile transformation and crystallite size of commercial TiO2 (Degussa P25) powder was stud-ied. The enhanced anatase to rutile transformation, as a consequence of the increase of the heating rate, re-sults into the highest ratio of rutile weight percentage
(86 wt.%) to its crystallite size (75 nm). At the same heat treatment, the full transformation was achieved by increasing the anatase-anatase contact-points. A theo-retical lower threshold on the rutile crystallite size was found. It is not possible to get 100% of rutile particles with average crystallite size lower than 83 nm by firing TiO2Degussa P25 powders.
Acknowledgements:The authors thank A. Piancastelli
(CNR-ISTEC) for the XRD spectra. Financial support from the “Progetto Premiale - Tecnologie e Sistemi In-novativi per la Fabbrica del Futuro e Made in Italy” project funded by MIUR (Italian Ministry of Education, University and Research) is gratefully acknowledged.
References
1. A. Thilagam, D.J. Simpson, A.R. Gerson, “A first-principles study of the dielectric properties of TiO2 polymorphs”, J. Phys. Condens. Matter,23 (2011)
1–13.
2. S. Marinel, D.H. Choi, R. Heuguent, D. Agrawal, M. Lanagan, “Broadband dielectric characterization of TiO2ceramics sintered through microwave and con-ventional processes”, Ceram. Int., 39 (2013) 299–
306.
3. L.D. Zhang, H.F. Zhang, G.Z. Wang, C.M. Mo, Y. Zhang, “Dielectric behaviour of nano-TiO2 bulks”,
Phys. Stat. Sol.,157(1996) 483–491.
4. B. Jaffe, W.R. Cook, H. Jaffe,Piezoelectric ceram-ics, Chapter 1, Academic Press, London and New
York, 1971.
5. X.-S. Ye, Z.-G. Xiao, D.-S. Lin, S.-Y. Huang, Y.-H. Man, “Experimental investigation on the dielec-tric behavior of nanostructured rutile-phase titania”,
Mater. Sci. Eng. B,74(2000) 133–136.
6. H. Gleiter, “Nanocrystalline materials”,Prog. Mater. Sci.,33(1989) 223–315.
1131–1148.
8. A. Wypych, I. Bobowska, M. Tracz, A. Opasin-ska, S. Kadlubowski, A. Krzywania-KaliszewOpasin-ska, J. Grobelny, P. Wojciechowski, “Dielectric properties and characterisation of titanium dioxide obtained by different chemistry methods”, J. Nanomater., 2014
(2014) 1–9.
9. L.-X. Pang, H. Wang, D. Zhou, X. Yao, “Low-temperature sintering and microwave dielectric prop-erties of TiO2-based LTCC materials”,J. Mater. Sci.,
21(2010) 1285–1292.
10. M. Crippa, A. Bianchi, D. Cristofori, M. D’Arienzo, F. Merletti, F. Morazzoni, R. Scotti, R. Simonutti, “High dielectric constant rutile-polystyrene compos-ite with enhanced percolative threshold”, J. Mater. Chem. C,1(2013) 484–492.
11. X. Huang, Z. Pu, L. Tong, Z. Wang, X. Liu, “Prepa-ration and dielectric properties of surface modified TiO2/PEN composite films with high thermal
stabil-ity and flexibilstabil-ity”,J. Mater. Sci.,23(2012) 2089–
2097.
12. R.P. Ortiz, A. Facchetti, T.J. Marks, “High-k organic, inorganic, and hybrid dielectrics for low-voltage or-ganic fieldeffect transistors”,Chem. Rev.,110(2010)
205–239.
13. A. Hagfeldt, M. Gratzel, “Molecular photovoltaics”,
Acc. Chem. Res.,33(2000) 269–277.
14. N. Serpone, “A decade of heterogeneous photocatal-ysis in our laboratory: pure and applied studies in en-ergy production and environmental detoxification”,
Res. Chem. Intermed.,20(1994) 953–992.
15. M.A. Fox, M.T. Dulay, “Heterogeneous photocatal-ysis”,Chem. Rev.,93(1993) 341–357.
16. R.G. Aditi, B.F. Julio, “Methylation of phenol over Degussa P25 TiO2”, J. Mol. Catal. A: Chem., 226
(2005) 171–177.
17. W. Chiron, A. Fernandes-Alba, A. Rodriguez, E. Garcia-Calvo, “Pesticide chemical oxidation: state-of-the-art”,Water Res.,34(2000) 366–377.
18. M.A. Anderson, “Applications in photocatalytic pu-rification of air”,Stud. Surf. Sci. Catal.,103(1997)
445–461.
19. M. Schmidt , E. Weitz, F. M. Geiger, “Interaction of the indoor air pollutant acetone with Degussa P25 TiO2studied by chemical ionization mass spectrom-etry”,Langmuir,22(2006) 9642–9650.
20. D. Gumy, C. Morais, P. Bowen, C. Pulgarin, S. Gi-raldo, R. Hajdu, J. Kiwi, “Catalytic activity of com-mercial of TiO2 powders for the abatement of the bacteria (E. coli) under solar simulated light: Influ-ence of the isoelectric point”,Appl. Catal. B: Envi-ron.,63(2006) 76–84.
21. T. Luttrell, S. Halpegamage, J. Tao, A. Kramer, E. Sutter, M. Batzill, “Why is anatase a better photocat-alyst than rutile? - Model studies on epitaxial TiO2 films”,Sci. Rep.,4(2014) 1–8.
22. S. Farrokhpay, “A review of polymeric dispersant stabilisation of titania pigment”,Adv. Colloid
Inter-face Sci.,151(2009) 24–32.
23. F.A. Grant, “Properties of rutile (titanium dioxide)”,
Rev. Mod. Phys.,31(1959) 646–674.
24. G. Liu, Z. Chen, C. Dong, Y. Zhao, F. Li, G. Q. Lu, H.-M. Cheng, “Visible light photocatalyst: iodine-doped mesoporous titania with a bicrystalline frame-work”,J. Phys. Chem. B,110(2006) 20823–20828.
25. E.K. Rajashekhar, G.L. Devi, “Polymorphic phase transformation of Degussa P25 TiO2 by the chela-tion of diaminopyridine on TiO6 ratio on the photo-catalytic activity”,J. Mol. Catal. A,374-375(2013)
12–21.
26. B. Ohtani, O.O. Prieto-Mahaney, D. Li, R. Abe, “What is Degussa (Evonik) P25? Crystalline com-position analysis, reconstruction from isolated pure particles and photocatalytic activity test”, J. Pho-tochem. Photobiol. A,216(2010) 179–182.
27. T. Ohno, K. Sarukawa, K. Tokieda, M. Matsumura, “Morphology of a TiO2 photocatalyst (Degussa, P-25) consisting of anatase and rutile crystalline phases”,J. Catal.,203(2001) 82–86.
28. F. Dachille, P.Y. Simons, R. Roy, “Pressure-temperature studies of anatase, brookite, rutile and TiO2-II”,Am. Mineral.,53(1968) 1929–1939.
29. A.A. Gribb, J.F. Banfield, “Particle size effects
on transformation kinetics and phase stability in nanocrystalline TiO2”,Am. Mineral.,82(1997) 717–
728.
30. H. Zhang, J.F. Banfield, “Thermodinamic analysis of phase stability of nanocrystalline titania”, J. Mater. Chem.,8(1998) 2073–2076.
31. B. Gilbert, H. Zhang, F. Huang, M.P. Finnegan, G.A. Waychunas, J.F. Bamfield, “Special phase transfor-mation and crystal growth pathways observed in nanoparticles”,Geochem. Trans.,4(2003) 20–27.
32. H. Zhang, J.F. Banfield, “New kinetic model for the nanocrystalline anatase-to-rutile transformation re-vealing rate dependence on number of particles”,
Am. Mineral.,84(1999) 528–535.
33. H. Zhang, J.F. Banfield, “Understanding polymor-phic phase transformation behaviour during growth of nanocrystalline aggregates: insights from TiO2”,
J. Phys. Chem. B,104(2000) 3481–3487.
34. K.P. Kumar, “Growth of rutile crystallites during the initial stage of anatase-to-rutile transformation in pure titania and in titania-alumina nanocomposites”,
Scr. Mater.,32(1995) 873–877.
35. A. Navrotsky, O.J. Kleppa, “Enthalpy of the anatase-rutile transformation”,J. Am. Ceram. Soc.,50(1967)
626–630.
36. W. Li, C. Ni, H. Lin, C.P. Huang, S. Ismat Shah, “Size dependence of thermal stability of TiO2 nanoparticles”,J. Appl. Phys.,96(2004) 6663–6668.
37. P. Galizia, C. Baldisserri, C. Galassi, “Microstruc-ture development in novel titania-cobalt ferrite ce-ramic materials”,Ceram. Int.,42(2016) 2634–2641.
CoFe2O4/TiO2 composite and niobium-doped PZT
obtained by electrophoretic deposition”,J. Eur. Ce-ram. Soc.,36(2016) 373–380.
39. R.A. Spurr, H. Myers, “Quantitative analysis of anatase-rutile mixtures with an X-ray diff
ractome-ter”,Anal. Chem.,29(1957) 760–762.
40. A.K. Datye, G. Riegel, J.R. Bolton, M. Huang, M.R. Prairie, “Microstructural characterization of a fumed titanium dioxide photocatalyst”,J. Solid State
Chem.,115(1995) 236–239.
41. H. Jensen, K.D. Joensen, J.-E. Jorgensen, J.S. Ped-ersen, E.G. Sogaard, “Characterization of nanosized partly crystalline photocatalysts”,J. Nanopart. Res.,
6(2004) 519–526.