Ammonia volatilization losses in Tanzania grass fertilized with urea
Perdas de amônia por volatilização em capim-Tanzânia adubada com ureia
SOARES FILHO, Cecílio Viega1*; CECATO, Ulysses2; RIBEIRO, Ossival Lolato3; ROMA, Cláudio Fabrício da Cruz4; BELONI, Tatiane4
1
Universidade Estadual Paulista Júlio de Mesquita Filho, Faculdade de Medicina Veterinária, Departamento de Apoio, Produção e Saúde Animal, Araçatuba, São Paulo, Brasil.
2Universidade Estadual de Maringá, Departamento de Zootecnia, Maringá, Paraná, Brasil.
3Universidade Federal da Bahia, Escola de Medicina Veterinária e Zootecnia, Departamento de Zootecnia,
Salvador, Bahia, Brasil.
4Universidade Estadual de Maringá, Maringá, Paraná, Brasil.
*Endereço para correspondência: cecilio@fmva.unesp.br
SUMMARY
Gaseous losses are the main factors affecting the efficiency of nitrogenous fertilizers in pastures. To evaluate NH3-N volatilization losses in
Tanzania grass fertilized with urea in autumn, spring and summer, a completely randomized design with repeated measurements over time and fifteen replicates was used. Plots were represented by urea levels (50; 100 and 150 kg ha-1 N) and subplots by time after fertilization (1; 2; 3; 6; 9; 12 and 15 days). The interaction between fertilization leveland time after urea application was significant for the accumulated NH3-N volatilization. Urea application leads to
higher percentage N losses in the first three days after application. The average cumulative NH3
-N loss for the three occasions (different seasons of the year) was 28%, 20% and 16% of N applied for fertilizer doses of 50; 100 and 150 kg ha-1 of N, respectively. The season of the year influenced NH3-N loss pattern and volume, with
the lowest values recorded in spring, followed by summer and autumn. The cumulative NH3-N
volatilization loss varies from 78 to 90% up to the third day after application of the total N-NH3 loss.
Keywords: Panicum maximum, nitrogen fertilizer,
pasture
RESUMO
As perdas gasosas são os principais fatores de ineficiência do uso de fertilizantes nitrogenados nas pastagens. Com o objetivo de estimar a perda N-NH3 por volatilização foi realizado um
experimento com capim Tanzânia adubada com ureia nas estações de outono, primavera e verão. Adotou-se um delineamento experimental inteiramente casualizado, com medidas repetidas no tempo com quinze repetições. Nas parcelas, as doses de N-ureia (50, 100 e 150 kg ha-1 de N-ureia) e, nas subparcelas, o período depois da adubação nitrogenada (1, 2, 3, 6, 9, 12 e 15 dias). A interação entre o nível de adubação e o período depois da aplicação de ureia foi significativa para a variável volatilização acumulada de N-NH3. A aplicação da ureia
acarreta perdas percentuais mais elevadas de N nos três primeiros dias após a aplicação. A perda média acumulada de N-NH3 no período para as
três estações do ano representou 28%, 20% e 16% do N aplicado nas adubações com 50, 100 e 150 kg ha-1 de N-ureia, respectivamente. A estação do ano influenciou no padrão e na quantidade das perdas, com menores valores encontrados na primavera, seguidos do verão e outono. A perda acumulada de N-NH3 por
volatilização variou de 78 a 90% até o terceiro dia após aplicação do total perdido.
Palavras-chave: Panicum maximum,
INTRODUCTION
Nitrogen fertilization has been widely used on grass pastures to increase pasture growth and animal production. Urea is a very popular fertilizer due to its high N content, easy handling and moderate acidifying effect.
However, nitrogen losses from applying urea as N source can be considerable. Applying urea to the soil in the presence of water and urease leads to hydrolytic generation of ammonia (NH3), carbon dioxide (CO2) and water (SENGIK & KIEHL, 1995).
Ammonia may be lost or retained by the system depending on environmental conditions. Under unsuitable conditions for ammonia retention by the soil, volatilization may cause large losses. In pastures where large quantities of urea are applied directly to the soil surface, a decrease in the cation exchange capacity and increasein ammonia saturation (KIEHL, 1989) are observed, favoring N losses due to volatilization.
Therefore, in economic terms, urea can be considered a potentially high-quality fertilizer due to its high N content, easy handling and moderate acidifying effect. This justifies further efficiency investigation particularly regarding intensive exploitation pastures.
The volatilization process has received great attention in recent years due to its contribution to the deterioration of air quality and economic losses caused by the low efficiency of applied fertilizers (PRIMAVESI et al., 2004), being de-fined as the transfer of gaseous ammo-nia from soil to the atmosphere, requir-ing the presence of ammonia close to the soil surface, where ammonium ion (NH4+), precursor of ammonia, is con-stantly formed in the soil by mineraliza-tion of organic matter by the decompo-sition of animal and plant waste and by
the hydrolysis of amide and ammonium fertilizers.
This work aimed to quantify NH3-N
volatilization losses in Tanzania grass pastures fertilized with urea in spring, summer and fall.
MATERIAL AND METHODS
The experiment was carried out in a
Panicum maximum cv. Tanzania pasture
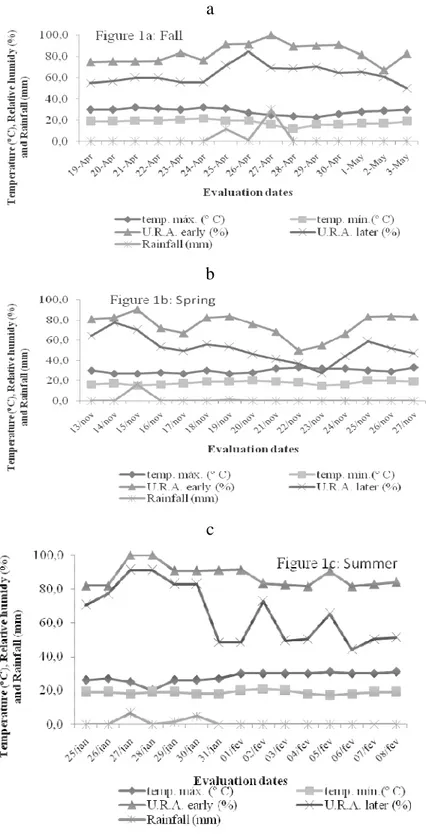
on an experimental area belonging tothe Iguatemi Experimental Farm, Maringá State University, Maringá, state of Paraná, Brazil, (23º25’S; 51º57’W and 550m a.s.l.). According to Corrêa (1996) and the Köppen classification, the local climate is Cfa subtropical humid mesothermal with hot summers, and summer-dominant rainfall. Weather data for the experimental period were collected at a meteorological station and are shown in Figure 1.
The soil type at the experimental area is dystrophic red latosoil (Santos et al., 2006) with the following chemical characteristics: pH CaCl2: 4.8; P
(ion-exchange resin extraction method) = 9.0 mg dm-3; organic carbon = 12.7g dm-3; Ca=1.0cmolcdm-3; Mg = 0.7cmolcdm-3;
K = 0.09cmolcdm-3; cation exchange
capacity = 4.8cmolcdm-3 and base
saturation = 38.6%. At the beginning of the experimental period, the soil was corrected with 40kgha-1 of P2O5 as simple
superphosphate (18% of P2O5). Acidity
correction was performed with dolomitic limestone in order to increase base saturation to 60% according to Werner et al. (1996). Nitrogen (as urea, 46% N) was applied in fall (April 18, 2007), spring (November 12, 2007) and summer (January 24, 2008) by sprinkling over the plots early in the morning on the day after all animals were removed from the fenced area. Together with the first N application, 60kgha-1 K2O were applied
a
b
c
The pattern and extent of N-NH3 volatilization were evaluated in non-cultivated parcels with collectors randomly distributed over a 100m² area. The non-cultivated areas were the soil surface not occupied by the basal area of clumps. At the beginning of the experiment, on the day following removal of animals from the area, the height of the post-grazing residue was about 30cm.
The experimental design was fully randomized with measurements repeated over time with 15 replicates. The plots were the urea doses (50; 100 and 150kg ha-1 of N) and subplots were time after nitrogen fertilization (1; 2; 3; 6; 9; 12 and 15 days). Control treatment (zerokgha-1 of N) was considered a bank (i.e., N-NH3 losses occurring without the influence of nitrogen fertilization) and used to correct N-NH3 losses in fertilizations with 50, 100 and 150kgha-1 of N. The application of treatment was analyzed from material collected in fall (April 19 to May 3, 2007), spring (November 13 to November 27, 2007) and summer (January 25 to February 8, 2008).
Semi-open static collectors were made of 2L PET transparent plastic bottles (0.35 m high, 0.10 m diameter) according to Marsolla and Miyazawa (1999), which were kept at 0.05 m from the soil surface by a wooden stake so that air could circulate inside simulated naturalfield conditions. Three collectors hung from each wooden stake making 15 collectors (replicates) were used per treatment. A paper filter ribbon 0.025 m wide and 0.25 m long was fixedinside the collector with a stainless steel wire. The ribbon was kept in contact with a collecting pad soaked in0.05 mol/LH2SO4+ 2% (v/v) glycerol
collection solution in a 15 ml graduated tube for N-NH3 absorption. Paper filter ribbons and the sulphuric acid solution were replaced for each new sampling according to procedures previously
described. Samples were kept in plastic bags with clear content identification and stored under refrigeration until analysis.
Aggregate ammonia losses due to volatilization (given in % and kgha-1 of N) were computed from measurements performed on days 1, 1+2, 1+2+3, 1+2+3+6, 1+2+3+6+9, 1+2+3+6+9+12 and 1+2+3+6+9+12+15.
Data were tested for error normality and variance homogeneity. Statistical analysis was carried out with the help of the SAS statistical package (STATISTICAL ANALYSIS SYSTEM, 1999) version 8.2 for Windows. The GLM procedure was used for the split-subplot model, and N doses were considered as the main treatment and the collection period as the subplot. A separate analysis was performed for each season in the study (fall, spring and summer). The means were compared by the F-test and SNK means testedat 5% significance level. Regression analyses were carried out as a function of N doseand multiple regression model adjustment (response surface) as a function of N doseand days after N application.
RESULTS AND DISCUSSION
Absolute NH3-N volatilization losses
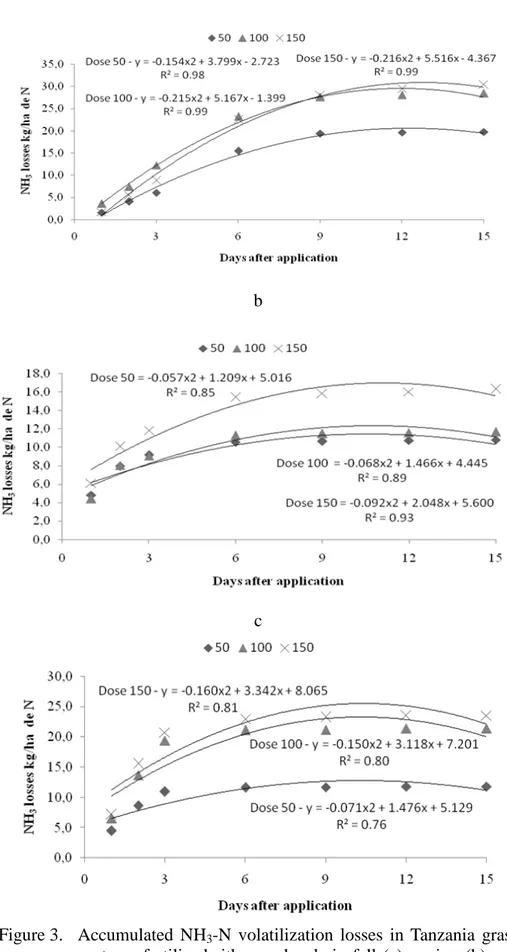
during fall 2007 were significant for the urea application rate, number of days after application and interaction between urea dose and number of days after application (Figure 3a). NH3-N
N fertilization, losses were higher as a consequence of the greater volume of N on the pasture soil and also to the weather conditions (MARTHA JUNIOR et al., 2004). As observed in Figure 2a, 78% of the total aggregate loss computed for the entire experimental period was lost up to the 6th day after
application. The high temperatures on the first three days resulted in 12.8mm rainfall three days before and 11.8mm rainfall on the 7th day after urea application (Figure 1). This must have contributed to the greater N-NH3 loss observed in that period.
a
b
c
Figure 2. Accumulated NH3-N volatilization losses in Tanzania
These results corroborate those of Martha Junior et al. (2004) who studied Tanzania grass fertilized with N-urea and found on the third day, aggregate losses from 78 to 92% of the total N-NH3 loss. Cantarela et al. (2008) found NH3-N volatilization losses as ammonia
from urea treatments ranging from 1% (rainy days after fertilization) to 25% of the N applied in sugarcane. Lara & Trivelin (1990) found similar results, where the first six days accounted for nearly 95% of the total N-NH3 volume absorbed by the collector. Since the water volume was not enough to cause fertilizer infiltration into the soilprofile, ammonia must have remained concentrated on its surface, increasing the probability of loss.
In the present study, losses were similar to those found in literature. However, the pasture was covered with a significant volume of litter, which must have contributed for the retention of humidity on the soil surface soon after urea application on spaces among Tanzania grass shrubs. In turn, such humidity retention may have caused urease enzyme synthetization by soil microorganisms, which intensified urea hydrolysis and favored volatilization losses. Studies have shown that N-based fertilizers should be applied in a volume 30% larger when sowing directly over grass in order to compensate nitrogen retention by the grass above the ground. From the 9th to the 15th day, the mean aggregate N-NH3 loss decreased as a fraction of the total loss with respect to the amount of fertilizer applied to the soil, indicating that N transfer from the fertilizer to the lower soil layers favored the ion-root contact with a better use of the fertilizer by the plant or N immobilization by microorganisms, as well as adsorption of N-NH4+ forms
potentially convertible into NH3in the negative charges of soil particles, with a
negative effect on the volatilization process (HARGROVE et al., 1988). According to Figure 3a, aggregate N-NH3 losses increased with increasing N doses, respectively 20, 28 and 30kgha-1 of N for 50, 100 and 150kg ha-1 doses of N. The higher the N-urea dose, the higher the aggregate volatilization (kg ha-1 of N). However, the loss percentage in relation to the total N per applied dose was 39%, 28% and 20% respectively for 50, 100 and 150kg ha-1 doses of N, demonstrating that the percentage ammonia loss decreased over time during the experimental period. Similarly, the higher the N doses, the higher the loss. However, the percentage of treatments that received higher N doses showed the lowest losses with respect to the total application. These results show that with high temperatures and low rainfall, losses may vary less among N applications. These results must be associated to the short experimental period and low rainfall following the implementation of collectors and adverse weather to urea-nitrogen fertilization and to the effects of temperature as high as 28.5°C (Figure 1). Primavesi et al. (2001) worked with urea in acid soils and observed the NH3-N
volatilization losses in pastures ranging from 10% to 25% of the N applied during the growth stage.
The best adjustment of the multiple regression for fall was the quadratic form (Figure 4a). It was observed that N losses were higher in six days after application, which is in agreement with results found by Lara & Trivelin (1990) and by Martha Junior et al. (2004) and Cantarella et al. (2008).
a
b
c
Figure 3. Accumulated NH3-N volatilization losses in Tanzania grass
a
Y = -2.76 + 1.38 days + 0.074 doses N – 0.093 days2 – 0.0013 doses N x days – 0.00025 doses N2R2 =0.52
b
Y = 1.43 – 0.446 days + 0.042 doses N + 0.024 days2 – 0.0021 doses N x days – 0.000087 doses N2 R2 = 0.74
c
Y = 1.43 – 0.446 days + 0.042 doses N + 0.024 days2 – 0.0021 doses N x days – 0.000087 doses N2R2 =0.74
Figure 4. Tridimensional response surface for fall (a), spring (b) and summer (c) for days after application as a function of N doses in Tanzania grass pastures
0 50
100 150
Doses of N
0 5
10 15
Days after application
PRED
-1.15 2.39 5.93 9.47
0 50
100 150
Doses of N
0 5
10 15
Days after application
PRED
-0.61 1.50 3.62 5.74
0 50
100 150
Doses of N
0 5
10 15
Days after application
PRED
NH3-N volatilization losses in
spring/2007 were significant for the N-urea dose, for the number of days after application and for the interaction between N-urea dose and number of days after application (Figure 3b). NH3-N volatilization losses were
significantly higher for the 150kgha-1 N dose. However, the daily NH3-N
volatilization losses observed demonstrate that the highest loss occurred on the first day, followed by losses on the 2nd, 3rd and 6th day after application of N (Figure 2 b and 3b). These results demonstrate that on the first days of N fertilization, losses are higher due to the greater volume of N on the pasture soil but mainly to the weather conditions (MARTHA JUNIOR et al., 2004; CANTARELLA et al., 2008).
Figure 2b shows that 78% of the total NH3-N volatilization losses during the
experimental period occurred up to the third day after application. On the first three days, the temperature was very high and rainfall of 16.2 mm occurred on the third day after urea application (Figure 2). This must have contributed to the higher N-NH3 loss in that period. These results corroborate those by Martha Junior et al. (2004), who studied urea-fertilized Tanzania grass and found third day aggregate losses from 78 to
92% of the total N-NH3 losses. From the sixth to the 15th day, the mean N-NH3 aggregate losses from the N doses decreased as a fraction of the total loss with respect to the amountof fertilizer applied to the soil, indicating that N moved from the fertilizer to deeper soil layers.
N-NH3 aggregate losses increased exponentially with the N-dose applied: 11; 12 and 16 kgha-1 of N for doses of 50, 100 and 150kg ha-1 of N, respectively, as shown in Figure 3b. However, the loss percentage with respect to the total N per applied dose
was 21%, 12% and 11% for doses of 50, 100 and 150kg ha-1 of N, respectively. Due to the similarity of weather conditions, springtime showed the same ammonia loss pattern as previously discussed for the fall collection. Martha Junior et al. (2004) working with N-fertilized Tanzania grass observed aggregate N-NH3 losses of 48%, 41% and 42% of the N application for doses of 40, 80 and 120kg ha-1 of N-urea, respectively.
Primavesi et al. (2006) verified that doses of up to 500kg ha-1 of N, in five installments, as urea or ammonia nitrate, did not cause significant nitrate loss to the water table. The results indicate that there is no risk of water table contamination in deep soils of average texture occupied by intensively managed tropical grasses when nitrogen fertilization higher than the forage cycling capacity are not used and when the soil supply potential is taken into account.
The best adjustment of the multiple regressions for spring was the quadratic form (Figure 4b). It is observed that N losses were higher in the three first days after application in agreement with Lara & Trivelin (1990), Martha Júnior et al. (2004) and Cantarella et al. (2008). Also, it was observed that in the springtime, losses occurred until the sixth day after application, being then stabilized.
N-NH3volatilization losses for summer/2008 were significant for the N-urea dose, for the number of days after application, and for the interaction between N-urea dose and number of days after application (Figure 3c). Daily N-NH3volatilization losses demonstrate that the highest losses occurred on the first and second days, followed by the 3rd and 6th days after N application (Figure 2c). According to Cantarella et al. (1999) and Cantarella et al. (2008), losses are higher on the first days of N fertilization due to the greater volume of nitrogen on the pasture soil but mainly to the weather conditions. Figure 2c shows that 90% of N-NH3 aggregate volatilization losses for the entire experimental period occurred up to de 3rd day after application. The high temperature in the three first days of the experimental period caused a rainfall of 6.6 mm on the third day after urea application (Figure 3), which may have led
to higher N-NH3 loss in that period. These results corroborate those of previous authors. From the sixth to the 15th days, the mean N dose as N-NH3 aggregate losses decreased as a fraction of the total loss with respect to the amount of fertilizer applied to the soil, indicating that N moved from the fertilizerto deeper soil layers, improving the likelihood of ion-root contact and better use of the fertilizer by the plant. N-NH3 aggregate losses increased with the N dose applied: 12, 21 and 24kg·ha
-1
of N for doses of 50, 100 and 150kg·ha-1 of N, respectively, as shown in Figure 3c. However, the loss percentage with respect to the total N per applied dose was 23%, 21% and 16% for doses of 50, 100 and 150kg·ha
-1
of N, respectively. Similarly, the higher the N dose, the higher the loss. However, the percentage of treatments that received higher N doges showed the lowest losses with respect to the
total application. These results indicate that in the three seasons evaluated, ammonia aggregate losses showed the same behavior pattern. Weather conditions at the time of fertilizer application and during the evaluation period, mainly temperature and precipitation may have reflected on the pattern and extent of volatilization losses (WHITEHEAD, 1995).
Evaluating the process of N-urea fertilization efficiency in Brachiaria
brizantha-grass associated with application of potassium chloride and simple superphosphate, Oliveira et al. (2003) found that the recovery of N from N-urea fertilization by the plant crown and the root system was correlated to the dry mass of plant shoots, leading to different forage dry matter yields in plant shoots.
The best adjustment of the multiple regressions for summer was the quadratic form (Figure 4a). It is observed that N losses were larger in the three first days after application in agreement with Lara & Trivelin (1990), Martha Junior et al., (2004) and Cantarella et al. (2008). The canonical analysis of the response surface yielded as stationary point the saddle point with coordinates of 12.33 days after application and 77kg ha-1 of N dose. The value at the stationary point was 0.25 (ammonia loss in kg ha-1). Martha Junior et al. (2004) evaluated the effect of N doses and reported that for fertilizeramount greater than 80 kg ha-1 of N, denitrification losses were considerably significant. These authors observed that the combination of high soil humidity, absence of rain on the first day after fertilization and high temperature caused a low agronomic efficiency for N-urea applied on Tanzania grass pasture.
application of higher N doses led to the highest aggregate loss. The season of the year influenced the N loss pattern and volume, and the smallest values were found in springtime, followed by summer and fall.The cumulative N-NH3
volatilization loss ranged from 78 to 90% up to the third day after application of the total loss.
REFERENCES
CANTARELLA, H.; ROSSETO, R.; BARBOSA, W.; PENNA, M. J.;
RESENDE, L. C. L. Perdas de nitrogênio por volatilização da amônia e resposta da cana-de-açúcar à adubação nitrogenada, em sistema de colheita de cana sem queima prévia. In: CONGRESSO NACIONAL DA STAB, 7., 1999, Londrina. Anais... Londrina, 1999. p.82-87.
CANTARELLA, H.; TRIVELIN, P. C. O.; CONTIN, T. L. M.; DIAS, F. L. F.; ROSSETTO, R.; MARCELINO, R.; COIMBRA, R. B.; QUAGGIO, J. A. Ammonia volatilization from urease inhibitor-treated urea applied to sugarcane trash blankets. Scientia Agricola, v.65, n.4, p.397-401, 2008.
CORRÊA, A. R. Forrageiras: aptidão
climática do Estado do Paraná. In:
MONTEIRO, A.L.G., MORAES, A., CORRÊA, E.A.S. Forragicultura no
Paraná. Londrina: Comissão Paranaense
de Avaliação de Forrageiras, 1996. p.15-22.
HARGROVE, W. L. Soil environmental and management factors influencing ammonia volatilization under field conditions. In. BOCK, B. R.; KISSEL, D. E. (Eds.). Ammonia volatilization from
urea fertilizers. MuscleSchoals: Tenesse
Valley Autorithy, 1988. p.17-36. (Bulletin, Y-206).
KIEHL, J.C. Distribuição e retenção de amônia no solo após a aplicação de ureia. Revista Brasileira de Ciência do
Solo, v.13, p.75-80, 1989.
LARA, W.A.R.; TRIVELIN, P.C.O. Eficiência de um coletor semi-aberto estático na quantificação de N-NH3 volatilizado da ureia aplicada ao solo.
Revista Brasileira de Ciência do Solo,
v.14, p.345–352, 1990.
MARTHA JÚNIOR, G.B.; CORSI, M.; TRIVELIN, P.C.O.; VILELA, L.; PINTO, T.L.F.; TEIXEIRA, G.M.; MANZONI, C.S.; BARIONI, L.G. Perda de amônia por volatilização em pastagem de Capim-Tanzânia adubada com ureia no verão. Revista Brasileira
de Zootecnia, v.33, n.6, p.2240-2247,
2004.
MARSOLLA, T.; MYAZAWA, M. Determinação espectrofotométrica de amônia volatilizada do solo. In:
CONGRESSO LATINO AMERICANO DE LA CIÊNCIA DEL SUELO, 14., 1999, Temuco. Anais… Temuco, 1999. 374p.
PRIMAVESI, O.; CORRÊA, L. A.; PRIMAVESI A. C. Adubação com
ureia em pastagem de Cynodon
dactylon cv. Coastcross sob manejo
rotacionado: eficiências e perdas. São
Carlos: Embrapa Pecuária Sudeste, 2001. 42 p. (Circular Técnica, 30).
PRIMAVESI, A. C.; PRIMAVESI, O.; CÔRREA, L. A.; CANTARELLA, H.; SILVA, A.G .; FREITAS, A. R.; VIVALDI, L. J. Adubação nitrogenada em capim-Coastcross: efeitos na extração de nutrientes e recuperação aparente do nitrogênio. Revista
Brasileira de Zootecnia, v.33, n.1,
PRIMAVESI, O.; PRIMAVESI, A. C.; CORRÊA, L. A.; SILVA, A.G .; CANTARELLA, H. Lixiviação de nitrato em pastagem de coastcross adubada com nitrogênio. Revista
Brasileira de Zootecnia, v.35, n.3,
p.683-690, 2006.
OLIVEIRA, P. P. A.; TRIVELIN, P. C. O.; OLIVEIRA, W. S. Eficiência da fertilização nitrogenada com ureia (15N) em Brachiariabrizantha cv. Marandu associada ao parcelamento de
superfosfato simples e cloreto de
potássio. Revista Brasileira de Ciência
do Solo, v.27, n.4, p.613-620, 2003.
SANTOS, H. G.; JACOMINE, P. K.T.; ANJOS, L. H. C. (Eds.). Sistema
brasileiro de classificação de solos. 2.
ed. Rio de Janeiro: Embrapa Solos, 2006. p.306.
STATISTICALANALYSIS SYSTEM INSTITUTE. SAS/STAT Procedure
guide personal computers. 9. ed.Cary,
NC. Inst, 1999. 334p.
SENGIK, E.; KIEHL, J. C. Controle da volatilização de amônia em terra tratada com ureia e turfa pelo emprego de sais inorgânicos. Revista Brasileira de
Ciência do Solo, v.19, p.455-461, 1995.
WERNER, J. C.; PAULINO, V. T.; CANTARELLA, H.; ANDRADE, N.de O.; QUAGGIO, J. A. Forrageiras. In:
Recomendações de adubação e calagem para o Estado de São Paulo.
2 ed. Campinas: Instituto Agronômico e Fundação IAC, 1996. p.263-273. (Boletim técnico, 100).
WHITEHEAD, D. C. Grassland
nitrogen. Wallingford: CAB
International, 1990. 397p.