www.ccarevista.ufc.br ISSN 1806-6690
Agronomic performance of rice to the use of urease inhibitor in two
cropping systems
1Desempenho agronômico do arroz irrigado ao uso de inibidor de urease em dois
sistemas de cultivo
Enio Marchesan2*, Mara Grohs2, Melissa Walter3, Leandro Souza da Silva4 e Tiago Constante Formentini2
ABSTRACT -The use of urea coated with urease inhibitor may become a useful tool for increasing the efficiency of nitrogen top-dressing in rice crop, thereby reducing nutrient losses through volatilization of NH3(ammonia). Thus, the aim of this study was to evaluate the volatilization of NH3 and the response of rice to the use of urea coated with urease inhibitor in two cropping systems, no-tillage and conventional. For this purpose, field experiments were developed in the agricultural years 2007/2008 and 2008/2009, in UFSM in Santa Maria-RS. The design was randomized blocks in bifactorial scheme (2x5) with two sources, urea and urea + NBPT and five intervals of water intake (0; 3; 6; 9; 12 days) after application of nitrogen sources. The results of two seasons show that the urease inhibitor present in urea slows and decrease the conversion of N to NH3, reducing the losses by volatilization, compared to urea without inhibitor. Among the systems, the losses are magnified in the no-tillage cropping system. The behavior of the response variable in relation to productivity is variable in two cropping systems used in this study and the stress caused to the rice plant by the late start of the irrigation is more damaging than the losses caused by the volatilization of NH3.
Key words: Rice cultivation. Urease inhibitor. Use straw in agriculture.
RESUMO -A utilização de uréia recoberta com inibidor de urease pode tornar-se uma ferramenta útil para aumentar a eficiência da adubação nitrogenada em cobertura na cultura do arroz irrigado, diminuindo assim perdas do nutriente por volatilização de NH3(amônia). Com isso, o objetivo desse trabalho foi avaliar a volatilização de NH3 e a resposta do arroz irrigado ao uso de uréia recoberta com inibidor de urease em dois sistemas de cultivo, direto e convencional. Para tanto, conduziram-se experimentos em campo, nos anos agrícolas 2007/2008 e 2008/2009, na UFSM em Santa Maria-RS. O delineamento utilizado foi o delineamento experimental blocos completos casualizados em esquema bifatorial (2x5), com duas fontes, uréia e uréia+NBPT e cinco intervalos de início da irrigação (0; 3; 6; 9; 12 dias) após a aplicação das fontes de N. Os resultados das duas safras demonstram que o inibidor de urease presente na uréia retarda e diminui a conversão de N para NH3, reduzindo as perdas por volatilização, comparativamente à uréia sem inibidor. Entre os sistemas, as perdas são potencializadas no sistema plantio direto. O comportamento da variável resposta em relação à produtividade é variável nos dois sistemas de cultivo utilizados e o estresse causado na planta de arroz pelo atraso no início da irrigação é mais prejudicial do que as perdas causadas pela volatilização de NH3.
Palavras-chave:Cultivo de arroz. Inibidor de urease. Utilização de palha na agricultura.
*Autor para correspondência
1Recebido para publicação em 07/10/2011; aprovado 04/02/2013
Trabalho de Graduação realizado com financiamento de bolsa pela instituiçao FAPERGS
2Departamento de Fitotecnia, Centro de Ciência Rurais, Universidade Federal de Santa Maria, Santa Maria-RS, Brasil, emarchezan@terra.com.br,
maragrohs@yahoo.com.br, tiagoformentini@hotmail.com
3Instituto Federal de Educação, Ciência e Tecnologia Farroupilha, Santa Rosa-RS, Brasil, melmelissaw@hotmail.com
INTRODUCTION
In irrigated rice growing, the product most used in the supply of nitrogen (N) is urea due to its high level of N and lower cost per unit of element (XUet al., 2005). On the
other hand, is a source that presents the greatest losses of N by processes such as volatilization of ammonia (NH3), reaching up to 80% of the fertilizer applied (LARA CABEZAS;
SOUZA, 2008; MARTHA JÚNIORet al., 2004).
The directions of the research for the first top-dressing application of N in rice say that this shall be done preferably at tillering, preceding the intake of water at a maximum interval of three days between application and initiation of irrigation (SOCIEDADE SUL-BRASILEIRA DE ARROZ INTEGRADO, 2007). This recommendation is based on the fact that urea can be converted into ammonia (NH3) and lost or, following with aerobic conditions, transformed into nitrate (NO3-), which can then be lost as N2or N2O when the soil is flooded. Thus, with flooding being performed immediately after application of urea, the probability of loss by evaporation, and, subsequently by denitrification, decreases, enhancing the efficiency of the fertilizer applied.
However, due to farming operational factors (farm size, irrigation capacity), this interval of time often cannot be met, reflecting on the efficiency of the fertilizer applied and consequently, on the productivity. One possibility to control or reduce the losses of N is to inhibit the rate of urea hydrolysis in soil by using an enzyme inhibitor, such as N-(n-butyl) thiophosphoric triamide (NBPT), currently considered the most promising urease inhibitor and is already being marketed in the U.S.A since 1996 (WATSON, 2000), reducing in 83% the losses by
volatilization in rice (SCIVITTAROet al., 2010).
This study aimed to evaluate the N losses by volatilization and the response of irrigated rice using urea coated with urease inhibitor (NBPT) compared to urea, at different intervals of water intake after applying fertilizer in conventional and no-tillage cropping systems in two different seasons.
MATERIAL AND METHODS
Experiments were carried out in the seasons of 2007/2008 and 2008/2009 at the Universidade Federal de Santa Maria, in soil classified as typical albaqualf, belonging to the mapping unit of Vacacaí (EMPRESA BRASILEIRA DE PESQUISA AGROPECUÁRIA, 1999), with the following characteristics: pHwater(1:1) = 5.0; P(Mehlich-1) = 11.8 mg dm-3;
K(Mehlich-1) = 76 mg dm-3; M.O. = 2.4 m/v; Ca = 4.8 cmol c dm-3;
Mg = 1.6 cmolc dm-3; Al = 0.5 cmol
cdm-3 and clay = 25%.
Each year two experiments were conducted simultaneously, allocated side by side, differing only in the cropping system
(conventional system (CS) or no-tillage (NT)). To obtain the straw in no-tillage system, ryegrass (Lolium multiflorum Lam.)
was sown at a density of 40 kg ha-1 of seeds. The climatic
conditions of the years 2007/2008 and 2008/2009 were, respectively: 30 mm and 40 mm of precipitation, minimum temperature of 28 ºC and 27 ºC, in NT and CS, respectively, and maximum temperature of 30 ºC and 40 ºC, in NT and CS, for two years.
The experimental design was randomized blocks in bifactorial scheme (2x5) with four replications. The factor A (qualitative) was represented to sources of nitrogen (N), common urea and urea coated with NBPT (urea + NBPT) (Super N®), and the factor B (quantitative) five intervals
of water intake, represented by: 0; 3; 6; 9 and 12 days after the application of the nitrogen source. Sowings occurred on 10/26/2007 and 11/10/2008, using cultivar IRGA 417
on the density of 90 kg ha-1of seeds in both seasons.
Fertilization, at the time of sowing, was 60 kg ha-1of P 2O5
and 90 kg ha-1of K
2O of formula 05-20-30, using the total
amount of 120 kg ha-1 of N, divided into 15 kg ha-1 at
sowing in the form of urea, 75 kg ha-1 N before the final
irrigation in the form of different sources and 30 kg ha-1
of N at panicle initiation, for both urea and urea + NBPT.
The experimental units were 4.0 x 2.87 m (11.48 m2) and
floor area to estimate the yield was 3.0 x 1.19 m (3.57 m2).
The remaining practices were performed as recommended by the search for rice production (SOCIEDADE SUL-BRASILEIRA DE ARROZ INTEGRADO, 2007).
The variables analyzed were N losses for 288 hours, N accumulation in shoots of rice plants, SPAD readings in shoots, mineral N in the soil and yield of rice. The variables were subjected to analysis of variance by the F test, and the means of qualitative factors were compared by the Tukey test (P 0.05), whereas the quantitative factors were represented by regression analysis and equations adjusted for the water intake intervals on the variables analyzed. Regression analysis was aimed at identifying the effect of delaying the entry of water onto the rice agronomic performance. A confidence interval (upper and lower limit) at 95% probability was used to express the difference between the sources, and those were significantly different when, in comparison, their intervals did not overlap. The dates were analyzed in software Sisvar, version 5.3.
Evaluations of N losses through volatilization
of NH3 were performed with collectors and procedures
according to Araújo et al. (2009). Evaluations were
performed at 10; 24; 34; 48; 72; 96; 144; 216 and 288 hours after application of nitrogen source in the soil,
determining NH3later, according to Tedesco (1995).
The evaluation of N accumulated in shoots of rice plants was determined by collecting whole plants
at 0.5 m2 of each plot at the last application of N, at
using the methodology described by Tedesco (1995). On the other hand, for the second crop, plants were also collected at the time of full flowering, 93 DAE. The samples were dried at 70 °C in an oven of forced air and they were grounded right after that. To assess the mineral N in the soil, at the time of collecting the plants, a soil auger was used, taking a sample of 0;10 cm deep in each plot, subsequently freezing it at -5 °C until determining the content of mineral forms of nitrogen (ammonium and nitrate + nitrite), following the methodology described by Tedesco (1995).
In order to estimate the nutritional level of N in the culture, at the time of soil and plant sampling, SPAD readings (chorophyll meter SPAD 502) were also performed on the last fully expanded leaf, in three different positions of the leaf, in three plants per plot.
Grain yield was determined by manually harvesting the panicles of the useful area of the plots when the grains reached the average moisture of 20%. These were threshed and later, the grain weight was determined and the moisture was corrected to 13%.
RESULTS AND DISCUSSION
N losses by ammonia volatilization
The NH3 volatilization flows varied with the
source of nitrogen (N) and cropping system in both years (Figure 1). For the season of 2007/2008, no-tillage
system (NT), the amount of NH3 volatilized during the
period of 288 hours, was approximately 28% of the applied amount (the total amount applied corresponded
to 75 kg N ha-1), while the loss of urea + NBPT was
18%. The amount of NH3 volatilization was lower in the
conventional system (CS) compared to the NT in which the losses were 11% and 7% of the nitrogen applied to the common urea and urea + NBPT, respectively. In the NT system, NBPT delayed the conversion of nitrogen
amidic (urea) into NH3, delaying the maximum emission
of NH3 from 34 to 72 hours (2-3 days), occurred with
common urea to 144 hours (six days) in the treatment
urea + NBPT, agreement with the results of Scivittaroet
al. (2010) in similar work.
For the 2008/2009 crop, the results of NH3
volatilization were similar to the previous season, showing different losses between sources and cropping systems.
In the NT system, the initiation of a significant flow of NH3 losses began after 72 hours, regardless of the source, and urea showed the greatest losses, reaching a maximum volatilization after 96 hours, a total cumulative loss of 47% of N applied during 288 hours. Urea coated with NBPT had lower losses of N, with maximums
between 96 and 216 hours after application on the soil and accumulated losses of 20% of total N applied in top-dressing. In the NT system, NBPT delayed most
part of the conversion of urea into NH3for 216 hours,
whereas for the urea without inhibitor, most fertilizer was hydrolyzed between 72 to 96 hours. Similar to the first harvest, the urease inhibitor has not completely inhibited
the hydrolysis and the loss of NH3, and its efficiency
decreased gradually with time.
In this cropping, for the CS, the losses by volatilization have not exceeded 1.2%, and the maximum of losses occurred after 216 hours. In the treatment with
urease inhibitor, total NH3loss was 0.014% of the total
N applied. The urease inhibitor was effective in delaying
and reducing the volatilization of NH3 in the two systems
because the product is an indirect inhibitor that, in aerobic conditions, is converted into a direct inhibitor, its oxygen analogue compound, N-(n-butyl) phosphoric triamide (NBPTO), within minutes or hours (DOMINGUEZ
et al., 2008). However, under anaerobic conditions, this
transformation can take several days (WATSON, 2000). Despite the potential to inhibit the volatilization, the product had reduced its efficiency in the NT system, probably due to the presence of plant residue on the soil surface, since straw reduces the contact of fertilizer with the soil and may present significant activity of urease. This layer of straw covering the soil acts as a barrier between the nitrogen of the fertilizer and the soil, causing the NH3, hydrolysis product, to remain on the surface of the debris, reducing its adsorption to organic and inorganic colloids, thus facilitating
the volatilization (CANTARELLA et al., 2008; LARA
CABEZAS; SOUZA, 2008; TRIVELIN; VITTI, 2006). Moreover, the presence of plant residues on the soil surface concentrates great amounts of urease enzyme, which has its activity related to the presence of organic matter on the soil, promoting microbial activity and greater enzyme production, which shall accelerate the nitrogen fertilizer hydrolysis, resulting in the formation of NH3.
process due to the increase in the rate of reactions linked to the urease activity, as well as facilitated the NH3 upward diffusion to the atmosphere together with water evaporation
from the soil (DA ROSet al., 2005; SANGOIet al., 2003).
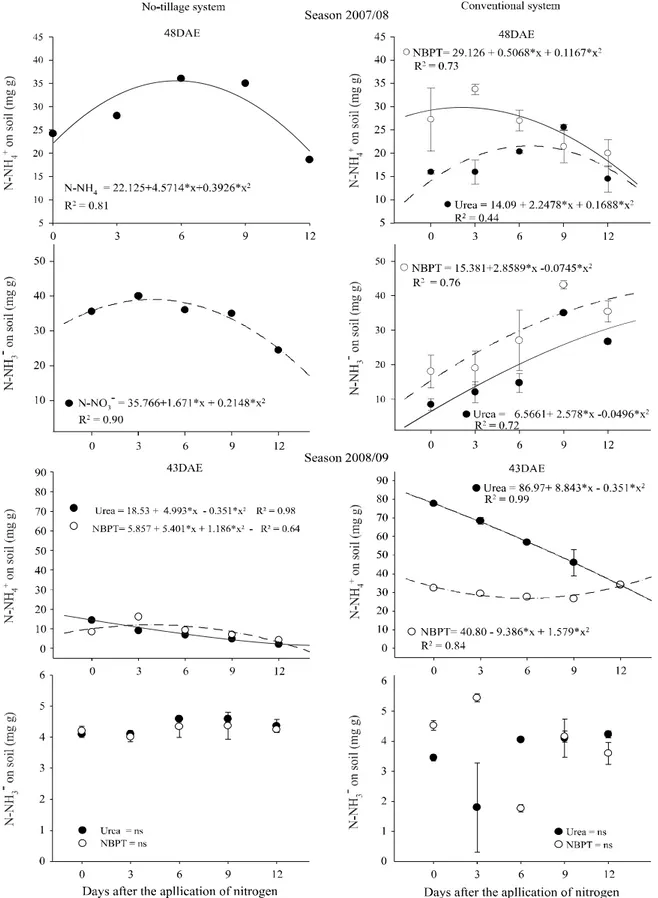
For the season of 2007/08 in the NT system, there was no difference in behavior between urea and urea + NBPT on the levels of N-NH4+ in the soil (Figure 2). The
difference occurred in relation to the intervals of water intake, demonstrating that the maximum concentration of
N-NH4+, occurred on the sixth day after the application
of N. The behavior of N-NO3- fraction was similar, with
gradual reductions in the delay of irrigation. Unlike the NT system, the CS, the treatments differed in the evaluation
of N-NH4+ in mineral soil. Urea + NBPT showed higher
contents of mineral N- NH4+ in soil in the first six days
after application, compared with common urea. This was
Figure 1 -Flow of NH3 losses in kg ha-1 according to the fertilizer used in the no-tillage and conventional cropping systems in the
seasons of 2007/2008 and 2008/2009 of irrigated rice, Santa Maria. 2011
Mineral N in soil, plants and chlorophyll meter reading
reflected in the concentration of N-NO3-, since the greatest
levels were in urea + NBPT and they increased with the time interval until the irrigation input, indicating that N,
in the form of N-NH4+, oxidized to NO
3-overtime (over
the time).
For the season of 2008/2009, the behavior of
N-NH4+ was similar to the first season, demonstrating a
decrease in the content as it delayed the start of irrigation in both cropping systems. However, there was no increase in the concentration of N-NO3- with the reduction of N-NH
4+,
because the sources and the intervals of water intake did not differ significantly in both cropping systems.
In general, the tendency of the N-NH4+ level in
Figure 2 -Levels of N-NH4+and N-NO
-3 on soil according to the fertilizer applied at the no-tillage and conventional cropping systems, during the
seasons of 2007/2008 and 2008/2009. Santa Maria, 2011. The bars on the chart indicate the confidence interval (upper and lower limit) at 95% of probability to express the difference between the sources, and they were significantly different when, at comparison, their intervals did not overlap
be volatilized, forming N-NH4+, be absorbed by plants
and ultimately be converted into N-NO3-(CARRASCO
et al., 2004). Increasing the concentration of N-NO3-over
the reduction of N-NH4+ occurred due to the fact of the
N-NH4+ released on hydrolysis of fertilizer reaching the
form of N-NO3-by nitrification process, depending on
the availability of oxygen for this transformation to occur
(HOLZSCHUHet al., 2009).
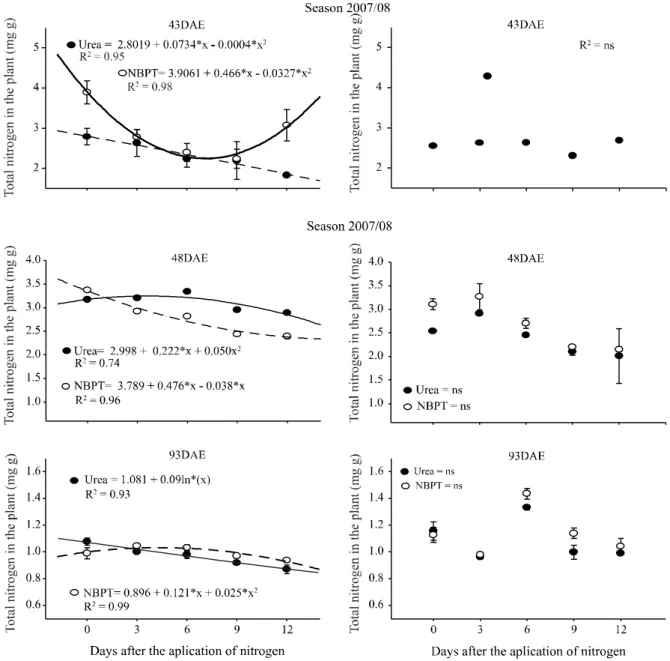
Although the sources used did not express differences in the levels of mineral N in soil at the NT system, the evaluation performed in rice plants showed significant differences between treatments (Figure 3) in 2007/08. The concentration of total N in the plant decreased in treatments with urea as it delayed the beginning of irrigation, while urea + NBPT had the highest concentration of total nitrogen, up to 12 days of delay, between the beginning of fertilization and irrigation. Unlike the NT system, in the CS, some significant differences were detected in relation to the levels of mineral nitrogen in soil, without, however, response in relation to the total N level of the rice plant, because the
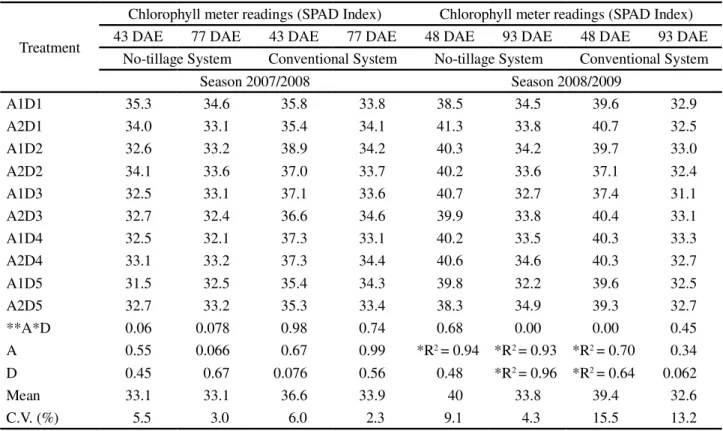
evaluation did not show significant differences, what is completely opposite to what was found in the NT system. Added to this, chlorophyll meter readings (Table 1) were carried out on the same day of the determination of total N content of plants (43DAE). In this evaluation, there were no significant differences between N sources and the intervals of water intake into the CS, as well as into the NT system.
In the second season, 2008/2009, the total N content, determined at panicle initiation (48 DAE) (Figure 3), in shoots of rice at NT system differed between the sources and intervals of water intake, in which urea was the best treatment in almost all time intervals. However, these differences were detected only in a first moment, because, at the flowering stage, the behavior of sources was opposite to the first evaluation. In the case of CS, there were no significant differences in both evaluations, as found in the previous harvest. However, chlorophyll meter readings (Table 1) in the NT system showed different results, indicating that the first evaluation performed at 48 DAE, urea +NBPT behaved similar to the common urea, but there
Table 1 -Chlorophyll meter readings (CR) at 43 and 77 DAE in the cropping of 2007/08 and at 48 and 93DAE in the cropping of
2008/2009 according to the source of nitrogen and the interval of time between the nitrogen fertilization at the tillering and the water intake into the no-tillage and conventional cropping systems. Santa Maria, 2011
Treatment
Chlorophyll meter readings (SPAD Index) Chlorophyll meter readings (SPAD Index)
43 DAE 77 DAE 43 DAE 77 DAE 48 DAE 93 DAE 48 DAE 93 DAE
No-tillage System Conventional System No-tillage System Conventional System
Season 2007/2008 Season 2008/2009
A1D1 35.3 34.6 35.8 33.8 38.5 34.5 39.6 32.9
A2D1 34.0 33.1 35.4 34.1 41.3 33.8 40.7 32.5
A1D2 32.6 33.2 38.9 34.2 40.3 34.2 39.7 33.0
A2D2 34.1 33.6 37.0 33.7 40.2 33.6 37.1 32.4
A1D3 32.5 33.1 37.1 33.6 40.7 32.7 37.4 31.1
A2D3 32.7 32.4 36.6 34.6 39.9 33.8 40.4 33.1
A1D4 32.5 32.1 37.3 33.1 40.2 33.5 40.3 33.3
A2D4 33.1 33.2 37.3 34.4 40.6 34.6 40.3 32.7
A1D5 31.5 32.5 35.4 34.3 39.8 32.2 39.6 32.5
A2D5 32.7 33.2 35.3 33.4 38.3 34.9 39.3 32.7
**A*D 0.06 0.078 0.98 0.74 0.68 0.00 0.00 0.45
A 0.55 0.066 0.67 0.99 *R2= 0.94 *R2= 0.93 *R2= 0.70 0.34
D 0.45 0.67 0.076 0.56 0.48 *R2= 0.96 *R2= 0.64 0.062
Mean 33.1 33.1 36.6 33.9 40 33.8 39.4 32.6
C.V. (%) 5.5 3.0 6.0 2.3 9.1 4.3 15.5 13.2
A1: Urea; A2: Urea + NBPT; D1: water intake at the moment of nitrogen sources application; D2: water intake 3 days after the nitrogen sources application; D3: water intake 6 days after the nitrogen sources application; D4: water intake 9 days after the nitrogen sources application; D5: water intake 12 days after the nitrogen sources application;ns Not significant in P 0.05 level; * Quadratic equations adjusted to express the response of the
were no differences between intervals of water intake for the first source. For the CS, NBPT presented lower readings compared to common urea when the beginning of irrigation was delayed for more than 12 days.
In the second evaluation performed at the beginning of flowering (93 DAE), the behavior of sources in relation to water intake, at NT system, was similar to the first, with no differences between them. For the CS, no differences
Figure 3 - Total nitrogen in rice plant performed at 43 DAE in 2007/08 and at 48 DAE and 93 DAE in the season of 2008/2009
according to the fertilizer applied in no-tillage and conventional cropping systems. Santa Maria, 2011. The bars on the chart indicate the confidence interval (upper and lower limit) at 95% probability to express the difference between sources, and they were significantly different when, at comparison, their intervals did not overlap
were found between sources and between intervals of water intake. In this sense, the reading of chlorophyll meter is an indirect measure of chlorophyll and its response, in the second year, did not reflect the actual nutritional status of the plant, since it has shown differences not detected by laboratory evaluation. The chlorophyll meter readings only correlate with the concentration of nitrogen in the plant when both evaluations are conducted on the same
leaf. For this experiment, all the shoot area of the plant was used to determine the total nitrogen, including those already senescent, which should dilute the total N content, rather than the chlorophyll meter which estimates the level of N directly in the assessed leaf.
Response of irrigated rice to the sources of N
At the first cropping (2007/2008), the yield of the grains for the NT system did not show significant differences between the intervals of water intake and the sources of N used in the experiment (Figure 4). In the case of CS, there were some differences in the yield of grains between the intervals of water intake and the sources of N. When the water intake occurred right after the application of nitrogen fertilizer; the best behavior was presented by the common urea (4.5% higher). However, when the
beginning of the irrigation was delayed for more than nine days, the urea + NBPT presented more grain yield.
At the second cropping (2008/2009), in the NT system, the sources and the interval of water intake had an influenced the grain yield. In this assessment, urea +NBPT presented an increase in relation to urea when the beginning of irrigation took place at the ninth day after the application of fertilizer. On the other hand, in the CS, there were no significant differences between the sources and, as water intake was delayed, there was a decrease of 12% in the yield from the first in relation to the last interval of water intake.
The response in relation to grain yield differed between the systems evaluated for two years. In the first year, there were no significant differences between intervals of water intake and sources of N. This can be attributed to minor
Figure 4- Grain yield in the seasons of 2007/2008 and 2008/2009 according to the fertilizer applied in the no-tillage and conventional cropping systems, Santa Maria. 2011. The bars on the chart indicate the confidence interval (upper and lower limit) at 95% probability to express the difference between sources, and they were significantly different when, at comparison, their intervals did not overlap
differences in N losses through volatilization between sources and the possibility of a greater immobilization of part of the available nitrogen due to the implementation of the NT system after the cultivation of ryegrass, with consequent lower initial availability of nutrients to
plants (MULVANEY et al., 2010). However, in the CS,
there were differences in yield between periods of water intake and sources of urea, where common urea showed the best behavior when water intake occurred soon after the application. This behavior can be explained by the fact that N is readily available, since urea has a high solubility in
water (SILVAet al., 2008), whereas urea coated with
urease inhibitor has its gradual release, especially in
anaerobic environments (CUNHA et al., 2011) and
the immediate use by the crop can be jeopardized. When the beginning of irrigation was delayed for more than nine days, the urea + NBPT showed higher productivity, demonstrating that this source is important for the handling of areas with difficulties in establishing the amount of water immediately after the application of N.
The result of productivity in the second year was different from the first, since in this season, the NT system productivity was directly influenced by the sources of urea. In this case, the differences in N losses through volatilization of N between sources were higher, but lower for urea with urease inhibitor. In CS there were no significant differences for any of the factors studied. This result can be explained by lower N losses between sources, with little influence of sources and delayed irrigation on grain yield. Thus, it is possible to consider that the response of irrigated rice to urea coated with urease inhibitor depends on the risks of loss through volatilization of NH3, which are associated to the soil conditions, climate and management on site. Furthermore, on average, the coefficient of variation of the analyzes were approximately 15%, giving an average precision of the results obtained according to the classification of Pimental-Gomez (1990).
CONCLUSIONS
1. The use of urea coated with NBPT slows and reduces losses by ammonia volatilization compared with urea, but the magnitude of the effectiveness of adding NBPT into urea is associated with soil and climate conditions, influenced by the year of cropping and the rice cultivation system, which are not always expressed in productivity;
2. In no-till and conventional systems, the best performance of the urease inhibitor occurs as the establishment of the amount of water for irrigation is delayed after the fertilizer application. When the interval between the nitrogen application and the irrigation is within the recommended levels, there is no advantage in adding the product compared to isolated use of urea.
ACKNOWLEDGMENT
To the of Research Support of the State of Rio Grande do Sul - Fundação de Apoio à Pesquisa do Estado do Rio Grande do Sul (FAPERGS) - for the Research Productivity Program of Rio Grande do Sul to Mara Grohs, to the National Council of Scientific and Technological Development - Conselho Nacional de Desenvolvimento Científico e Tecnológico (CNPq) -for the financial aid and research productivity grants to Enio Marchesan and to Leandro Souza da Silva.
REFERENCES
ARAÚJO, E. da S. et al. Calibration of a semi-opened static chamber for the quantification of volatilized ammonia from soil.
Pesquisa Agropecuária Brasileira, v. 44, n. 7, p. 769-776, 2009. CANTARELLA, H. Nitrogênio.In: NOVAIS, R. F.Fertilidade dos solos. Viçosa, MG, 2007. p. 376-470.
CANTARELLA, H.et al. Ammonia volatilisation from urease inhibitor-treated urea applied to sugarcane trash blankets.
Scientia Agricola,v. 65, n. 4, p. 397-401, 2008.
CARRASCO, D.et al. Measurement of coupled nitrification-denitrification in paddy fields affected by Terrazole, a nitrification inhibitor. Biology Fertily of Soils, v. 39, n. 3, p. 186-192, 2004.
CUNHA, P. C .R. et al. Fontes, formas de aplicação e doses de nitrogênio em feijoeiro irrigado sob plantio direto. Pesquisa Agropecuária Tropical, v. 41, n. 1, p. 80-86, 2011.
DA ROS, C. O.et al. Volatilização de amônia com aplicação de uréia na superfície do solo, no sistema plantio direto. Ciência Rural, v. 35, n. 2, p. 799-805, 2005.
DOMINGUEZ, M. J.et al. Desing, synthesis, and biological evaluation of phosphoramide derivatives as urease inhibitors.
Journal Agricultura Food Chemical, v. 56, n. 10, p.
3721-3731, 2008.
EMPRESA BRASILEIRA DE PESQUISA AGROPECUÁRIA. Centro Nacional de Pesquisa de Solos. Sistema brasileiro de classificação dos solos. Brasília: Embrapa-SPI, 1999. 412 p. HOLZSCHUH, M. J. et al. Resposta do arroz irrigado ao suprimento de amônio e nitrato. Revista Brasileira de Ciência do Solo, v. 33, n. 5, p. 1323-1331, 2009.
LARA CABEZAS, W. A. R; SOUZA, M. A. Volatilização de amônia, lixiviação de nitrogênio e produtividade de milho em resposta à aplicação de misturas de uréia com sulfato de amônio ou com gesso agrícola. Revista Brasileira de Ciência do Solo, v. 32, n. 6, p. 2331-2342, 2008.
PIMENTEL-GOMES, F. Curso de estatística experimental. 13. ed. Piracicaba: Nobel, 1990. 468 p.
SILVA, E. C.et al. Utilização do nitrogênio da palha de milho e de adubos verdes pela cultura do milho. Revista Brasileira de Ciência do Solo, v. 32, p. 2853-2861, 2008.
SANGOI, S.et al. Volatilização de NH3 em decorrência da forma de aplicação de uréia, manejo de resíduos e tipo de solo, em laboratório.Ciência Rural, v. 33, n. 4, p.687-692, 2003.
SCIVITTARO, W. B. et al. Perdas de nitrogênio por volatilização de amônia e resposta do arroz irrigado à aplicação de ureia tratada com o inibidor de urease NBPT.
Ciência Rural,v. 40, n. 6, p. 1283-1289, 2010.
SOCIEDADE SUL-BRASILEIRA DE ARROZ IRRIGADO.
Arroz Irrigado: Recomendações Técnicas da Pesquisa para o Sul do Brasil. Santa Maria, RS: SOSBAI, 2007. 159 p.
TEDESCO, M. J.Análise de solo, plantas e outros materiais. Porto Alegre: UFRGS, 1995. 174 p.
TRIVELIN P. C. O; VITTI A. C. Manejo do Nitrogênio e Enxofre na nutrição e adubação da cana-de-açúcar. CENA/ USP, 2006. 47 p. Available at: <http: www.ppi-ppic.org/ ppiweb>. Accessed: 22 mar. 2007.
WATSON, C. J.Urease activity and inhibition - principles and practice. London: The International Fertilizers Society,
2000. 40 p.