Long Noncoding RNA Expression during
Human B-Cell Development
Andreas Petri1,2, Karen Dybkær2,3,4, Martin Bøgsted2,3,4, Charlotte Albæk Thrue1,2, Peter
H. Hagedorn1,2, Alexander Schmitz2, Julie Støve Bødker2, Hans Erik Johnsen2,3,4,
Sakari Kauppinen1,2*
1Center for RNA Medicine, Department of Clinical Medicine, Aalborg University, Copenhagen, Denmark, 2Department of Haematology, Aalborg University Hospital, Aalborg, Denmark,3Department of Clinical Medicine, Aalborg University, Aalborg, Denmark,4Clinical Cancer Research Center, Aalborg University Hospital, Aalborg, Denmark
Abstract
Long noncoding RNAs (lncRNAs) have emerged as important regulators of diverse cellular processes, but their roles in the developing immune system are poorly understood. In this study, we analysed lncRNA expression during human B-cell development by array-based expression profiling of eleven distinct flow-sorted B-cell subsets, comprising B1, pre-B2, immature, naive, memory, and plasma cells from bone marrow biopsies (n = 7), and naive, centroblast, centrocyte, memory, and plasmablast cells from tonsil tissue samples (n = 6), respectively. A remapping strategy was used to assign the array probes to 37630 gene-level probe sets, reflecting recent updates in genomic and transcriptomic databases, which enabled expression profiling of 19579 long noncoding RNAs, comprising 3947 anti-sense RNAs, 5277 lincRNAs, 7625 pseudogenes, and 2730 additional lncRNAs. As a first step towards inferring the functions of the identified lncRNAs in developing B-cells, we ana-lysed their co-expression with well-characterized protein-coding genes, a method known as
“guilt by association”. By using weighted gene co-expression network analysis, we identified 272 lincRNAs, 471 antisense RNAs, 376 pseudogene RNAs, and 64 lncRNAs within seven sub-networks associated with distinct stages of B-cell development, such as early B-cell development, B-cell proliferation, affinity maturation of antibody, and terminal differentiation. These data provide an important resource for future studies on the functions of lncRNAs in development of the adaptive immune response, and the pathogenesis of B-cell malignan-cies that originate from distinct B-cell subpopulations.
Introduction
Recent data implies that the mammalian genome is pervasively transcribed and encodes thou-sands of long noncoding RNAs (lncRNAs) that play distinct and specialized roles in numerous biological processes [1–6] and many diseases [7–11]. LncRNAs lack a significant open reading frame and comprise an expanding inventory of noncoding RNAs (ncRNAs) that are longer
a11111
OPEN ACCESS
Citation:Petri A, Dybkær K, Bøgsted M, Thrue CA, Hagedorn PH, Schmitz A, et al. (2015) Long Noncoding RNA Expression during Human B-Cell Development. PLoS ONE 10(9): e0138236. doi:10.1371/journal.pone.0138236
Editor:Liang-Hu Qu, Sun Yat-sen University, CHINA
Received:June 2, 2015
Accepted:August 26, 2015
Published:September 22, 2015
Copyright:© 2015 Petri et al. This is an open access article distributed under the terms of the
Creative Commons Attribution License, which permits unrestricted use, distribution, and reproduction in any medium, provided the original author and source are credited.
Data Availability Statement:Microarray data are available from NCBI’s Gene Expression Omnibus database under accession codes GSE68878 and GSE69033.
than 200 nucleotides in length, such as long intergenic ncRNAs (lincRNAs), long intronic ncRNAs, antisense RNAs, pseudogene RNAs, and transcribed ultraconserved regions [12]. Antisense transcripts are encoded on the opposite strand relative to their sense gene and they constitute a functionally diverse class of molecules that can modulate nearly all stages of gene expression (reviewed in ref [13]). The type of overlap displayed between the sense and anti-sense transcript can be used to further divide this sub-class into head-to-head overlapping, where the 5’ends of the sense-antisense RNAs overlap, fully-overlapping, where the antisense transcript is fully embedded in the sense transcript, and tail-to-tail, where the 3’ends overlap [14]. LincRNAs do not overlap with other genes and this characteristic has facilitated genetic loss-of-function studies [1], but apart from this they share many characteristics with other lncRNA classes that appear as modular scaffolds, combining distinct domains that can interact with DNA, RNA, or protein [15–17]. Although the genomic organization of antisense RNAs and lincRNAs might suggest a functional distinction into cis- and trans-acting lncRNAs, respectively, this is not always true and there are examples of trans-acting antisense RNAs [18] as well as cis-acting lincRNAs [19]. Pseudogenes constitute a class of genes that are copies of protein-coding genes, but due to accumulation of disabling mutations, the genes have lost their protein-coding potential. Thus, pseudogenes can give rise to ncRNA transcripts, whose expres-sion have been linked to regulation of expresexpres-sion of their protein-coding counterpart [20].
B-cells develop from the common lymphoid progenitor cells in the bone marrow and the initial antigen-independent phase is characterized by immunoglobulin gene rearrangements through action of the RAG1 (recombination-activating gene 1)-RAG2 protein complex [21]. Once a functional B-cell receptor has been formed and B-cells have matured, the naive B-cells acquire the ability to circulate and thereby patrol the secondary lymphoid organs for cognate antigens. Upon antigen exposure within the germinal center (GC), the activated centrocyte dif-ferentiates into a rapidly proliferating centroblast that undergoes affinity maturation of the B-cell receptor (BCR) [22]. Expression of the B-cell lymphoma 6 (BCL6) gene in the centroblasts enables tolerance of DNA breaks and high proliferation rates that would otherwise induce apo-ptosis [23]. Further differentiation results in two long-lived B-cell populations: the memory B cells and antibody-secreting plasma cells.
While the roles of transcription factors and miRNAs in B-cell development have been extensively studied [24,25], our understanding about the functions of lncRNAs in B-cell lym-phopoiesis is still limited [26–28]. Here, we describe exon array-based analysis of lncRNA expression in developing B-cell subsets isolated by flow cytometry-based sorting from human tonsils and bone marrow, respectively. The array probes were reorganized into gene-specific probe sets using updated genome information, gene models and annotation [29], and by using weighted gene co-expression network analysis [30] on the expression profiles, we identified several lncRNAs embedded in well-defined gene networks involved in specific stages of human B-cell development.
Materials and Methods
Collection of tonsils and bone marrow biopsies
The study was conducted in accordance with the Declaration of Helsinki, and all normal tissue samples were collected with written informed consent from each patient, in accordance with the MSCNET research protocol that was reviewed and approved by the health ethics commit-tee for the North Denmark Region (Approval N-20080062MCH). Tonsils were collected from six patients during routine tonsillectomy as previously described [31], and bone marrow tissue was obtained by physical scraping of the medulla from seven patients undergoing cardiac sur-gery as described [32].
lncRNA Expression during Human B-Cell Development
The funders had no role in study design, data collection and analysis, decision to publish, or preparation of the manuscript.
Isolation of B-cell subsets from tonsils and bone marrow by flow
cytometry
Mononuclear cells were isolated from tonsils and bone marrow and prepared for multipara-metric flow cytometry using an optimized and validated protocol as previously described [32]. All cells were stained for CD10, CD20, CD27, CD38, and CD45. In addition, cells from tonsils were stained for CD3, CD44, and CXCR4, and cells from bone marrow were stained for CD19 and CD34, respectively. This allowed separation of the following distinct B-cell subsets by fluo-rescence-activated cell sorting (FACS): (i) naive (N(b) and N(t)) and memory (M(b) and M(t)) cells from bone marrow (b) and tonsils (t), respectively; (ii) pre-B1 (B1), pre-B2 (B2), imma-ture (I), and end-stage antibody-producing plasma cells (PC) from bone marrow, and (iii) cen-trocytes (CC), centroblasts (CB), and plasmablasts (PB) from tonsils.
Data analysis
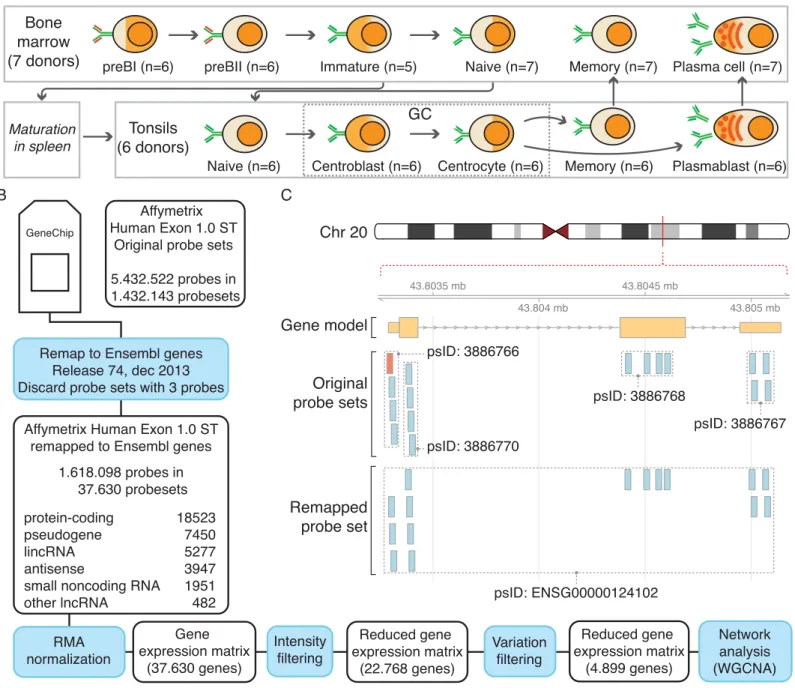
The data acquisition and analysis are outlined inFig 1. Data analyses and visualizations were done using R [33], BioC [34], WGCNA-package [30] and Cytoscape [35].
Expression profiling of B-cell subsets
Expression profiling of flow-sorted B-cell subsets in human bone marrow and tonsils on Affy-metrix Human Exon 1.0 ST arrays (AffyAffy-metrix, Santa Clara, CA) has been described elsewhere [32] and data have been made available at NCBI’s Gene Expression Omnibus database under accession codes GSE68878 and GSE69033. The exon array data were RMA normalized [36] using R/BioC and a custom Chip Description File (CDF), where probes were remapped into probe sets corresponding to Ensembl gene IDs (Ensembl release 74) [29,37] (as shown inFig 1A). Probe sets containing only 3 probes were excluded from analysis.
Assessment of coding potential
We used CPAT [38] version 1.2.1 to estimate the coding potential of transcripts encoded by genes that were detected by the remapped Affymetrix Exon array. The human prebuilt training model and hexamer frequency table distributed with the program were used. The transcript coding probabilities were summarized for each gene to give maximal coding probability, mean coding probability, and range in coding probability.
Recursive partitioning of FACS data
From the FACS data we identified the surface markers that best separated the B-cell subsets by constructing branched binary decision trees for bone marrow and tonsil samples, respectively. In each node of a given tree, the cells were partitioned to one of two possible branches by a sim-ple binary decision, based on the fluorescence levels of two surface markers. The trees were restricted to be maximally three nodes deep. At each node, optimal surface marker pairs and decision rules were identified as those that reduced the Gini impurity the most by an exhaustive search [39].
Comparison of sample clustering
Characterization of lncRNA co-expression with their neighboring genes
Each of the 37630 genes probed on the microarray was grouped into protein-coding genes (18523), lincRNAs (5277), antisense RNAs (3947), small non-coding RNAs (1951), other lncRNAs (482), or pseudogenes (7450), based on gene biotype annotation in Ensembl [37]. For 29428 (76%) of the genes probed on the microarray, one or more neighboring genes within 1kb on the genome could be identified on either strand on the array, hereafter referred to as
Fig 1. Overview of the data analysis pipeline.A) Diagram of B-cell lymphopoiesis depicting the different B-cell subpopulations isolated from bone marrow and tonsils. B) Flow diagram highlighting the different steps for processing the exon array data. C) Illustration showing the concept of working with updated annotation and remapped probe sets for gene PI3, ENSG00000124102. Four defined exon probe sets cover the three exons. The most upstream probe set contains a probe that is not fully contained in the most current gene model of PI3 (highlighted in red). The remapped probe set combines all valid PI3 probes into a single probe set.
doi:10.1371/journal.pone.0138236.g001
local pairs. For each neighbor gene pair, the genomic positions, the strand, overlapping exons or introns, and co-expression similarity were catalogued.
Identification of gene co-expression networks
Prior to network analysis, the data were filtered to remove expression data from genes that could not be reliably detected above background and exhibited low variation across the sam-ples. To guide the selection of intensity threshold, background probe sets were constructed that matched real probe sets in the number of probes and distribution of GC content by repeatedly sampling from the antigenomic background probes present on the exon array. The intensity threshold level was set at two standard deviations above the mean intensity of the constructed background probe sets, and genes were required to exhibit expression above this threshold for all samples in at least one B-cell subset. Furthermore, the standard deviation of gene expression across all samples was used to remove genes with low variation (standard deviation<0.5).
Weighted gene co-expression network analysis (WGCNA) [30] was used to analyze relation-ships between gene transcripts, essentially as described on the WGCNA website (http://www. genetics.ucla.edu/labs/horvath/CoexpressionNetwork/Rpackages/WGCNA/Tutorials/index. ht).
Results and Discussion
Transcriptional profiling of human B-cell lymphopoiesis
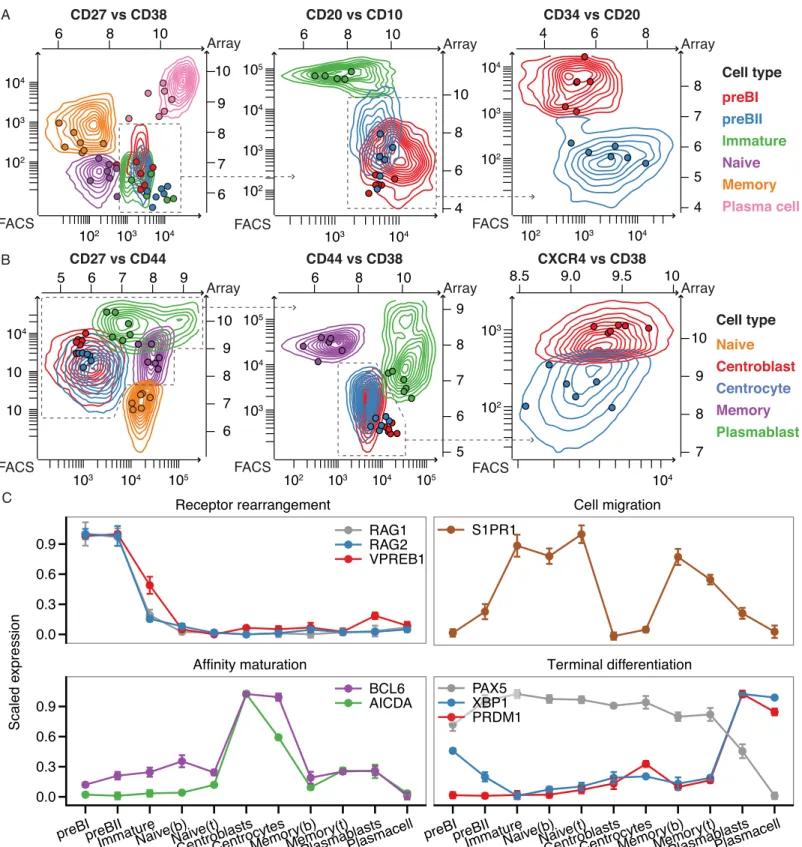
In this study, we isolated eleven different B-cell subsets from human sternal bone marrow and tonsil biopsies by flow cytometry [31,32], and conducted gene expression profiling using Affy-metrix Human Exon 1.0 ST arrays (Fig 1A). The data were summarized using updated probe set definitions to ensure that the probe sets were consistent with recent annotations and gene models [29] (Fig 1B and 1C). This has previously been shown to improve the accuracy of gene expression profiling [41]. To validate that the flow-sorted cell subsets represent distinct B-cell populations, we used recursive partitioning on the multiparametric flow cytometry data to identify surface marker pairs that most effectively discriminate the sorted cell populations. The overlay of surface marker expression data on the multiparametric flow cytometry data shows that there is a high degree of concordance between marker gene expression and protein levels, and that the isolated subpopulations are well separated (Fig 2A and 2B). In addition, we find that our expression data capture several well-characterized events during B-cell development, such as expression of RAG1 and -2 along with the surrogate light chain in pre-B1 and -B2 cells and expression of S1PR1, which is necessary for immature B-cell to transfer from the bone marrow to the blood and to exit from secondary lymphoid organs [42,43]. Furthermore, we observe expression of AICDA and BCL6 in the germinal center B-cells, and reciprocal expres-sion of transcription factor PAX5 and transcriptional repressor PRDM1 [44], as well as expres-sion of XBP1, a key regulator of immunoglobulin secretion in terminally differentiated B-cells [45] (Fig 2C). These observations demonstrate that our expression data recapitulate key aspects of B-cell development, and can thus serve as basis for transcriptional profiling of lncRNAs in distinct B-cell subsets.
Expression profiling of long noncoding RNAs
Fig 2. Isolation of human B-cell subsets from bone marrow and tonsils.A) Overlay of flow cytometry and array data on surface markers used for sorting of the bone marrow B-cell subsets. The contour diagrams show summary of events from the collected B-cell subsets in all samples and dots depict gene expression values (log2intensities) in the individual cell samples. B) As in (A), but for tonsillar B-cell subsets and sorting markers. C) Expression profiles of selected genes, dots correspond to group means.
doi:10.1371/journal.pone.0138236.g002
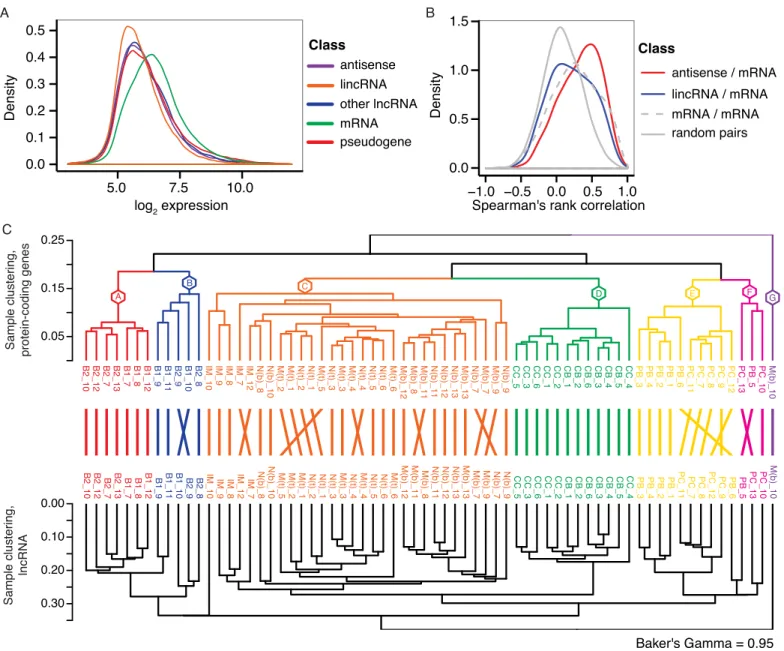
referred to as other lncRNAs in this manuscript). We used CPAT [38] to analyze the coding potential of transcripts derived from genes assayed by the remapped array. Transcript coding potential was summarized for each gene and used to supplement the gene biotype annotations from Ensembl. Studies employing both microarray and RNA-seq based expression profiling have reported that lncRNAs exhibit lower expression levels compared to protein-coding genes [46,47]. In accordance with these observations, we find that various classes of lncRNAs, such as lincRNAs and antisense RNAs, are expressed at lower levels compared to protein-coding mRNAs (Fig 3A). Antisense RNAs were recently shown to be important regulators of their sense partner (reviewed in ref [13]), and additionally, several lncRNAs, including lincRNAs have been shown to be involved incisregulation of nearby genes [46,48,49]. Our data showed a
similar trend during B-cell development (Fig 3B). Specifically, analysis of neighboring genes within 1kb showed that local antisense transcripts correlate better with corresponding sense mRNAs than local lincRNA—mRNA pairs or local mRNA—mRNA pairs. Next, we performed unsupervised hierarchical clustering of the samples based on lncRNA expression and com-pared to sample clustering obtained by clustering on protein-coding gene expression. We found highly similar sample grouping into distinct B-cell subsets based on expression from the two different classes (Baker’s gamma correlation of 0.95,Fig 3C), and even subdividing the lncRNAs into lincRNAs and antisense RNAs resulted in sample groupings that were very simi-lar to protein-coding based sample clustering (Baker’s gamma correlation of 0.83 and 0.82, respectively,S1 Fig).
Long noncoding RNA expression during human B-cell development
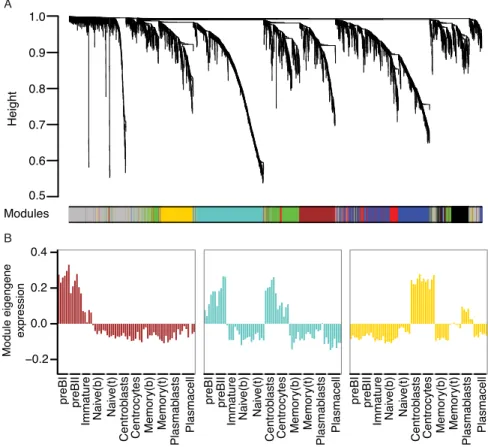
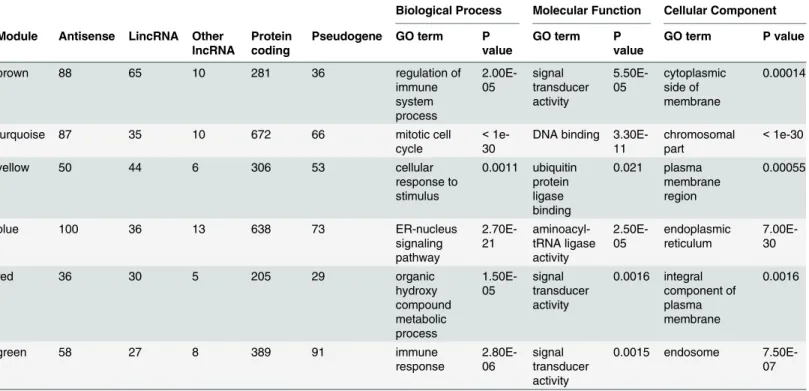
The use of RNA-sequencing technologies has led to the identification of tens of thousands of lncRNAs in metazoans [47,50]. However, only a few lncRNAs have been functionally charac-terized. One method of predicting functions of lncRNAs from gene expression data is based on the analysis of co-expression with well-characterized protein-coding genes, a method known as guilt-by-association [15,51,52]. Co-expression alone is not sufficient to reliably assign func-tions to lncRNAs, but information on lncRNAs embedded in transcriptional networks associ-ated with B-cell development provides an important starting point for functional studies. To put emphasis on genes that might partake in B-cell development, we filtered the expression data and removed genes that did not vary considerably across all samples (as described in Materials and Methods). Subsequently, we used WGCNA to describe co-expression relation-ships between protein-coding genes and lncRNAs and identified seven modules, which were color-coded for presentation purposes (Fig 4AandS2 Fig). The expression patterns of genes in the identified co-expression modules are summarized by the corresponding first eigengene [53] (Fig 4BandS2 Fig).Table 1summarizes the numbers of genes annotated to different gene biotypes in each module andS1 Tablelists all lncRNAs associated with the identified modules. Functional characteristics of the identified modules were analyzed by GO overrepresentation analysis and the most significantly overrepresented GO terms from each of the three ontologies (i.e. biological process, molecular function, and cellular component) are presented inTable 1. Since several studies have shown that highly connected genes (hub genes) are essential for a given gene network, we also identified hub genes in three of the identified modules (Fig 5). These modules are described in detail below.
Early B-cell development. Genes that are expressed during early B-cell differentiation,
module (seeFig 4Band heatmaps inS2 Fig). Enrichment analysis of GO terms assigned to genes in this module show overrepresentation of the terms‘regulation of immune system pro-cess’,‘leukocyte activation’,‘signal transducer activity’, and‘nucleic acid binding transcription factor activity’(Table 1andS2 Table). Notably, genes assigned to‘signal transducer activity’
include FLT3 and IL7R, both of which are growth-factor receptors required for early B-lym-phopoiesis [54,55], and genes assigned to‘nucleic acid binding transcription factor activity’
include important factors such as LEF1, MYB, and IKZF3 [56–58].
The hub genes of the brown module are shown inFig 5A. Consistent with the notion that highly connected genes are important in networks, we find surrogate light chain (VPREB1), RAG2, and DNTT, which are important for generating diversity at the junctions of rearranged
Fig 3. Long noncoding RNA expression in human B-cell subpopulations.A) Distribution of array-derived expression levels across all samples are shown for different gene biotype classes: Antisense, lincRNA, other lncRNA, mRNA, and pseudogene. B) Correlation of expression patterns between gene pairs located in close proximity on the genome. C) Hierarchical clustering of samples based on expression of protein-coding genes (top dendrogram) and all lncRNA classes (bottom dendrogram), respectively.
doi:10.1371/journal.pone.0138236.g003
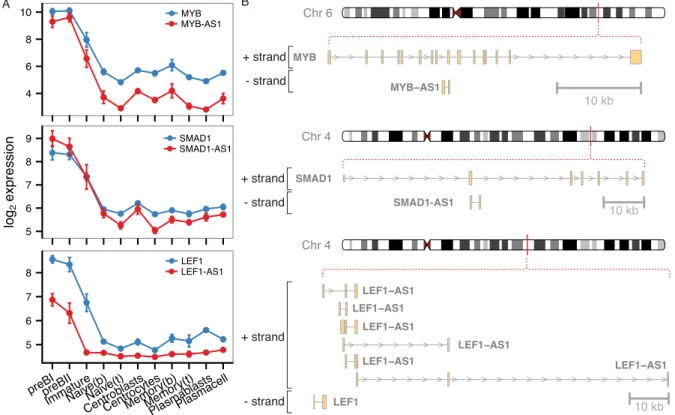
Ig heavy genes, as well as transcription factors LEF1 and MYB to be hub genes. Interestingly, we identified several lncRNAs at the center of this module, including antisense transcripts to transcription factors with well-known roles in early B-cells (MYB—MYB-AS1, SMAD1—
SMAD1-AS1, and LEF1—LEF1-AS1) and a lincRNA called CTC-436K13.6. While MYB-AS1 and SMAD-AS1 are simple transcripts each with two exons, the LEF1-AS1 has multiple exons and encodes several transcript variants and only one of the isoforms is a true antisense RNA (Fig 6). Antisense transcripts are an interesting subclass of lncRNAs that can exert regulatory effects directly on their sense transcript, incison neighboring genes, and even intranson distal
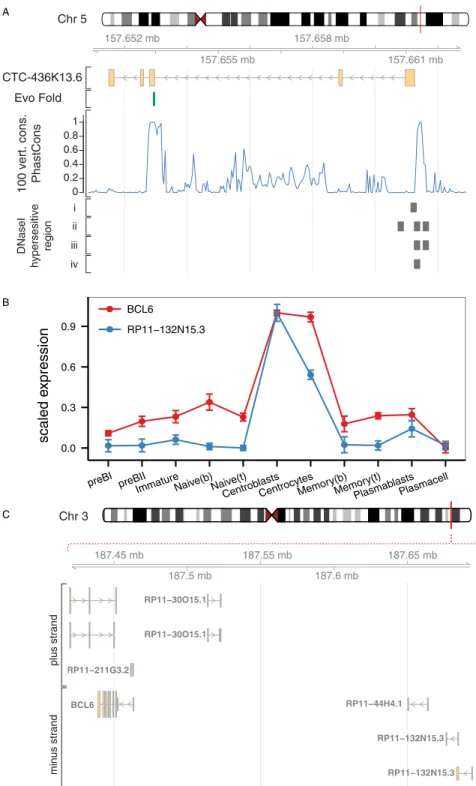
genes, co-transcriptionally or post-transcriptionally (reviewed in ref. [13]). The role of such antisense transcripts during B-cell development is currently unknown, but their central posi-tion in the brown module suggests important funcposi-tions in early B-cell development. In addi-tion, the central part of the brown module contains a highly connected lincRNA (CTC-436K13.6), which is located on chromosome 5, between genes CLINT1 and EBF1. Both of these genes are expressed at various stages of B-cell development, but none of them show an expression profile similar to CTC-436K13.6. The EBF1 gene encodes the transcription factor Early B-cell Factor 1, which is essential for establishing a transcription factor network ensuring B-cell line commitment [59]. Results from the ENCODE project identifies the 5’end of CTC-436K13.6 and its upstream region as DNaseI hypersensitive in a variety of cell types, including CD34+hematopoietic progenitor cells mobilized from a donor treated with G-CSF, CD20+B cells, CD14+monocytes, and Jurkat cells, but not in common cell lines, such as HepG2,
HeLa-Fig 4. Weighted gene co-expression network analysis of human B-cell subpopulation transcriptomes. A) Cluster dendrogram showing genes grouped into distinct modules with height on the y-axis corresponding to co-expression distance between genes. B) Module expression summaries are shown with values of the components of the module eigengene (y-axis) versus microarray sample (x-axis).
S3, and Huh7 (Fig 7A). Active regulatory regions and especially promoters tend to be DNaseI-sensitive, which provides further evidence that the lincRNA is transcribed in cells of hemato-poietic origin. To examine the sequence conservation of this lincRNA, we used PhastCons scores calculated from multiple alignment of 100 vertebrate species available through the UCSC genome browser [60,61] and observed that exon 3 and the surrounding intronic sequences as well as the promoter region immediately upstream of the lincRNA are all well-conserved. Furthermore, we observed that the junction between the 2ndintron and 3rdexon is spanned by a conserved stem-loop structure [62], suggesting that this lincRNA could be subject to alternative splicing [63]. It has previously been reported that lincRNA homology is often restricted to short, highly conserved sequences [2] and that lncRNA promoters often show higher conservation than protein-coding gene promoters [64]. However, despite the fact that certain elements of this lincRNA overlap with highly conserved genomic regions and the fact that CTC-436K13.6 falls in a syntenic block, there are currently no reported orthologues.
Apart from the lncRNAs discussed above, we identified several additional lncRNAs that are part of the brown module (S1 Table). For each lncRNA we report correlation (both Pearson’s and Spearman’s) to the module eigengene, which can help identify whether the lncRNA has an expression profile that is similar to the eigengene (i.e. expressed in early B-cell) or whether it is absent from early B-cells and expressed later during B-cell development.
Proliferative stages of B-cell development. Genes in the turquoise module exhibit highest
expression in pre-B1, pre-B2 cells, as well as centroblasts and to a lesser extent in centrocytes (Fig 4B), or the opposite expression profile (i.e. down-regulated or absent in pre-B1, pre-B2, centroblasts, and centrocytes,S2 Fig). The module members show highly significant overrepre-sentation of genes involved in mitotic cell cycle related processes (Table 1andS2 Table) consis-tent with the fact that both pre-B cells and germinal center centroblasts are actively
proliferating cells [65]. The genes at the center of the module (Fig 5B) are all tightly connected,
Table 1. Module characteristics.
Biological Process Molecular Function Cellular Component
Module Antisense LincRNA Other lncRNA
Protein coding
Pseudogene GO term P value
GO term P value
GO term P value
brown 88 65 10 281 36 regulation of
immune system process 2.00E-05 signal transducer activity 5.50E-05 cytoplasmic side of membrane 0.00014
turquoise 87 35 10 672 66 mitotic cell
cycle
< 1e-30
DNA binding 3.30E-11
chromosomal part
<1e-30
yellow 50 44 6 306 53 cellular
response to stimulus 0.0011 ubiquitin protein ligase binding 0.021 plasma membrane region 0.00055
blue 100 36 13 638 73 ER-nucleus
signaling pathway 2.70E-21 aminoacyl-tRNA ligase activity 2.50E-05 endoplasmic reticulum 7.00E-30
red 36 30 5 205 29 organic
hydroxy compound metabolic process 1.50E-05 signal transducer activity 0.0016 integral component of plasma membrane 0.0016
green 58 27 8 389 91 immune
response 2.80E-06 signal transducer activity
0.0015 endosome 7.50E-07
doi:10.1371/journal.pone.0138236.t001
and many of the hub genes are well-characterized key players in cell cycle processes. Several lncRNAs show strong and highly significant correlation to the turquoise module eigengene (S1 Table). The lincRNA CRNDE is part of the turquoise module, but since it also exhibits moder-ate expression in plasmablasts and plasma cells, it is not centrally locmoder-ated in this module. Of note, CRNDE has been found to be up-regulated in several tumors, particularly neoplasms of blood and brain [66,67]. In addition, analysis of published array data on differentiating CD4 + T-cells has indicated that CRNDE expression decreases as cells differentiate from a progeni-tor stage to naive T-cells, suggesting that CRNDE is generally expressed during lymphocyte development [67,68]. A study of lincRNAs interacting with chromatin-modifying complexes showed direct interactions between CRNDE and PRC2 as well as CoREST, and that there is an overlap in genes affected by siRNA-mediated knockdown of CRNDE and PRC2, implying that CRNDE is involved in chromatin modification [69]. Interestingly, a recent study has linked CRNDE to regulation of central metabolism by showing that it promotes metabolic changes that switch cancer cells to aerobic glycolysis [70]. Many cells use aerobic glycolysis during rapid proliferation [71] and the expression of CRNDE in primarily pre-B1, -B2, and centro-blasts is consistent with its newly identified role as a metabolic regulator.
The germinal center. The yellow module consists of genes that are primarily expressed in
centrocytes and centroblasts or are absent or down-regulated in the germinal center (Fig 4B connectivity. Edge transparency and width encode gene pair adjacencies, with thicker lines and lower transparency meaning higher similarity.
doi:10.1371/journal.pone.0138236.g005
Fig 6. Antisense RNAs in the brown module center.A) Expression profiles and B) genomic organization of highly connected sense-antisense pairs from the brown module.
doi:10.1371/journal.pone.0138236.g006
Fig 7. Highly connected lincRNAs in the brown and yellow modules.A) Genome browser plot for the highly connected lincRNA CTC-436k13.6 in the brown module. The EvoFold track shows position of a highly conserved RNA secondary structure that overlaps the exon-intron boundary. PhastCons scores show conservation calculated from a 100 species genome-wide multiple sequence alignment. DNaseI hypersensitive region tracks show data from i) CD20+ B-cells, ii) CD14+ monocytes, iii) CD34
+ hematopoietic progenitor cells, and iv) Jurkat cell line. B) Expression profiles of RP11-132N15.3 and the nearby BCL6 gene. C) Visualization of the genomic region containing RP11-132N15.3 and BCL6.
andS2 Fig). GO analysis shows overrepresentation of genes assigned to‘cellular response to stimulus’,‘developmental process’, and‘regulation of G-protein coupled receptor protein sig-naling pathway‘(Table 1andS2 Table). The latter is used to annotate 7 different genes, includ-ing RGS13, which is important for regulatinclud-ing the responsiveness of B-cells to CXCL12 and -13 in the germinal center [72]. The module hub genes (Fig 5C) include AICDA and SERPINA9, which have been found to be expressed exclusively in germinal center B-cells and malignant cells derived from germinal center B-cells [73]. Similar to the brown module, we identified sev-eral lincRNAs among the hub genes (LINC00487, LINC00877, and RP11-203B7.2) (Fig 5C). Interestingly, we also found a lincRNA, designated as RP11-132N15.3, outside the immediate module center, which is predominantly expressed in centroblasts and to some extent in centro-cytes (Fig 7B). It is encoded on chromosome 3 approximately 240 kilobases upstream of BCL6 (Fig 7C). BCL6 is a master regulator of the germinal center reaction and modulates target genes in several different signaling pathways. These work together to increase the tolerance for DNA damage allowing genetic modifications of immunoglobulin genes, impair premature acti-vation of B cells, and block terminal differentiation of B cells to enable the development of high affinity antibodies [74]. The genomic region between BCL6 and RP11-132N15.3 contains another lincRNA, which was not considered in this study due to low expression levels, how-ever, analysis of the unfiltered data revealed an expression trend similar to RP11-132N15.3 (data not shown). To extend transcription profiling of this lincRNA, we explored phase 1 and phase 2 CAGE data from the FANTOM5 project and identified expression of RP11-132N15.3 in pools of normal human tonsil, corroborating our findings, and furthermore in the Burkitt's lymphoma cell lines RAJI and DAUDI, as well as hairy B cell lymphoma cell line MLMA. The four CAGE libraries showing expression of RP11-132N15.3 corresponded to 0.2% of all librar-ies analyzed, suggesting that this lincRNA is highly tissue-specific [75–77]. CAGE tags for the intervening lincRNA could also be identified in the same samples, albeit at lower levels, which is in agreement with our expression data.
Conclusion
While the intrinsic high levels of genomic instability during stages of B-cell development are necessary for the development of high affinity B-cells, they also carry an inherent risk of errors that can drive malignant transformation. Translocation, amplification, deletion, and mutation events can all lead to aberrant expression of factors that control proliferation, differentiation, and apoptosis [78]. Indeed, several malignant lymphomas have been found to originate from distinct stages of normal B-cell development, in particular the germinal center B-cells, and studies have revealed that events and factors that are of key importance to normal B-cell devel-opment are also important in lymphomagenesis (reviewed in refs [79–82]). Recent data implies that lncRNAs are important regulators of highly diverse biological processes and that their dys-regulation can be linked to the pathogenesis of cancer [83]. Thus, the identification of lncRNAs associated with distinct stages of B-cell development presented in this work will not only be an important resource for future work on exploring the molecular mechanisms underlying normal B-cell lymphopoiesis, but will also provide the basis for understanding the roles of lncRNAs in the pathogenesis and progression of B-cell malignancies.
Supporting Information
S1 Fig. Comparison of sample clustering based on specific gene biotype subtypes.Sample
clustering based on expression of protein-coding genes compared with sample clustering based on expression of lincRNAs (A) or antisense RNAs(B).
(PDF)
S2 Fig. Expression profiles of all identified gene co-expression modules.For each module, the module eigengene expression profile is shown below a heatmap of all genes in the module. (PDF)
S1 Table. Long noncoding RNAs associated with the identified gene co-expression
mod-ules.LncRNAs associated with the identified modules are listed along with Ensembl
annota-tions (ID, biotype, and genomic coordinates), summary of coding potential analysis (number of transcripts: number of transcript variants transcribed from gene; cpat.mean: average coding probability for all transcripts; cpat.max: coding probability of transcript with highest coding potential; cpat.range: range in coding probabilities of all transcripts), and correlation of gene expression to respective module eigengene (spear + p.val_s: Spearman’s correlation and P value; pear + p.val_p: Pearson’s correlation and P value).
(XLSX)
S2 Table. Overrepresented Gene Ontology terms in the identified gene co-expression
mod-ules.The top 10 overrepresented GO terms (p<0.01) in each of the identified gene
co-expres-sion module are listed. (XLSX)
Author Contributions
Conceived and designed the experiments: AP CAT SK. Performed the experiments: AS JSB. Analyzed the data: AP PHH. Contributed reagents/materials/analysis tools: KD MB HEJ. Wrote the paper: AP CAT SK.
References
1. Sauvageau M, Goff LA, Lodato S, Bonev B, Groff AF, Gerhardinger C, et al. Multiple knockout mouse models reveal lincRNAs are required for life and brain development. Elife. 2013; 2: e01749. doi:10. 7554/eLife.01749PMID:24381249
2. Ulitsky I, Shkumatava A, Jan CH, Sive H, Bartel DP. Conserved function of lincRNAs in vertebrate embryonic development despite rapid sequence evolution. Cell. 2011; 147: 1537–1550. doi:10.1016/j. cell.2011.11.055PMID:22196729
3. Guttman M, Donaghey J, Carey BW, Garber M, Grenier JK, Munson G, et al. lincRNAs act in the cir-cuitry controlling pluripotency and differentiation. Nature. 2011; 477: 295–300. doi:10.1038/ nature10398PMID:21874018
4. Klattenhoff CA, Scheuermann JC, Surface LE, Bradley RK, Fields PA, Steinhauser ML, et al. Brave-heart, a long noncoding RNA required for cardiovascular lineage commitment. Cell. 2013; 152: 570– 583. doi:10.1016/j.cell.2013.01.003PMID:23352431
5. Huarte M, Guttman M, Feldser D, Garber M, Koziol MJ, Kenzelmann-Broz D, et al. A large intergenic noncoding RNA induced by p53 mediates global gene repression in the p53 response. Cell. 2010; 142: 409–419. doi:10.1016/j.cell.2010.06.040PMID:20673990
6. Yang L, Lin C, Jin C, Yang JC, Tanasa B, Li W, et al. lncRNA-dependent mechanisms of androgen-receptor-regulated gene activation programs. Nature. 2013; 500: 598–602. doi:10.1038/nature12451 PMID:23945587
7. Trimarchi T, Bilal E, Ntziachristos P, Fabbri G, Dalla-Favera R, Tsirigos A, et al. Genome-wide mapping and characterization of Notch-regulated long noncoding RNAs in acute leukemia. Cell. 2014; 158: 593– 606. doi:10.1016/j.cell.2014.05.049PMID:25083870
8. Gutschner T, Hämmerle M, Eissmann M, Hsu J, Kim Y, Hung G, et al. The noncoding RNA MALAT1 is a critical regulator of the metastasis phenotype of lung cancer cells. Cancer Res. 2013; 73: 1180–1189. doi:10.1158/0008-5472.CAN-12-2850PMID:23243023
10. Gomez JA, Wapinski OL, Yang YW, Bureau J-F, Gopinath S, Monack DM, et al. The NeST Long ncRNA Controls Microbial Susceptibility and EpigeneticActivation of the Interferon-g Locus. Cell. Else-vier Inc; 2013; 152: 743–754. doi:10.1016/j.cell.2013.01.015
11. Yap KL, Li S, Muñoz-Cabello AM, Raguz S, Zeng L, Mujtaba S, et al. Molecular interplay of the
noncod-ing RNA ANRIL and methylated histone H3 lysine 27 by polycomb CBX7 in transcriptional silencnoncod-ing of INK4a. Mol Cell. 2010; 38: 662–674. doi:10.1016/j.molcel.2010.03.021PMID:20541999
12. Rinn JL, Chang HY. Genome regulation by long noncoding RNAs. Annu Rev Biochem. 2012; 81: 145– 166. doi:10.1146/annurev-biochem-051410-092902PMID:22663078
13. Pelechano V, Steinmetz LM. Gene regulation by antisense transcription. Nat Rev Genet. 2013; 14: 880–893. doi:10.1038/nrg3594PMID:24217315
14. Faghihi MA, Wahlestedt C. Regulatory roles of natural antisense transcripts. Nat Rev Mol Cell Biol. 2009; 10: 637–643. doi:10.1038/nrm2738PMID:19638999
15. Guttman M, Rinn JL. Modular regulatory principles of large non-coding RNAs. Nature. 2012; 482: 339– 346. doi:10.1038/nature10887PMID:22337053
16. Wang KC, Chang HY. Molecular Mechanisms of Long Noncoding RNAs. Mol Cell. 2011; 43: 904–914. doi:10.1016/j.molcel.2011.08.018PMID:21925379
17. Mercer TR, Mattick JS. Structure and function of long noncoding RNAs in epigenetic regulation. Nat Struct Mol Biol. 2013; 20: 300–307. doi:10.1038/nsmb.2480PMID:23463315
18. Rinn JL, Kertesz M, Wang JK, Squazzo SL, Xu X, Brugmann SA, et al. Functional demarcation of active and silent chromatin domains in human HOX loci by noncoding RNAs. Cell. 2007; 129: 1311–1323. doi:10.1016/j.cell.2007.05.022PMID:17604720
19. Dimitrova N, Zamudio JR, Jong RM, Soukup D, Resnick R, Sarma K, et al. LincRNA-p21 activates p21 in cis to promote Polycomb target gene expression and to enforce the G1/S checkpoint. Mol Cell. 2014; 54: 777–790. doi:10.1016/j.molcel.2014.04.025PMID:24857549
20. Poliseno L, Salmena L, Zhang J, Carver B, Haveman WJ, Pandolfi PP. A coding-independent function of gene and pseudogene mRNAs regulates tumour biology. Nature. 2010; 465: 1033–1038. doi:10. 1038/nature09144PMID:20577206
21. Schatz DG, Ji Y. Recombination centres and the orchestration of V(D)J recombination. Nat Rev Immu-nol. 2011; 11: 251–263. doi:10.1038/nri2941PMID:21394103
22. Muramatsu M, Kinoshita K, Fagarasan S, Yamada S, Shinkai Y, Honjo T. Class switch recombination and hypermutation require activation-induced cytidine deaminase (AID), a potential RNA editing enzyme. Cell. 2000; 102: 553–563. PMID:11007474
23. Phan RT, Dalla-Favera R. The BCL6 proto-oncogene suppresses p53 expression in germinal-centre B cells. Nature. 2004; 432: 635–639. doi:10.1038/nature03147PMID:15577913
24. Matthias P, Rolink AG. Transcriptional networks in developing and mature B cells. Nat Rev Immunol. 2005; 5: 497–508. doi:10.1038/nri1633PMID:15928681
25. de Yébenes VG, Bartolomé-Izquierdo N, Ramiro AR. Regulation of B-cell development and function by microRNAs. Immunol Rev. 2013; 253: 25–39. doi:10.1111/imr.12046PMID:23550636
26. Bolland DJ, Wood AL, Johnston CM, Bunting SF, Morgan G, Chakalova L, et al. Antisense intergenic transcription in V(D)J recombination. Nat Immunol. 2004; 5: 630–637. doi:10.1038/ni1068PMID: 15107847
27. Featherstone K, Wood AL, Bowen AJ, Corcoran AE. The mouse immunoglobulin heavy chain V-D intergenic sequence contains insulators that may regulate ordered V(D)J recombination. J Biol Chem. 2010; 285: 9327–9338. doi:10.1074/jbc.M109.098251PMID:20100833
28. Atianand MK, Fitzgerald KA. Long non-coding RNAs and control of gene expression in the immune sys-tem. Trends Mol Med. 2014; 20: 623–631. doi:10.1016/j.molmed.2014.09.002PMID:25262537 29. Dai M, Wang P, Boyd AD, Kostov G, Athey B, Jones EG, et al. Evolving gene/transcript definitions
sig-nificantly alter the interpretation of GeneChip data. Nucleic Acids Res. 2005; 33: e175. doi:10.1093/ nar/gni179PMID:16284200
30. Langfelder P, Horvath S. WGCNA: an R package for weighted correlation network analysis. BMC Bioin-formatics. 2008; 9: 559. doi:10.1186/1471-2105-9-559PMID:19114008
31. Kjeldsen MK, Perez-Andres M, Schmitz A, Johansen P, Boegsted M, Nyegaard M, et al. Multipara-metric flow cytometry for identification and fluorescence activated cell sorting of five distinct B-cell sub-populations in normal tonsil tissue. Am J Clin Pathol. 2011; 136: 960–969. doi:10.1309/
AJCPDQNP2U5DZHVVPMID:22095383
32. Bergkvist KS, Nyegaard M, Bøgsted M, Schmitz A, Bødker JS, Rasmussen SM, et al. Validation and
implementation of a method for microarray gene expression profiling of minor B-cell subpopulations in man. BMC Immunol. 2014; 15: 3. doi:10.1186/1471-2172-15-3PMID:24483235
33. R Core Team. R: A Language and Environment for Statistical Computing [Internet]. 3rd ed. Vienna, Austria; 2014. Available:http://www.R-project.org/.
34. Gentleman RC, Carey VJ, Bates DM, Bolstad B, Dettling M, Dut S, et al. Bioconductor: open software development for computational biology and bioinformatics. Genome Biol. 2004; 5: R80. doi:10.1186/ gb-2004-5-10-r80PMID:15461798
35. Shannon P, Markiel A, Ozier O, Baliga NS, Wang JT, Ramage D, et al. Cytoscape: a software environ-ment for integrated models of biomolecular interaction networks. Genome Res. 2003; 13: 2498–2504. doi:10.1101/gr.1239303PMID:14597658
36. Irizarry RA, Hobbs B, Collin F, Beazer-Barclay YD, Antonellis KJ, Scherf U, et al. Exploration, normali-zation, and summaries of high density oligonucleotide array probe level data. Biostatistics. 2003; 4: 249–264. doi:10.1093/biostatistics/4.2.249PMID:12925520
37. Flicek P, Amode MR, Barrell D, Beal K, Billis K, Brent S, et al. Ensembl 2014. Nucleic Acids Res. 2014; 42: D749–55. doi:10.1093/nar/gkt1196PMID:24316576
38. Wang L, Park HJ, Dasari S, Wang S, Kocher J-P, Li W. CPAT: Coding-Potential Assessment Tool using an alignment-free logistic regression model. Nucleic Acids Res. 2013; 41: e74. doi:10.1093/nar/ gkt006PMID:23335781
39. Duda RO, Hart PE, Stork DG. Pattern classification. 2nd ed. Wiley-Interscience; 2001.
40. Galili T. dendextend: an R package for visualizing, adjusting and comparing trees of hierarchical clus-tering. Bioinformatics. 2015. doi:10.1093/bioinformatics/btv428
41. Sandberg R, Larsson O. Improved precision and accuracy for microarrays using updated probe set def-initions. BMC Bioinformatics. 2007; 8: 48. doi:10.1186/1471-2105-8-48PMID:17288599
42. Allende ML, Tuymetova G, Lee BG, Bonifacino E, Wu Y-P, Proia RL. S1P1 receptor directs the release of immature B cells from bone marrow into blood. J Exp Med. 2010; 207: 1113–1124. doi:10.1084/jem. 20092210PMID:20404103
43. Matloubian M, Lo CG, Cinamon G, Lesneski MJ, Xu Y, Brinkmann V, et al. Lymphocyte egress from thymus and peripheral lymphoid organs is dependent on S1P receptor 1. Nature. 2004; 427: 355–360. doi:10.1038/nature02284PMID:14737169
44. Lin K-I, Angelin-Duclos C, Kuo TC, Calame K. Blimp-1-dependent repression of Pax-5 is required for differentiation of B cells to immunoglobulin M-secreting plasma cells. Molecular and Cellular Biology. 2002; 22: 4771–4780. PMID:12052884
45. Shaffer AL, Shapiro-Shelef M, Iwakoshi NN, Lee A-H, Qian S-B, Zhao H, et al. XBP1, downstream of Blimp-1, expands the secretory apparatus and other organelles, and increases protein synthesis in plasma cell differentiation. Immunity. 2004; 21: 81–93. doi:10.1016/j.immuni.2004.06.010PMID: 15345222
46. Cabili MN, Trapnell C, Goff L, Koziol M, Tazon-Vega B, Regev A, et al. Integrative annotation of human large intergenic noncoding RNAs reveals global properties and specific subclasses. Genes Dev. 2011; 25: 1915–1927. doi:10.1101/gad.17446611PMID:21890647
47. Derrien T, Johnson R, Bussotti G, Tanzer A, Djebali S, Tilgner H, et al. The GENCODE v7 catalog of human long noncoding RNAs: analysis of their gene structure, evolution, and expression. Genome Res. 2012; 22: 1775–1789. doi:10.1101/gr.132159.111PMID:22955988
48. Guil S, Esteller M. Cis-acting noncoding RNAs: friends and foes. Nat Struct Mol Biol. 2012; 19: 1068– 1075. doi:10.1038/nsmb.2428PMID:23132386
49. Ørom UA, Derrien T, Beringer M, Gumireddy K, Gardini A, Bussotti G, et al. Long noncoding RNAs with enhancer-like function in human cells. Cell. 2010; 143: 46–58. doi:10.1016/j.cell.2010.09.001PMID: 20887892
50. Necsulea A, Soumillon M, Warnefors M, Liechti A, Daish T, Zeller U, et al. The evolution of lncRNA rep-ertoires and expression patterns in tetrapods. Nature. 2014; 505: 635–640. doi:10.1038/nature12943 PMID:24463510
51. Guttman M, Amit I, Garber M, French C, Lin MF, Feldser D, et al. Chromatin signature reveals over a thousand highly conserved large non-coding RNAs in mammals. Nature. 2009; 458: 223–227. doi:10. 1038/nature07672PMID:19182780
52. Liao Q, Liu C, Yuan X, Kang S, Miao R, Xiao H, et al. Large-scale prediction of long non-coding RNA functions in a coding-non-coding gene co-expression network. Nucleic Acids Res. 2011; 39: 3864– 3878. doi:10.1093/nar/gkq1348PMID:21247874
53. Alter O, Brown PO, Botstein D. Singular value decomposition for genome-wide expression data pro-cessing and modeling. Proc Natl Acad Sci USA. 2000; 97: 10101–10106. PMID:10963673 54. Peschon JJ, Morrissey PJ, Grabstein KH, Ramsdell FJ, Maraskovsky E, Gliniak BC, et al. Early
55. Holmes ML, Carotta S, Corcoran LM, Nutt SL. Repression of Flt3 by Pax5 is crucial for B-cell lineage commitment. Genes Dev. 2006; 20: 933–938. doi:10.1101/gad.1396206PMID:16618805
56. Reya T, O'Riordan M, Okamura R, Devaney E, Willert K, Nusse R, et al. Wnt signaling regulates B lym-phocyte proliferation through a LEF-1 dependent mechanism. Immunity. 2000; 13: 15–24. PMID: 10933391
57. Thomas MD, Kremer CS, Ravichandran KS, Rajewsky K, Bender TP. c-Myb is critical for B cell devel-opment and maintenance of follicular B cells. Immunity. 2005; 23: 275–286. doi:10.1016/j.immuni. 2005.08.005PMID:16169500
58. Schwickert TA, Tagoh H, Gültekin S, Dakic A, Axelsson E, Minnich M, et al. Stage-specific control of early B cell development by the transcription factor Ikaros. Nat Immunol. 2014; 15: 283–293. doi:10. 1038/ni.2828PMID:24509509
59. Zandi S, Mansson R, Tsapogas P, Zetterblad J, Bryder D, Sigvardsson M. EBF1 is essential for B-line-age priming and establishment of a transcription factor network in common lymphoid progenitors. J Immunol. 2008; 181: 3364–3372. PMID:18714008
60. Siepel A, Bejerano G, Pedersen JS, Hinrichs AS, Hou M, Rosenbloom K, et al. Evolutionarily conserved elements in vertebrate, insect, worm, and yeast genomes. Genome Res. 2005; 15: 1034–1050. doi:10. 1101/gr.3715005PMID:16024819
61. Kent WJ, Sugnet CW, Furey TS, Roskin KM, Pringle TH, Zahler AM, et al. The human genome browser at UCSC. Genome Res. 2002; 12: 996–1006. doi:10.1101/gr.229102PMID:12045153
62. Pedersen JS, Bejerano G, Siepel A, Rosenbloom K, Lindblad-Toh K, Lander ES, et al. Identification and classification of conserved RNA secondary structures in the human genome. PLoS Comput Biol. 2006; 2: e33. doi:10.1371/journal.pcbi.0020033PMID:16628248
63. Shepard PJ, Hertel KJ. Conserved RNA secondary structures promote alternative splicing. RNA. 2008; 14: 1463–1469. doi:10.1261/rna.1069408PMID:18579871
64. Carninci P, Kasukawa T, Katayama S, Gough J, Frith MC, Maeda N, et al. The transcriptional land-scape of the mammalian genome. Science. 2005; 309: 1559–1563. doi:10.1126/science.1112014 PMID:16141072
65. Herzog S, Reth M, Jumaa H. Regulation of B-cell proliferation and differentiation by pre-B-cell receptor signalling. Nat Rev Immunol. 2009; 9: 195–205. doi:10.1038/nri2491PMID:19240758
66. Graham LD, Pedersen SK, Brown GS, Ho T, Kassir Z, Moynihan AT, et al. Colorectal Neoplasia Differ-entially Expressed (CRNDE), a Novel Gene with Elevated Expression in Colorectal Adenomas and Adenocarcinomas. Genes Cancer. 2011; 2: 829–840. doi:10.1177/1947601911431081PMID: 22393467
67. Ellis BC, Molloy PL, Graham LD. CRNDE: A Long Non-Coding RNA Involved in CanceR, Neurobiology, and DEvelopment. Front Gene. 2012; 3: 270. doi:10.3389/fgene.2012.00270
68. Lee MS, Hanspers K, Barker CS, Korn AP, McCune JM. Gene expression profiles during human CD4+ T cell differentiation. Int Immunol. 2004; 16: 1109–1124. doi:10.1093/intimm/dxh112PMID:15210650 69. Khalil AM, Guttman M, Huarte M, Garber M, Raj A, Rivea Morales D, et al. Many human large intergenic
noncoding RNAs associate with chromatin-modifying complexes and affect gene expression. Proc Natl Acad Sci USA. 2009; 106: 11667–11672. doi:10.1073/pnas.0904715106PMID:19571010
70. Ellis BC, Graham LD, Molloy PL. CRNDE, a long non-coding RNA responsive to insulin/IGF signaling, regulates genes involved in central metabolism. Biochim Biophys Acta. 2014; 1843: 372–386. doi:10. 1016/j.bbamcr.2013.10.016PMID:24184209
71. Lunt SY, Vander Heiden MG. Aerobic glycolysis: meeting the metabolic requirements of cell prolifera-tion. Annu Rev Cell Dev Biol. 2011; 27: 441–464. doi:10.1146/annurev-cellbio-092910-154237PMID: 21985671
72. Shi G-X, Harrison K, Wilson GL, Moratz C, Kehrl JH. RGS13 regulates germinal center B lymphocytes responsiveness to CXC chemokine ligand (CXCL)12 and CXCL13. J Immunol. 2002; 169: 2507–2515. PMID:12193720
73. Frazer JK, Jackson DG, Gaillard JP, Lutter M, Liu YJ, Banchereau J, et al. Identification of centerin: a novel human germinal center B cell-restricted serpin. Eur J Immunol. 2000; 30: 3039–3048. doi:10. 1002/1521-4141(200010)30:10<3039::AID-IMMU3039>3.0.CO;2-HPMID:11069088
74. Basso K, Dalla-Favera R. Germinal centres and B cell lymphomagenesis. Nat Rev Immunol. 2015; 15: 172–184. doi:10.1038/nri3814PMID:25712152
75. Arner E, Daub CO, Vitting-Seerup K, Andersson R, Lilje B, Drabløs F, et al. Transcribed enhancers
lead waves of coordinated transcription in transitioning mammalian cells. Science. 2015; 347: 1010– 1014. doi:10.1126/science.1259418PMID:25678556
76. FANTOM Consortium and the RIKEN PMI and CLST (DGT), Forrest ARR, Kawaji H, Rehli M, Baillie JK, de Hoon MJL, et al. A promoter-level mammalian expression atlas. Nature. 2014; 507: 462–470. doi:10.1038/nature13182PMID:24670764
77. Andersson R, Gebhard C, Miguel-Escalada I, Hoof I, Bornholdt J, Boyd M, et al. An atlas of active enhancers across human cell types and tissues. Nature. 2014; 507: 455–461. doi:10.1038/ nature12787PMID:24670763
78. Robbiani DF, Bothmer A, Callen E, Reina-San-Martin B, Dorsett Y, Difilippantonio S, et al. AID is required for the chromosomal breaks in c-myc that lead to c-myc/IgH translocations. Cell. 2008; 135: 1028–1038. doi:10.1016/j.cell.2008.09.062PMID:19070574
79. Lenz G, Staudt LM. Aggressive lymphomas. N Engl J Med. 2010; 362: 1417–1429. doi:10.1056/ NEJMra0807082PMID:20393178
80. Allen CDC, Okada T, Cyster JG. Germinal-center organization and cellular dynamics. Immunity. 2007; 27: 190–202. doi:10.1016/j.immuni.2007.07.009PMID:17723214
81. Küppers R. Mechanisms of B-cell lymphoma pathogenesis. Nat Rev Cancer. 2005; 5: 251–262. doi: 10.1038/nrc1589PMID:15803153
82. Dybkaer K, Bøgsted M, Falgreen S, Bødker JS, Kjeldsen MK, Schmitz A, et al. Diffuse Large B-Cell
Lymphoma Classification System That Associates Normal B-Cell Subset Phenotypes With Prognosis. J Clin Oncol. 2015. doi:10.1200/JCO.2014.57.7080