Partial Hepatectomy Induced Long
Noncoding RNA Inhibits Hepatocyte
Proliferation during Liver Regeneration
Lulu Huang, Sagar S. Damle, Sheri Booten, Priyam Singh, Mahyar Sabripour, Jeff Hsu, Minji Jo, Melanie Katz, Andy Watt, Christopher E. Hart, Susan M. Freier, Brett P. Monia, Shuling Guo*
Department of Antisense Drug Discovery, Isis Pharmaceuticals Inc., Carlsbad, CA, 92010, United States of America
Abstract
Liver regeneration after partial hepatectomy (PHx) is a complex and well-orchestrated bio-logical process in which synchronized cell proliferation is induced in response to the loss of liver mass. To define long noncoding RNAs (lncRNAs) that participate in the regulation of liver regeneration, we performed microarray analysis and identified more than 400 lncRNAs exhibiting significantly altered expression. Of these, one lncRNA,LncPHx2(Long noncod-ing RNA induced by PHx 2), was highly upregulated durnoncod-ing liver regeneration. Depletion of LncPHx2during liver regeneration using antisense oligonucleotides led to a transient increase in hepatocyte proliferation and more rapid liver regeneration. Gene expression analysis showed thatLncPHx2depletion resulted in upregulation of mRNAs encoding pro-teins known to promote cell proliferation, including MCM components, DNA polymerases, histone proteins, and transcription factors.LncPHx2interacts with the mRNAs of MCM com-ponents, making it a candidate to regulate the expression of MCMs and other genes post-transcriptionally. Collectively, our data demonstrate that LncPHx2 is a key lncRNA that par-ticipates in a negative feedback loop modulating hepatocyte proliferation through RNA-RNA interactions.
Introduction
Although long noncoding RNAs (lncRNAs) such asH19andXistwere first discovered decades ago, only in the last few years have the advances in transcriptome sequencing technologies led to the discovery of thousands of previously unannotated lncRNAs [1,2]. A recent update by the GENCODE consortium annotated 9,277 lncRNA genes that result in 14,880 transcripts [3]. Currently, lncRNAs are defined by two features: 1) the transcript is longer than 200 nucleo-tides and 2) does not appear to have coding potential. The first criterion of length is arbitrary and based on the purification method. Essentially, these RNAs are defined by what they are not rather than their function [2]. LncRNAs are often expressed in a tissue- and developmental
OPEN ACCESS
Citation:Huang L, Damle SS, Booten S, Singh P, Sabripour M, Hsu J, et al. (2015) Partial Hepatectomy Induced Long Noncoding RNA Inhibits Hepatocyte Proliferation during Liver Regeneration. PLoS ONE 10(7): e0132798. doi:10.1371/journal.pone.0132798
Editor:Zhuang Zuo, UT MD Anderson Cancer Center, UNITED STATES
Received:May 2, 2015
Accepted:June 19, 2015
Published:July 24, 2015
Copyright:© 2015 Huang et al. This is an open access article distributed under the terms of the
Creative Commons Attribution License, which permits unrestricted use, distribution, and reproduction in any medium, provided the original author and source are credited.
Data Availability Statement:Data were deposited in the Gene Expression Omnibus (Accession no. GSE70343).
stage-specific manner [1,4], and levels of many are altered in disease states [5,6]. Some lncRNAs have been shown to be essential for life and development, such asXist[7],Fendrr[8, 9], andBraveheart[10]; others play important roles during disease progression [5], such as Malat1[11–14] andPvt1[15]. Initially, it was thought that the main function of lncRNAs is to regulate transcription through influencing the epigenetic status of the chromatin [16]. More recently, however, lncRNAs that regulate almost every step of gene expression, including RNA processing, RNA stability, and translation, have been identified [2]. Yet the functions of most lncRNAs are unknown.
Previous studies have implicated lncRNAs in the regulation of cell proliferation [17]. To fur-ther understand the roles of lncRNAs in cell proliferation, we analysed lncRNA expression in a mouse two-thirds partial hepatectomy (PHx) liver regeneration model [18]. Liver regeneration after PHx is a very complex and well-controlled process, and requires participation of all mature liver cell types with hepatocytes being the main players [19–23]. Immediately following surgery, growth factors and cytokines work together to induce mature hepatocytes to re-enter cell cycle, which in turn triggers cell proliferation of the other cell types in the liver. Within 72 hours, hepatocytes complete 1 to 2 rounds of synchronized proliferation, and liver mass and function is fully restored in approximately 10 days. Liver mass is precisely controlled, as there is no over growth of the liver in response to PHx. A cascade of robust transcription regulation triggered by cytokine and growth factor signalling regulates this well orchestrated biological process [22,24]. We performed genome-wide gene expression profiling to identify lncRNA expression changes during liver regeneration after PHx. We found that approximately 400 lncRNAs were differentially expressed after PHx. Interestingly, one lncRNA,LncPHx2, whose expression is induced after PHx, was shown to negatively regulate hepatocyte proliferation through inhibition of the genes that promote cell growth.
Materials and Methods
Animal experiments
PHx was performed as described before [18]. In brief, male Balb/c mice (Charles River Labora-tories), 7~9 weeks of age were under isofluorane anesthesia (2% in air restrainer for induction and 1–2% via nose cone for maintenance). Left literal lobe and median lobe of the liver were removed with two separate ligatures. For experiments involving antisense oligonucleotide (ASO) treatment, mice were injected subcutaneously with LncPHx2_ASOs, control ASO, or PBS as indicated in the main text. The DEN-induced mouse HCC model was previously described [25]. In brief, male C57BL/6 mice, 15 days of age, were injected intraperitoneal with 25 mg/kg diethylnitrosamine (DEN, Sigma). A pool of DEN-injected BL/6 mice was main-tained for 8 months to allow tumor formation, and then treated subcutaneously with ASOs or control reagents for 3 months before sacrificing and data collection. Animals were euthanized by exsanguination under Isoflurane inhalation followed by cervical dislocation. All animal hus-bandry and procedures were approved by the Institutional Animal Care and Use Committee at Isis Pharmaceuticals.
Microarrays, RNA sequencing, and data analysis
Genome-wide profiling of mRNA and lncRNA expression changes during liver regeneration were performed using the NCode Mouse Non-coding RNA Microarray (Invitrogen). Data were normalized for intensity dependent variance using the vsn package (Bioconductor). Dif-ferentially expressed genes were identified and clustered using the maSigPro (microarray Sig-nificant Profiles) R-package. A two-step regression were performed to first identify
significantly differentially expressed genes (FDR = 0.05), and then to identify the conditions Competing Interests:The authors LH, SSD, SB,
that show statistically significant differences (alfa = 0.05, regression step = two.ways.backward). Genes were further filtered by goodness of fit gene profiles against gene regression models (R-squared>= 0.6), then aggregated into 9 clusters using hclust [26,27]. To identify LncPHx2-regulated genes, mouse liver RNAs were analysed using Illumina True-seq protocol. Reads were processed using STAR [28]. Differential gene expression calls were made using cuffdiff [29]. GSEA analysis was done with pre-ranked gene list by expression [30].
Antisense oligonucleotides
Antisense oligonucleotides used in this study were chemically modified with phosphorothioate in the backbone and constrained ethyl (cET) modifications in the wings with a central
10-nucleotide deoxy gap (3-10-3 gapmer). Oligonucleotides were synthesized using an Applied Biosystems 380B automated DNA synthesizer (PerkinElmer Life and Analytical Sciences, Applied Biosystems) and purified as previously described [31,32]. ASO sequences are as fol-low: control ASO, 3-10-3 cET gapmer,5’- GGCTACTACGCCGTCA-3’; LncPHx2_ASO1,
3-10-3 cET gapmer,5’-AACTTCAAGTAACAGG-3’; LncPHx2_ASO2, 3-10-3 cET gapmer,
5’-AGGCATAACTTCAAGT-3’.
Cell culture and transfection
Mouse cell lines MHT [33], BNL.CL2 (ATCC) and Hepa1-6 (ATCC) were cultured in DMEM containing 1% L-glutamine, 10% fetal bovine serum, and 100 units/ml penicillin/streptomycin in 5% CO2at 37°C. ASOs were added to the culture media 5–12 hours after seeding cells at the indicated concentrations. Cells were harvest 48 hours after ASO-treatment.
Plasma chemistry analysis
Blood samples were collected by cardiac puncture at time of sacrifice. Plasma chemistry values were measured on the AU480 Clinical Chemistry Analyzer (Beckman Coulter).
RNA analysis
Cultured cells were lysed and the total RNA was extracted with Qiagen RNeasy columns. Ani-mal tissues were homogenized in guanidine isothiocyanate solution (Invitrogen) supplemented with 8% 2-mercaptoethanol (Sigma-Aldrich). Total RNA was prepared using the Qiagen RNeasy columns. Quantitative real-time PCR (qRT-PCR) was performed using an ABI step-one sequence detector. Primer probe sequences are as follow: LncPHx1, forward,5’
-TGGATTTGGAAGCTTTGAGTGA-3’, reverse,5’-CGTCTTTTCTCGGTGCTTGAT-3’, probe,
5’-FAM-CAGACACATGTTCCTCTTCCTCCTGCTCAX-TAMRA-3’; LncPHx2, forward,5’ -TGTTGCAGTGTGGTCCAGAGA-3’, reverse,5’- CTGCTTCTTCTTCAGCAATGGAT-3’, probe,5’-FAM- AGCCAGCCTTTTTGCTGTGGATCCCX-TAMRA-3’; LncPHx3, forward, 5’- GCACAGCACACTCAGAATTACAAA-3’, reverse,5’- CCGCCTTTAATCCTAGCACTTG-3’, probe,5’-FAM- ATGTATCCCTGGCTGGCTTGTAACCCAX-TAMRA-3’; LncPHx4,
internal ZEN) -3’, Gapdh, forward,5’-GGCAAATTCAACGGCACAGT-3’, reverse,5’ -GGGTCTCGCTCCTGGAAGAT-3’, probe,5’-FAM- AAGGCCGAGAATGGGAAGCTTGT CATCX-TAMRA-3’. Taqman assay for Ccne1 (Mm00432367_m1), Mcm3
(Mm00801872_m1), Aurkb (Mm01718146_g1), Ccnb1 (Mm03053893_gH), and Rbl1 (Mm01250721_m1) were purchased from life technologies.
Histological analysis
Animal tissues were collected, fixed in 10% buffered formalin, and paraffin embedded. Immu-nohistochemical analyses were performed using a Ki67-specific antibody (Thermo RM-9106-S) following manufacturer’s protocols. BrdU (Life Technologies, 00–0103) labelling was detected using BrdUin situdetection kit (BD, 550803). Single molecule RNAin situ hybridiza-tion was done using QuantiGene ViewRNA Assays (Affymetrix) following manufacturer's instructions.
RNA interactome analysis
TGGTTCGGATAATGCGAACA-3’; #7,5’- ATTTGATCCAGCGATACAGC-3’. Enrichment peaks were identified as described [34] with the following modifications. Coverage was computed at each position in the genome and an enrichment score (EScore) was calculated by computing the minimum coverage, scaled by number of mapped reads, between independently selected pull-down probe sets. Instead of an input sample, the minimum coverage score was normalized to lacZ probe set coverage to select against non-specific pull-down peaks. Adjacent EScores were merged using bedtools, and a mean EScore was determined. The average log2(EScore) and standard deviation of log2 (EScore) were 0.285 and 0.410, respectively. These regions had a minimum log2 (EScore) of 2, which corresponded to an enrichment greater than 4 standard deviations above the mean. The top 500 EScore regions were used in ade novomotif search in MEME [35]. To ensure that input peak sequences were not limited by narrow peak boundaries, the minimum input length was fixed at 100 bp (i.e., 50 bp flanking the peak centre). Reverse motif search using MAST was performed against the gene transcripts differentially expressed upon treatment with
LncPHx2_ASO1, using unchanged gene transcripts as control [36].
Statistics
Tow-tailed independent Student’s t test was used for statistical analysis in this study.
Results
Genome-wide lncRNA expression profiling during mouse liver
regeneration after 2/3 PHx
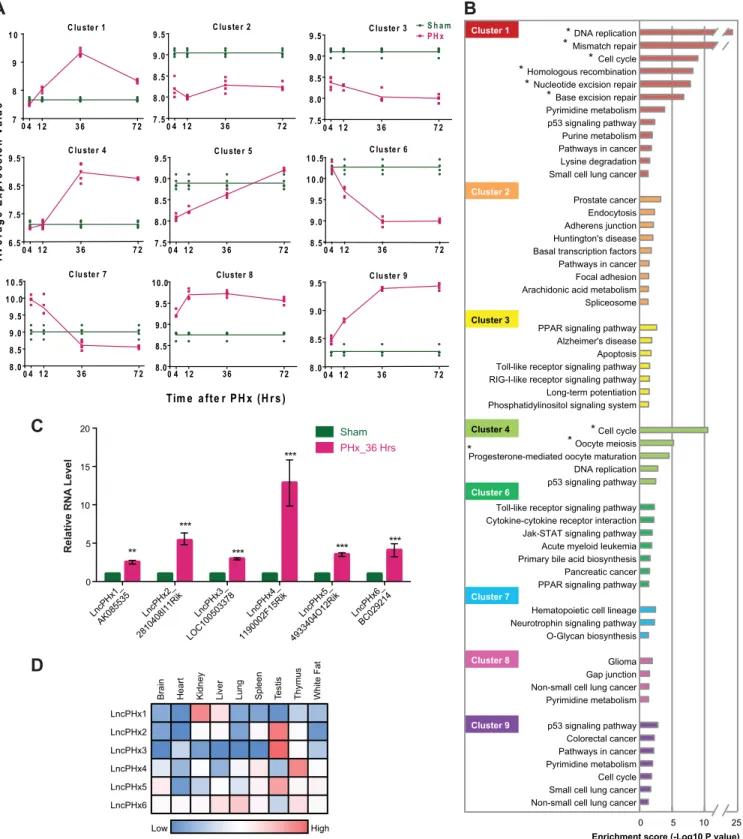
To identify lncRNAs that regulate cell proliferation during liver regeneration, we analysed lncRNA expression profiles in mouse liver tissue collected at 4, 12, 36, and 72 hours after PHx as synchronized hepatocyte proliferation occurs during this time window [37]. Analysis using the NCode Mouse Non-coding RNA Microarray (Invitrogen) revealed that 3653 mRNAs and 465 putative lncRNAs were differentially expressed compared to transcripts isolated from livers of control sham operated mice. Differentially expressed genes were categorized into nine clus-ters based on their expression patterns after PHx (Fig 1AandS1 Table). Clusters 1, 4, 8, and 9 contain genes that were significantly upregulated after PHx. Clusters 2, 3, and 6 contain genes that were significantly downregulated. Clusters 5 and 7 contain genes that were down- (cluster 5) or up- (cluster 7) regulated immediately after PHx and then the reverse at later time points. KEGG pathway analysis was performed on the coding genes in each cluster. We found that clusters 1and 4 were significantly enriched in genes regulating cell-cycle and cell proliferation (Fig 1B). We hypothesized that the lncRNAs within these two clusters might also affect cell-cycle and cell proliferation and, therefore, focused on the lncRNAs within these two clusters.
To study the functions of these lncRNAs, we designed antisense oligonucleotides (ASOs) to deplete them in cell culture and in vivo. We found that one lncRNA,LncPHx2, regulates hepa-tocyte proliferation in liver regeneration after PHx.
LncPHx2
is highly induced during liver regeneration
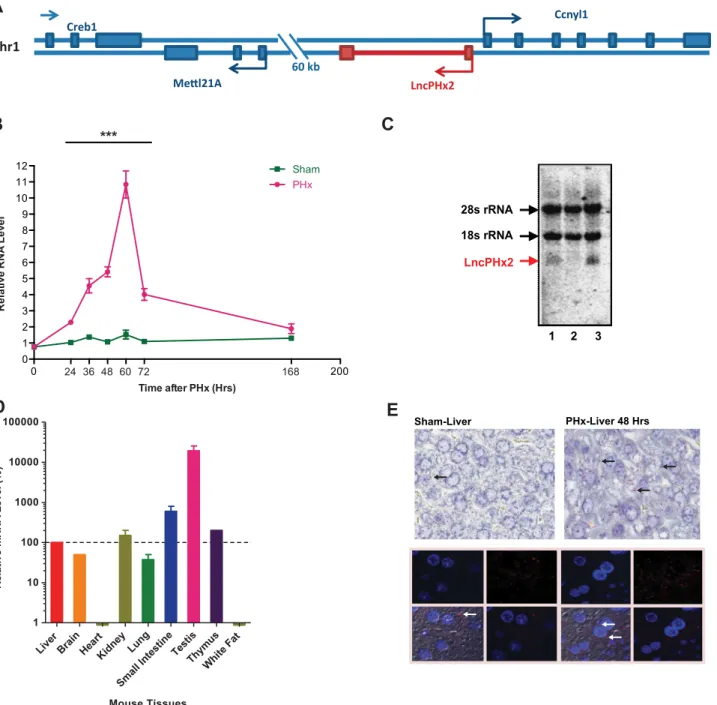
LncPHx2(2810408I11Rik) from cluster 1, located on chromosome 1, is in proximity (553 bp upstream) in the antisense direction to a coding gene with unknown function, Cyclin Y like 1 (Ccnyl1) (Fig 2A).LncPHx2is highly upregulated during the hepatocyte proliferation stage of liver regeneration, between 24 and 72 hours after PHx, with peak expression observed at 60 hours after PHx (Fig 2B). Its neighbour geneCcnyl1was slightly upregulated during liver regeneration (categorized in cluster 8) (S1 Fig). Three isoforms have been reported for the LncPHx2locus in Ensembl Genome Browser (S1 Fig); but only the 713-bp transcript (AK013046) could be cloned and detected by qPCR and by northern blot from mouse liver extracts (Fig 2B and 2C).LncPHx2was expressed in many mouse tissues with the highest expression detected in mouse testis (Fig 2D), confirming the Encode mouse tissue expression data (Fig 1D). Single molecule RNA in situhybridization showed thatLncPHx2transcripts were localized mainly in the cytoplasm of hepatocytes in mouse liver (Fig 2E).LncPHx2RNA was also detected mainly in the cytoplasmic rather than the nuclear fraction in the cultured hepatocyte cell lines MHT and BNL.CL2 (S1 Figand data not shown).
LncPHx2
regulates hepatocyte proliferation during liver regeneration
after PHx
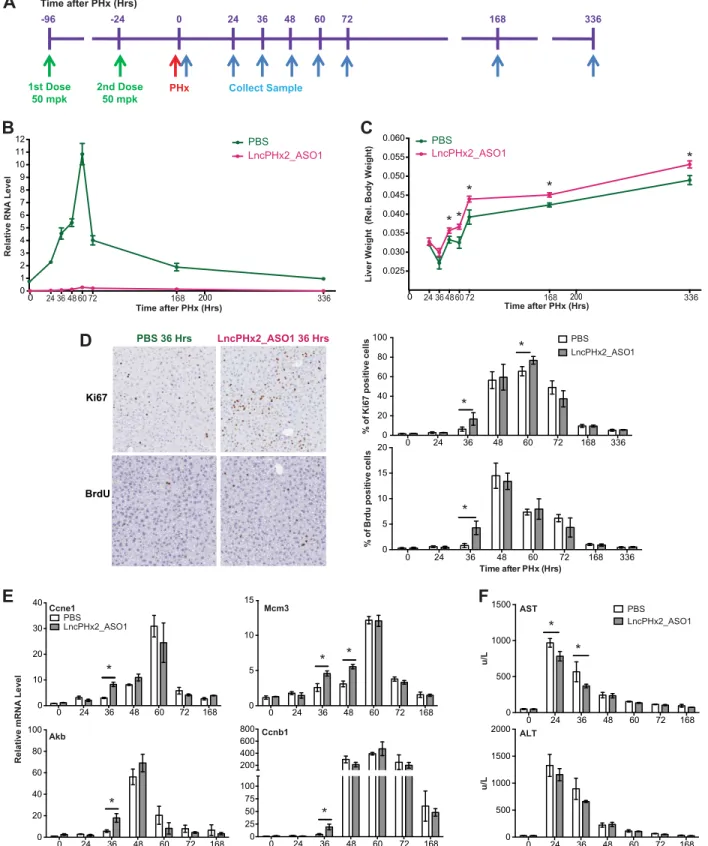
To characterize the function ofLncPHx2, we developed two ASOs that efficiently target LncPHx2for degradation by RNase H-mediated mechanism [31,32](S2 Fig). We treated mice subcutaneously with LncPHx2_ASOs, and then performed PHx surgery as shown inFig 3A. LncPHx2_ASO1 treatment completely blocked the upregulation ofLncPHx2during the liver regeneration process (Fig 3B). Interestingly, mice treated with LncPHx2_ASO1 had more rapid liver weight recovery compared to PBS-treated mice (Fig 3C). The effect on liver weight was significant at 48 hours after PHx, and livers in LncPHx2_ASO1-treated mice remained heavier 15 days after PHx (Fig 3C). The body weights of LncPHx2_ASO1-treated mice were not significantly different from PBS_treated mice (data not shown). The same phenotype was observed with two different ASOs targetingLncPHx2, but not with scrambled control ASO (S3 Fig). More proliferating cells were observed at 36 and 60 hours after PHx in LncPHx2_ASO1--treated mice than in controls, as demonstrated by higher percentages of Ki67 staining and BrdU labelling (Fig 3D). No measurable differences in cell proliferation between LncPHx2_A-SO1-treated and PBS-treated mice were observed at later time points (Fig 3D). qPCR analyses showed elevated expression of cell-cycle marker genes in LncPHx2_ASO1-treated mice includ-ing genes encodinclud-ing Cyclin E1 (Ccne1), Cyclin B1 (Ccnb1), and Aurora Kinase B (Aurkb) at 36 hours after PHx, and Mini-chromosome maintenance complex component 3 (Mcm3) at both 36 and 48 hours after PHx (Fig 3E).Ccnyl1mRNA levels did not change upon LncPHx2-deple-tion in either regenerating livers or in livers subjected to sham surgery (data not shown). In addition, we observed a faster recovery of liver aspartate transaminase (AST) levels in plasma
shown).*Pathway with FDR<0.05. (C) qPCR analysis of the levels of lncRNA transcripts. The mRNA level of the housekeeping geneGapdhand total RNA amount determined by Ribogreen staining (Life Technology) were used as controls. The RNA levels in livers of mice subjected to sham surgery were set as 1. n = 5. Statistical analysis was performed using the Student's t test.*p<0.05;**p<0.01;***p<0.001. (D) LncRNA expression in nine mouse tissues collected from Encode RNA-seq database. FPKM of lncRNA expression in each tissue was plotted against the mean value of each row. Red indicates higher expression. Blue indicates lower expression.
Fig 2. Characterization ofLncPHx2.(A)LncPHx2gene structure and genomic location. (B) qPCR analysis ofLncPHx2expression after PHx. The RNA levels in the livers at time 0 after sham surgery were set as 1. Data were quantified and statistically analysed as inFig 1C. (C) Northern blot ofLncPHx2in mouse livers. Lane 1, RNA from mouse liver treated with PBS. Lane2, RNA from mouse liver treated with ASO specifically targetingLncPHx2. Lane 3, RNA from mouse liver collected at 48 hours after PHx surgery. (D) qPCR analysis ofLncPHx2levels in nine mouse tissues.LncPHx2level was normalized to total RNA amount measured by Ribogreen (Life Technologies).LncPHx2level in mouse liver was set as 1. (E)LncPHx2single molecule RNAin situhybridization in livers of mice subjected to sham or PHx surgery. Upper panels: Light microscopy images.In situsignal ofLncPHx2is red, as indicated by arrows. Liver sections were counter-stained by H&E. Lower panels: Fluorescent microscopy images.In situsignal ofLncPHx2is red, as indicated by arrows. The nucleus was stained by DAPI.
of LncPHx2_ASO1-treated mice than in controls, suggesting that suppression ofLncPHx2 resulted in a more rapid recovery of liver function (Fig 3F). As inhibition ofLncPHx2 expres-sion led to increased hepatocyte proliferation after partial hepatectomy,LncPHx2appears to function as a negative regulator of cell proliferation during liver regeneration.
LncPHx2
suppresses the upregulation of positive cell-cycle regulators
during liver regeneration
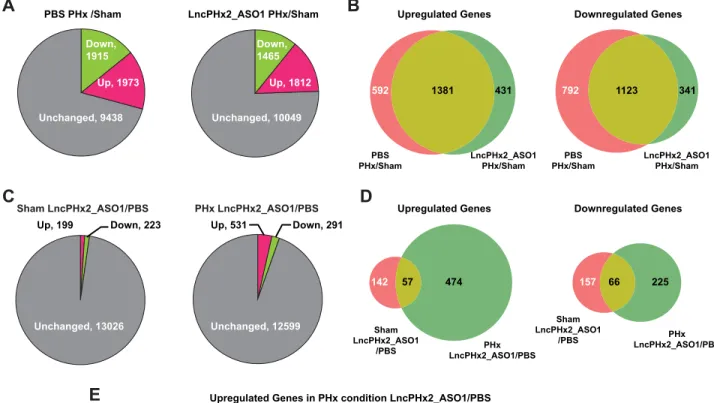
To investigate the mechanism that underlies the function ofLncPHx2in regulation of hepato-cyte proliferation, we performed RNA-seq analysis on livers of mice subjected to PHx or to sham surgery after treatment with LncPHx2_ASO1 or with PBS. Gene expression profiling was performed at 48 hours post-surgery since it was at this time point that we first observed liver weight differences between ASO-treated and PBS-treated mice. In PBS-treated mice, 1,973 genes (14.8% of 13,326 expressed genes) were significantly upregulated, and 1,915 genes (14.3%) were significantly downregulated at 48 hours after PHx compared to gene expression in PBS-treated mice subjected to sham surgery (Fig 4Aleft panel andS2 Table). In
LncPHx2_ASO1-treated mice, 1,812 genes (13.5%) were significantly upregulated, and 1,465 genes (11.0%) were significantly downregulated at 48 hours after PHx compared to mice treated with ASO and subjected to sham surgery (Fig 4Aright panel andS2 Table). The overlap between the two groups included 1,381 upregulated genes and 1,123 downregulated genes (Fig 4BandS2 Table). Interestingly, there were nearly equal numbers of up- and downregulated genes in the PBS-treated mouse livers at 48 hours after PHx (14.8% upregulated genes vs. 14.3% downregulated genes), whereas there were more genes upregulated than downregulated in the LncPHx2_ASO1-treated mouse livers (13.5% vs. 11.0%).
When the data from LncPHx2_ASO1-treated mice subjected to sham surgery were com-pared to data from PBS-treated mice subjected to sham surgery, we found that 199 genes were significantly upregulated, and 223 genes were significantly downregulated (Fig 4Cleft panel, andS2 Table). These are likely the genes regulated byLncPHx2in normal livers. When data from animals subjected to PHx with LncPHx2_ASO1 treatment were compared to those treated with PBS, we found that 531 genes were significantly upregulated, and 291 genes were significantly downregulated (Fig 4Cright panel, andS2 Table). These are likely the genes regu-lated byLncPHx2during liver regeneration. There were about equal numbers of up- (199) and downregulated (223) genes in sham liver in LncPHx2_ASO1-treated mice, whereas there were 1.8-fold more upregulated genes (531) than downregulated genes (291) in regenerating liver uponLncPHx2depletion (Fig 4C). The overlap between the two groups included 57 upregu-lated genes and 66 downreguupregu-lated genes (Fig 4DandS2 Table). KEGG pathway analysis was performed to identify pathway enrichment in these differentially expressed gene subsets. We found that genes promoting cell proliferation were enriched in the genes upregulated upon LncPHx2depletion in regenerating livers (Fig 4E), but in livers of mice treated with ASO and subjected to sham surgery, no enrichment of these genes was found (data not shown). Genes that appear to be regulated byLncPHx2include those that encode DNA polymerases (Pold1 andPold3), mini-chromosome maintenance complex components (Mcm2,3,4,5,6, and7), histone proteins (such asHist1h3eandHist1h4b), and transcription factors that are involved in
BrdU labelling of livers from mice treated with LncPHx2_ASO1 or PBS at 36 hours after PHx. Right panel: Histogram and statistics of Ki67 staining and BrdU labelling of mouse livers after PHx at indicated time points after PHx. (E) qPCR analysis of cell-cycle marker gene expression in mouse livers at indicated time points after PHx. mRNA levels in the PBS-treated livers at time 0 after PHx were set as 1. Data were quantified and statistically analysed as inFig 1C. (F) Liver aspartate transaminase (AST) levels (top panel) and alanine transaminase (ALT) levels (bottom panel) in mouse plasma measured at indicated time points after PHx.
Fig 4. Genome-wide gene expression profiling ofLncPHx2regulated genes.RNA-seq analysis of liver RNAs from mice treated with PBS or
cell-cycle regulation (such asE2F1) (Fig 4F). The genes regulated are consistent with the increased cell proliferation phenotype we observed inLncPHx2-depleted regenerating livers. Moreover, the levels of these genes are not changed inLncPHx2-depleted mouse livers sub-jected to sham operation (Fig 4F), in which no increased cell proliferation was observed (data not shown). These results suggest thatLncPHx2negatively regulates cell proliferation specifi-cally in regenerating livers in response to PHx through modulating the expression of genes that promote cell proliferation.
Gene expression signature of
LncPHx2
-depleted regenerating livers is
similar to that of HCC tumours
To further investigate what pathways are regulated byLncPHx2, we employed Gene Set Enrichment Analysis (GSEA) to search for enrichment across the Molecular Signatures Data-base (MSigDB), after ranking genes according to differential expression. We found that genes involved in cell proliferation, such as those involved in meiosis and DNA synthesis were posi-tively associated with theLncPHx2-depleted regenerating liver gene set (S4 Fig). Interestingly we also found that genes downregulated in cancers, were also downregulated in regenerating livers depleted ofLncPHx2(S5 Fig). Comparison with the oncogenic signature datasets in MSigDB revealed that the genes upregulated byLncPHx2-depletion in regenerating liver is also upregulated when tumour suppressor retinoblastoma protein (RB), retinoblastoma-like 1 (RBL1), and breast cancer 1 (BRCA1) were depleted (S5 Fig). These correlations suggest that LncPHx2might function as a tumour suppressor.
To test this hypothesis, we employed a diethylnitrosamine (DEN)-induced mouse hepato-cellular carcinoma (HCC) model, since genes downregulated in DEN-induced HCC were among the top negatively associated gene datasets to theLncPHx2-depleted regenerating liver gene set (S5 Fig). In addition, we found thatLncPHx2expression was moderately upregulated in tumours from mice with DEN-induced HCC compared to levels in adjacent tissue (S5 Fig). DEN-treated mice were injected with PBS, control ASO or LncPHx2_ASO1 subcutaneously (S5 Fig).LncPHx2expression in tumour cells was significantly reduced in mice treated with LncPHx2_ASO1 compared to levels in tumour cells from control mice (S5 Fig). The tumour volumes, however, were indistinguishable between those from LncPHx2_ASO1-treated mice and PBS- and control ASO-treated mice (S5 Fig). These results indicate that the depletion of LncPHx2alone is not sufficient to augment tumour progression in the DEN-induced HCC mouse model.
LncPHx2
interacts with many mRNAs including several encoding
proteins involved in cell proliferation
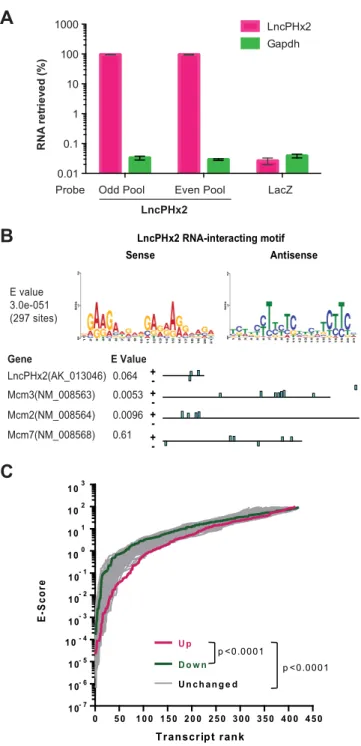
Cytoplasmic lncRNAs have been shown to regulate gene expression through RNA-RNA inter-actions [34]. To investigate whetherLncPHx2directly interacts with mRNAs, we adapted a previously described RNA interactome approach [34]. Biotinylated DNA probes targeting LncPHx2were used to precipitate endogenousLncPHx2and associated RNAs from Hepa1-6 cells. Using this method, we recovered more than 95% of endogenousLncPHx2RNAs (Fig 5A). The associated RNAs were sequenced and 415 unique transcripts were identified,
surgery (right panel). (D) Venn diagrams of differentially expressed genes in LncPHx2_ASO1-treated mouse livers under either sham or PHx conditions compared to PBS-treated mouse livers under the same conditions. Left panel: Upregulated genes. Right panel: Downregulated genes. (E) KEGG pathway analysis of genes upregulated in regenerating livers from LncPHx2_ASO1-treated mice compared to PBS-treated mice at 48 hours after PHx.*Pathway with FDR<0.05. (F) RNA-seq results of representative genes in each treatment condition indicated. mRNA levels in PBS-treated mice with sham surgery were set as 1. Ratios and statistics were done using cuffdiff.*p<0.01;**p<0.001;***p<0.0001
Fig 5. IdentifyLncPHx2RNA-interactome.(A) qPCR analysis ofLncPHx2recovery in RNA samples from
LncPHx2RNA-interactome experiment. Odd pool: pool of odd numbered probes bind toLncPHx2RNA. Even pool: pool of even numbered probes bind toLncPHx2RNA. LacZ: control probes bind to LacZ mRNA. (B) Upper panel:LncPHx2RNA-interacting motif identified from 415LncPHx2interacting sites using MEME de novo motif search tool. Lower panel:LncPHx2RNA-interacting motif inLncPHx2,Mcm2,Mcm3andMcm7
transcripts. (C)LncPHx2RNA-interacting motif enrichment in differentially expressed genes in regenerating liver uponLncPHx2-depletion. Motif-search for theLncPHx2RNA-interacting motif was performed on 300 upregulated, 291 downregulated and 100 sets of 300 randomly sampled unchanged gene transcript sequences inLncPHx2-depleted regenerating liver using MAST with default parameters (e-value cutoff 100, maximum p-value for motif match = 0.0001). Student’s t-test was performed on log-transformed e-scores from the 3 groups.
suggesting thatLncPHx2is associated with multiple RNAs (S3 Table). The sequences of associ-ated RNA fragments were subjected to ade novomotif search using MEME (Motif-based sequence analysis tools) [35]. We identified a 21-nucleotide motif that was strongly enriched in LncPHx2-interacting RNAs (Fig 5B). Interestingly, this motif is present in tandem in both sense and antisense directions in theLncPHx2RNA itself (Fig 5B).
We found that mRNAs encoding MCM2, MCM3 and MCMC7, which were upregulated uponLncPHx2-depletion in regenerating livers, were associated withLncPHx2in Hepa1-6 cells. The MCM2-7 proteins are key components of the DNA pre-replication complex and are required for initiation of eukaryotic genome replication [41]. Both gain- and loss-of-function analyses demonstrated that MCMs promote cell proliferation [42]. TheLncPHx2 RNA-inter-acting motif is present in these three Mcm mRNAs with high significance as evaluated by MAST (Motif-based sequence analysis tools)[36] (Fig 5B). With the exception of these mRNAs and those listed inS4 Table, we did not observe significant overlap between the mRNAs that are associated withLncPHx2in Hepa1-6 cells and those that are differentially expressed upon LncPHx2-depletion during liver regeneration. The systems in which these experiments were performed (anin vitrocell line vs. regenerating liver) are very different, andLncPHx2probably regulates different sets of genes under different biological conditions.
Since it is technically challenging to pull-down endogenousLncPHx2and its associated RNAs in regenerating liver, we evaluatedLncPHx2RNA-interacting motif enrichment in the differen-tially expressed genes inLncPHx2-depleted regenerating liversin silico. MAST reverse motif search were performed on similar numbers of genes from upregulated (top 300 out of 531) and downregulated (291 out of 291) gene categories, as the results of MAST is influenced by numbers of sequences submitted for each query [36]. A hundred sets of 300 randomly sampled genes from unchanged gene category were used as control. We found a significant enrichment of the LncPHx2motif in the upregulated transcripts. The overall E-value of upregulated transcripts is significantly lower compared to both downregulated transcripts and unchanged transcripts (Fig 5C). These results suggest thatLncPHx2could downregulate gene expression during liver regener-ation, by directly binding to the mRNAs through the identifiedLncPHx2RNA-interacting motif
Discussion
LncRNAs are often expressed only in certain tissues or during specific developmental stages [1, 4]. In order to characterize lncRNAs that regulate cell proliferation, we used a mouse PHx model, in which cells are synchronized to proliferate in response to the loss of liver mass. A large number of lncRNAs are differentially expressed over the time course of liver regeneration. One lncRNA,LncPHx2, which is highly induced during liver regeneration, was studied in detail. Depletion ofLncPHx2by ASOs before PHx surgery led to more rapid liver mass recov-ery, increased cell proliferation, and faster recovery of liver function compared to mice treated with vehicle (Fig 3). Genome-wide gene expression profiling showed that depletion ofLncPHx2 during liver regeneration led to upregulation of genes that promote cell proliferation (Fig 4). Recently, several studies have shown that lncRNAs play important roles in regulating cell pro-liferation by controlling the expression levels of the cell-cycle regulators [43].NcRNAccnd1and Gadd7induced by DNA damage, directly regulate the level of CCND1 and CDK6, and contrib-ute to the cell cycle arrest caused by DNA damage [44,45]. Our data here showed that
tuning cell proliferation rate when a robust cell proliferation is induced by PHx surgery. A recent study by Kambara et al showed that an IFN inducedlncRNA-CMPK2acts as a negative regulator of a subset of IFN-induced gene to prevent excessive or uncontrolled IFN response [47]. Together, long non-coding RNAs add another layer of regulation to achieve the precise control of biological processes.
Interestingly,LncPHx2plays a more important role in regulating hepatocyte proliferation in regenerating livers than in normal livers or in liver cell lines. No measurable phenotype was observed in the normal mouse liver whenLncPHx2was depleted by two differentLncPHx2 ASOs (data not shown). We only observed a slight inhibition of cell proliferation in cell lines when we overexpressedLncPHx2to more than 100-fold compared to endogenous level, and no measurable phenotypic changes were observed uponLncPHx2depletion (data not shown). Our study provided evidence that lncRNAs function as key modulators under stress conditions [1,4]. Similarly, LncRNA PRINS (Psoriasis susceptibility-related RNA Gene Induced by Stress) was previously reported to be induced by serum-starvation, and promote cell viability only after serum starvation, but not under normal serum condition [48].
Although GSEA analysis showed that the gene expression profile uponLncPHx2depletion in regenerating mouse livers is similar to the gene expression pattern of mouse HCC, and the depletion ofLncPHx2promoted hepatocyte proliferation after PHx, the depletion ofLncPHx2 did not promote tumorigenesis in the DEN-induced mouse HCC model (S5 Fig). These data suggested thatLncPHx2is a negative cell proliferation regulator but not a tumour suppressor. However, it is possible thatLncPHx2only protects against tumour initiation but not progres-sion, which needs to be further investigated.
We searched for a human orthologue ofLncPHx2and identified a region with sequence homology (Human hg19 chr2:208564953–208576096, 65.8%, UCSC TransMap analysis) in the human genome. We found no evidence of transcriptome activity in this locus in any available database. SinceLncPHx2is expressed at very low levels in mouse tissues, with the exception of testis, it is possible that expression of the human counterpart ofLncPHx2is induced under spe-cific conditions, for example in injured livers.
Gene expression profiles showed that the depletion ofLncPHx2leads to upregulation of cell cycle genes including those encoding E2F1, MCMs, histone proteins, and DNA polymerases (Fig 4). We also showed that in cell lines,LncPHx2is localized in the cytoplasm and associates with many mRNAs includingMcm2,Mcm3, andMcm7(Figs2and5). It is possible that LncPHx2downregulates gene expression by binding to these mRNAs and affecting their stabil-ity. We also evaluated proteins that are associated withLncPHx2using conditions modified to favour RNA-protein binding [49]. The proteins identified were mainly ribosomal subunits (data not shown). There have been reports that lncRNAs associate with ribosomes and gener-ate small peptides [50].LncPHx2contains one open reading frame encoding a peptide with 27 amino acids. We believe it is unlikely thatLncPHx2is translated. First, the open reading frame inLncPHx2is not conserved. Second, theLncPHx2transcript lacks a Kozak sequence. Third, no matches were found in mouse or human proteomic databases to date (http://world-2dpage. expasy.org/repository/;http://reprod.njmu.edu.cn/cgi-bin/2d/2d.cgi). Recently, it was reported that lncRNAGAS5regulatesc-MYCtranslation by association with the ribosome [51]. It is possible thatLncPHx2regulates both mRNA stability and translation of its associated mRNAs. The detailed mechanism of action ofLncPHx2remains to be elucidated.
Supporting Information
subjected to sham surgery at time 0 after surgery were set as 1. Data were quantified and statis-tically analysed as inFig 1C. (B) Reported transcription isoforms ofLncPHx2(Ensembl). (C) qPCR analysis ofLncPHx2levels in nuclear and cytoplasmic RNA fractions from MHT cells. LncPHx2level in total cellular RNA was set as 1.
(EPS)
S2 Fig.LncPHx2depletion in MHT and BNL.CL2 cells byLncPHx2specific ASOs.qPCR analysis ofLncPHx2levels after ASO treatment of (A) MHT cells and (B) BNL.CL2 cells. The LncPHx2levels in untreated (NT) cells were set as 1. Data were quantified and statistically ana-lysed as inFig 1C.
(EPS)
S3 Fig. Depletion ofLncPHx2leads to faster liver weight recovery at 48 hours after PHx. (A) Experimental procedure. Mice were given two doses of PBS or ASOs at 50 mg/kg (mpk) at time points (indicated by green arrows) before PHx surgery (indicated by red arrow). Animals were sacrificed to collect samples for phenotype study at 48 hours after PHx (indicated by blue arrow). n = 3. (B) qPCR analysis ofLncPHx2depletion by ASOs in mouse livers 48 hours after PHx. The RNA level in the PBS-treated mouse liver at time 0 after PHx was set as 1. Data were quantified and statistically analysed as inFig 1C. (C) Liver to body weight ratios were measured at 48 hours after PHx.
(EPS)
S4 Fig. Genes promote cell proliferation are enriched inLncPHx2-depleted regenerating livers.Top positively associated pathways by GSEA analysis. (A) Enrichment plot, DNA strand elongation (Reactome) (M19312). (B) Enrichment plot, Meiosis (Reactome) (M529). (C) Enrichment plot, Meitotic recombination (Reactome) (M1011). (D) Enrichment plot, Telo-mere maintenance (Reactome) (M4052).
(EPS)
S5 Fig.LncPHx2depletion does not promote tumour progression in DEN-induced HCC mouse model.(A) Enrichment plot of top negatively associated pathways by GSEA analysis. Left panel: Liver cancer DENA downregulated (Lee) (M1424): top 100 downregulated genes in mouse DEN-induced HCC. Right panel: Liver cancer MYC E2F1 downregulated (Lee) (M5636): top 100 downregulated in HCC from Myc/E2f1 double transgenic mice. (B) Enrich-ment plot of top positively associated oncogenic pathways by GSEA analysis. RB1 and RBL1 KO upregulated (M2802): top 150 upregulated genes in primary keratinocytes from RB1 and RBL1 skin specific knockout mice. BRCA1 KD upregulated (M2748): top 150 upregulated genes in MCF10A cells upon knockdown of BRCA1 gene by RNAi. (C) qPCR analysis of LncPHx2levels in DEN-induced mouse HCC tumour. The RNA level in the adjacent normal tissue was set as 1. Data were quantified and statistically analysed as inFig 1C. N = 8. (D) Sche-matic of DEN-HCC model study design. (E) qPCR analysis ofLncPHx2levels in tumour and adjacent normal tissues from mice treated with LncPHx2_ASO1 or a control ASO.LncPHx2 levels in adjacent normal tissues of mice treated with PBS were set as 1. Data were quantified and statistically analysed as inFig 1c. N = 10–12. (F) Numbers of tumours in mice treated as indicated. N = 10–12
(EPS)
S1 Table. Differentially expressed mRNAs and lncRNAs during liver regeneration after PHx.
S2 Table. Differentially expressed genes at 48 hours after PHx and sham surgery in PBS-and LncPHx2_ASO1-treated mouse livers.
(XLSX)
S3 Table. Transcripts identified inLncPHx2RNA-interactome study. (XLSX)
S4 Table. Transcripts identified in both RNA-seq analyses in livers treated with LncPHx2_ASO1 andLncPHx2RNA-interactome study.
(XLSX)
Acknowledgments
The authors would like to thank Michelle Barton from UT-MD Anderson Cancer Center, C. Frank Bennett, Xuehai Liang, Alexey Revenko and Youngsoo Kim from Isis pharmaceuticals for helpful discussion, and Tracy Reigle for her help with formatting the figures.
Author Contributions
Conceived and designed the experiments: LH BPM SG. Performed the experiments: LH SB SG. Analyzed the data: LH SSD PS MS ATW CEH SMF SG. Contributed reagents/materials/analy-sis tools: JH MJ MK ATW. Wrote the paper: LH SSD BPM SG.
References
1. Rinn JL, Chang HY. Genome regulation by long noncoding RNAs. Annual review of biochemistry. 2012; 81:145–66. doi:10.1146/annurev-biochem-051410-092902PMID:22663078; PubMed Central PMCID: PMC3858397.
2. Ulitsky I, Bartel DP. lincRNAs: genomics, evolution, and mechanisms. Cell. 2013; 154(1):26–46. doi: 10.1016/j.cell.2013.06.020PMID:23827673; PubMed Central PMCID: PMC3924787.
3. Derrien T, Johnson R, Bussotti G, Tanzer A, Djebali S, Tilgner H, et al. The GENCODE v7 catalog of human long noncoding RNAs: analysis of their gene structure, evolution, and expression. Genome research. 2012; 22(9):1775–89. doi:10.1101/gr.132159.111PMID:22955988; PubMed Central PMCID: PMC3431493.
4. Prensner JR, Chinnaiyan AM. The emergence of lncRNAs in cancer biology. Cancer discovery. 2011; 1(5):391–407. doi:10.1158/2159-8290.CD-11-0209PMID:22096659; PubMed Central PMCID: PMC3215093.
5. Wapinski O, Chang HY. Long noncoding RNAs and human disease. Trends in cell biology. 2011; 21 (6):354–61. doi:10.1016/j.tcb.2011.04.001PMID:21550244.
6. Sanchez Y, Huarte M. Long non-coding RNAs: challenges for diagnosis and therapies. Nucleic acid therapeutics. 2013; 23(1):15–20. doi:10.1089/nat.2012.0414PMID:23391415; PubMed Central PMCID: PMC3569944.
7. Penny GD, Kay GF, Sheardown SA, Rastan S, Brockdorff N. Requirement for Xist in X chromosome inactivation. Nature. 1996; 379(6561):131–7. doi:10.1038/379131a0PMID:8538762.
8. Sauvageau M, Goff LA, Lodato S, Bonev B, Groff AF, Gerhardinger C, et al. Multiple knockout mouse models reveal lincRNAs are required for life and brain development. eLife. 2013; 2:e01749. doi:10. 7554/eLife.01749PMID:24381249; PubMed Central PMCID: PMC3874104.
9. Grote P, Wittler L, Hendrix D, Koch F, Wahrisch S, Beisaw A, et al. The tissue-specific lncRNA Fendrr is an essential regulator of heart and body wall development in the mouse. Developmental cell. 2013; 24(2):206–14. doi:10.1016/j.devcel.2012.12.012PMID:23369715; PubMed Central PMCID: PMC4149175.
10. Klattenhoff CA, Scheuermann JC, Surface LE, Bradley RK, Fields PA, Steinhauser ML, et al. Brave-heart, a long noncoding RNA required for cardiovascular lineage commitment. Cell. 2013; 152(3):570–
83. doi:10.1016/j.cell.2013.01.003PMID:23352431; PubMed Central PMCID: PMC3563769. 11. Eissmann M, Gutschner T, Hammerle M, Gunther S, Caudron-Herger M, Gross M, et al. Loss of the
12. Zhang B, Arun G, Mao YS, Lazar Z, Hung G, Bhattacharjee G, et al. The lncRNA Malat1 is dispensable for mouse development but its transcription plays a cis-regulatory role in the adult. Cell reports. 2012; 2 (1):111–23. doi:10.1016/j.celrep.2012.06.003PMID:22840402; PubMed Central PMCID:
PMC3408587.
13. Fan Y, Shen B, Tan M, Mu X, Qin Y, Zhang F, et al. TGF-beta-induced upregulation of malat1 promotes bladder cancer metastasis by associating with suz12. Clinical cancer research: an official journal of the American Association for Cancer Research. 2014; 20(6):1531–41. doi: 10.1158/1078-0432.CCR-13-1455PMID:24449823.
14. Gutschner T, Hammerle M, Eissmann M, Hsu J, Kim Y, Hung G, et al. The noncoding RNA MALAT1 is a critical regulator of the metastasis phenotype of lung cancer cells. Cancer research. 2013; 73 (3):1180–9. doi:10.1158/0008-5472.CAN-12-2850PMID:23243023; PubMed Central PMCID: PMC3589741.
15. Tseng YY, Moriarity BS, Gong W, Akiyama R, Tiwari A, Kawakami H, et al. PVT1 dependence in cancer with MYC copy-number increase. Nature. 2014; 512(7512):82–6. doi:10.1038/nature13311PMID: 25043044.
16. Lee JT. Epigenetic regulation by long noncoding RNAs. Science. 2012; 338(6113):1435–9. doi:10. 1126/science.1231776PMID:23239728.
17. Gutschner T, Diederichs S. The hallmarks of cancer: a long non-coding RNA point of view. RNA biol-ogy. 2012; 9(6):703–19. doi:10.4161/rna.20481PMID:22664915; PubMed Central PMCID: PMC3495743.
18. Mitchell C, Willenbring H. A reproducible and well-tolerated method for 2/3 partial hepatectomy in mice. Nature protocols. 2008; 3(7):1167–70. doi:10.1038/nprot.2008.80PMID:18600221.
19. Fausto N, Campbell JS, Riehle KJ. Liver regeneration. Hepatology. 2006; 43(2 Suppl 1):S45–53. doi: 10.1002/hep.20969PMID:16447274.
20. Michalopoulos GK, DeFrances MC. Liver regeneration. Science. 1997; 276(5309):60–6. PMID: 9082986.
21. Michalopoulos GK. Liver regeneration after partial hepatectomy: critical analysis of mechanistic dilem-mas. The American journal of pathology. 2010; 176(1):2–13. doi:10.2353/ajpath.2010.090675PMID: 20019184; PubMed Central PMCID: PMC2797862.
22. Hortelano S, Zeini M, Casado M, Martin-Sanz P, Bosca L. Animal models for the study of liver regenera-tion: role of nitric oxide and prostaglandins. Frontiers in bioscience: a journal and virtual library. 2007; 12:13–21. PMID:17127280.
23. Taub R. Liver regeneration: from myth to mechanism. Nature reviews Molecular cell biology. 2004; 5 (10):836–47. PMID:15459664.
24. Kurinna S, Barton MC. Cascades of transcription regulation during liver regeneration. The international journal of biochemistry & cell biology. 2011; 43(2):189–97. doi:10.1016/j.biocel.2010.03.013PMID: 20307684; PubMed Central PMCID: PMC2923255.
25. He G, Dhar D, Nakagawa H, Font-Burgada J, Ogata H, Jiang Y, et al. Identification of liver cancer pro-genitors whose malignant progression depends on autocrine IL-6 signaling. Cell. 2013; 155(2):384–96. doi:10.1016/j.cell.2013.09.031PMID:24120137; PubMed Central PMCID: PMC4015514.
26. Conesa A, Nueda MJ, Ferrer A, Talon M. maSigPro: a method to identify significantly differential expression profiles in time-course microarray experiments. Bioinformatics. 2006; 22(9):1096–102. doi: 10.1093/bioinformatics/btl056PMID:16481333.
27. Benjamini YH, Yosef. Controlling the false discovery rate: a practical and powerful approach to multiple testing. Jounral of the Royal Statistical Society Series B (Methodological). 1995; 57(1):289–300. 28. Dobin A, Davis CA, Schlesinger F, Drenkow J, Zaleski C, Jha S, et al. STAR: ultrafast universal
RNA-seq aligner. Bioinformatics. 2013; 29(1):15–21. doi:10.1093/bioinformatics/bts635PMID:23104886; PubMed Central PMCID: PMC3530905.
29. Trapnell C, Hendrickson DG, Sauvageau M, Goff L, Rinn JL, Pachter L. Differential analysis of gene regulation at transcript resolution with RNA-seq. Nature biotechnology. 2013; 31(1):46–53. doi:10. 1038/nbt.2450PMID:23222703; PubMed Central PMCID: PMC3869392.
30. Subramanian A, Tamayo P, Mootha VK, Mukherjee S, Ebert BL, Gillette MA, et al. Gene set enrichment analysis: a knowledge-based approach for interpreting genome-wide expression profiles. Proceedings of the National Academy of Sciences of the United States of America. 2005; 102(43):15545–50. doi: 10.1073/pnas.0506580102PMID:16199517; PubMed Central PMCID: PMC1239896.
32. Bennett CF, Swayze EE. RNA targeting therapeutics: molecular mechanisms of antisense oligonucleo-tides as a therapeutic platform. Annual review of pharmacology and toxicology. 2010; 50:259–93. doi: 10.1146/annurev.pharmtox.010909.105654PMID:20055705.
33. Koller E, Vincent TM, Chappell A, De S, Manoharan M, Bennett CF. Mechanisms of single-stranded phosphorothioate modified antisense oligonucleotide accumulation in hepatocytes. Nucleic acids research. 2011; 39(11):4795–807. doi:10.1093/nar/gkr089PMID:21345934; PubMed Central PMCID: PMC3113586.
34. Kretz M, Siprashvili Z, Chu C, Webster DE, Zehnder A, Qu K, et al. Control of somatic tissue differentia-tion by the long non-coding RNA TINCR. Nature. 2013; 493(7431):231–5. doi:10.1038/nature11661 PMID:23201690; PubMed Central PMCID: PMC3674581.
35. Bailey TL, Boden M, Buske FA, Frith M, Grant CE, Clementi L, et al. MEME SUITE: tools for motif dis-covery and searching. Nucleic acids research. 2009; 37(Web Server issue):W202–8. doi:10.1093/nar/ gkp335PMID:19458158; PubMed Central PMCID: PMC2703892.
36. Bailey TL, Gribskov M. Combining evidence using p-values: application to sequence homology searches. Bioinformatics. 1998; 14(1):48–54. PMID:9520501.
37. Fausto N, Campbell JS. The role of hepatocytes and oval cells in liver regeneration and repopulation. Mechanisms of development. 2003; 120(1):117–30. PMID:12490302.
38. Mouse Genome Sequencing C, Waterston RH, Lindblad-Toh K, Birney E, Rogers J, Abril JF, et al. Ini-tial sequencing and comparative analysis of the mouse genome. Nature. 2002; 420(6915):520–62. doi: 10.1038/nature01262PMID:12466850.
39. Lin MF, Jungreis I, Kellis M. PhyloCSF: a comparative genomics method to distinguish protein coding and non-coding regions. Bioinformatics. 2011; 27(13):i275–82. doi:10.1093/bioinformatics/btr209 PMID:21685081; PubMed Central PMCID: PMC3117341.
40. Mouse EC, Stamatoyannopoulos JA, Snyder M, Hardison R, Ren B, Gingeras T, et al. An encyclopedia of mouse DNA elements (Mouse ENCODE). Genome biology. 2012; 13(8):418. doi: 10.1186/gb-2012-13-8-418PMID:22889292; PubMed Central PMCID: PMC3491367.
41. Maiorano D, Lutzmann M, Mechali M. MCM proteins and DNA replication. Current opinion in cell biol-ogy. 2006; 18(2):130–6. doi:10.1016/j.ceb.2006.02.006PMID:16495042.
42. Lau KM, Chan QK, Pang JC, Li KK, Yeung WW, Chung NY, et al. Minichromosome maintenance pro-teins 2, 3 and 7 in medulloblastoma: overexpression and involvement in regulation of cell migration and invasion. Oncogene. 2010; 29(40):5475–89. doi:10.1038/onc.2010.287PMID:20661220.
43. Kitagawa M, Kitagawa K, Kotake Y, Niida H, Ohhata T. Cell cycle regulation by long non-coding RNAs. Cellular and molecular life sciences: CMLS. 2013; 70(24):4785–94. doi:10.1007/s00018-013-1423-0 PMID:23880895; PubMed Central PMCID: PMC3830198.
44. Wang X, Arai S, Song X, Reichart D, Du K, Pascual G, et al. Induced ncRNAs allosterically modify RNA-binding proteins in cis to inhibit transcription. Nature. 2008; 454(7200):126–30. doi:10.1038/ nature06992PMID:18509338; PubMed Central PMCID: PMC2823488.
45. Liu X, Li D, Zhang W, Guo M, Zhan Q. Long non-coding RNA gadd7 interacts with TDP-43 and regu-lates Cdk6 mRNA decay. The EMBO journal. 2012; 31(23):4415–27. doi:10.1038/emboj.2012.292 PMID:23103768; PubMed Central PMCID: PMC3512391.
46. Sherr CJ, Roberts JM. CDK inhibitors: positive and negative regulators of G1-phase progression. Genes & development. 1999; 13(12):1501–12. PMID:10385618.
47. Kambara H, Niazi F, Kostadinova L, Moonka DK, Siegel CT, Post AB, et al. Negative regulation of the interferon response by an interferon-induced long non-coding RNA. Nucleic acids research. 2014; 42 (16):10668–80. doi:10.1093/nar/gku713PMID:25122750; PubMed Central PMCID: PMC4176326. 48. Sonkoly E, Bata-Csorgo Z, Pivarcsi A, Polyanka H, Kenderessy-Szabo A, Molnar G, et al. Identification
and characterization of a novel, psoriasis susceptibility-related noncoding RNA gene, PRINS. The Journal of biological chemistry. 2005; 280(25):24159–67. doi:10.1074/jbc.M501704200PMID: 15855153.
49. Lalith S. Gunawardane SV. Analysis of the interactome of a Long Non Coding RNA: lncRNA-Protein Interactions Captured by Antisense Oligonucleotide (lncRNA PICASO). Keystone Symposia, Long Noncoding RNAs: Marching toward Mechanism 2013.
50. Ingolia NT, Lareau LF, Weissman JS. Ribosome profiling of mouse embryonic stem cells reveals the complexity and dynamics of mammalian proteomes. Cell. 2011; 147(4):789–802. doi:10.1016/j.cell. 2011.10.002PMID:22056041; PubMed Central PMCID: PMC3225288.