Hepatocellular Carcinoma Identified by Microarray
Analysis
Juanjuan Zhu1,2, Shanshan Liu1,2, Fuqiang Ye2, Yuan Shen2, Yi Tie2, Jie Zhu2, Yinghua Jin1, Xiaofei Zheng2, Yongge Wu1*, Hanjiang Fu2*
1College of Life Sciences, Jilin University, Changchun, China,2Beijing Institute of Radiation Medicine, Beijing, China
Abstract
Background:Thousands of long noncoding RNAs (lncRNAs) have been reported in mammalian genomes. These RNAs represent an important subset of pervasive genes involved in a broad range of biological functions. Aberrant expression of lncRNAs is associated with many types of cancers. Here, in order to explore the potential lncRNAs involved in hepatocellular carcinoma (HCC) oncogenesis, we performed lncRNA gene expression profile analysis in 3 pairs of human HCC and adjacent non-tumor (NT) tissues by microarray.
Methodology:Differentially expressed lncRNAs and mRNAs were detected by human lncRNA microarray containing 33,045 lncRNAs and 30,215 coding transcripts. Bioinformatic analyses (gene ontology, pathway and network analysis) were applied for further study of these differentially expressed mRNAs. By qRT-PCR analysis in nineteen pairs of HCC and adjacent normal tissues, we found that eight lncRNAs were aberrantly expressed in HCC compared with adjacent NT tissues, which is consistent with microarray data.
Conclusions:We identified 214 lncRNAs and 338 mRNAs abnormally expressed in all three HCC tissues (Fold Change$2.0, P,0.05 and FDR ,0.05) with the genome-wide lncRNAs and mRNAs expression profile analysis. The lncRNA-mRNA co-expression network was constructed, which may be used for predicting target genes of lncRNAs. Furthermore, we demonstrated for the first time that BC017743, ENST00000395084, NR_026591, NR_015378 and NR_024284 were up-regulated, whereas NR_027151, AK056988 and uc003yqb.1 were down-regulated in nineteen pairs of HCC samples compared with adjacent NT samples. Expression of seven lncRNAs was significantly correlated to their nearby coding genes. In conclusion, our results indicated that the lncRNA expression profile in HCC was significantly changed, and we identified a series of new hepatocarcinoma associated lncRNAs. These results provide important insights about the lncRNAs in HCC pathogenesis.
Citation:Zhu J, Liu S, Ye F, Shen Y, Tie Y, et al. (2014) The Long Noncoding RNA Expression Profile of Hepatocellular Carcinoma Identified by Microarray Analysis. PLoS ONE 9(7): e101707. doi:10.1371/journal.pone.0101707
Editor:Vinod Scaria, CSIR Institute of Genomics and Integrative Biology, India ReceivedDecember 20, 2013;AcceptedJune 10, 2014;PublishedJuly 15, 2014
Copyright:ß2014 Zhu et al. This is an open-access article distributed under the terms of the Creative Commons Attribution License, which permits unrestricted use, distribution, and reproduction in any medium, provided the original author and source are credited.
Funding:This work was supported partially by Chinese State Key Projects for Basic Research (2010CB912801, 2013CB910801), Chinese National Natural Science Foundation projects (31070702, 81072021, 31170713). The funders had no role in study design, data collection and analysis, decision to publish, or preparation of the manuscript.
Competing Interests:The authors have declared that no competing interests exist. * Email: [email protected] (YW); [email protected] (HF)
Introduction
The incidence of hepatocelluar carcinoma is currently the fifth highest in solid tumor and is the third leading cause of cancer death worldwide, accounting for approximately one million deaths annually [1,2]. Geographic areas with highest frequency are located in Africa and Eastern Asia. Most cases of HCC are attributed to either chronic viral hepatitis infection (hepatitis B or C) or cirrhosis [3]. Unfortunately, the survival rate of HCC patients remains poor despite recent advances in medical treatment and surgical techniques [4]. More seriously, the mortality of HCC is still growing with an increasing trend of new occurrence [4].
The overwhelming majority of human transcriptome was confirmed to be noncoding genes [5]. Over the past decade, those abundant transcripts have been declared to have important
critical roles in a variety of human diseases, including cancer, Huntington’s disease and Alzheimer’s disease [13–15]. Deregula-tion of lncRNAs has been proposed to be associated with hepatocarcinogenesis, such as MVIH, H19, HEIH, HULC, TUC338 and MEG3 [16–22]. For example, lncRNA high expression in HCC (lncRNA-HEIH) facilitates tumor growth through Enhancer of Zeste Homolog 2 in humans [18]; LncRNA-HULC which is a highly specific up-regulated lncRNA in HCC, envisaged as a novel biomarker because it could be detected in blood of HCC patients [19]; The expression of LncRNA-MALAT-1 up-regulated predicts tumor recurrence of HCC after liver transplantation [20]. Despite these exciting development, many more lncRNAs playing crucial roles in HCC remain to be clarified.
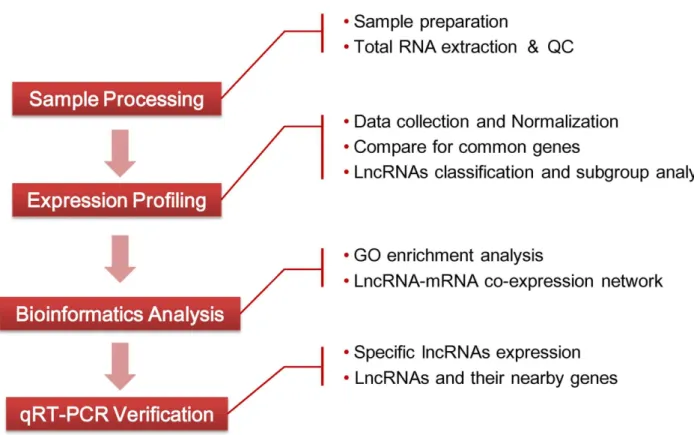
By analyzing the global expression profile of lncRNAs and mRNAs, we identified 214 lncRNAs and 338 mRNAs that were significantly differentially expressed in HCC tissues and adjacent NT tissues. LncRNA classification and subgroup analysis, genomic location analysis, construction of the lncRNA-mRNA co-expres-sion network and qRT-PCR analysis were performed for further analyze these differentially expressed lncRNAs (Figure 1). We found eight lncRNAs were dysregulated in nineteen pairs of HCC samples compared with adjacent NT samples and expression of seven lncRNAs was significantly correlated to their nearby coding genes. Simultaneously, the lncRNA-mRNA co-expression network was constructed, which may be used for predicting target genes of lncRNAs. Our observations demonstrated that lncRNAs expres-sion profiles are likely to provide important insights into pathogenesis of HCC.
Materials and Methods
Patient sample preparation
Nineteen pairs of HCC samples and adjacent non-tumor tissues were obtained from surgical specimens at General Hospital of the People’s Liberation Army (Beijing, China) after informed consent. Those samples used in this study have been described in previous publication [23]. Clear hepatocellular carcinoma was diagnosed histopathologically. All these specimens including clear hepatocel-lular carcinoma and adjacent non-tumor tissues were snap-frozen at liquid nitrogen after excision. Of these samples, 3 pairs (2 patients infected with Hepatitis B, and one infected with Hepatitis C) were used for lncRNA microarray analysis and the remaining samples were used for further validation. The clinical character-istics of the three HCC patients were shown in Table 1.
RNA extraction
Total RNA was extracted from the frozen tissue block using TRIzol reagent (Sigma, USA) according to the manufacturer’s protocol. RNA quantification and quality were assured by Nano Drop ND-1000 spectrophotometer. RNA integrity and gDNA contamination were tested by denatured agarose gel electropho-resis (Figure S1).
Microarray analysis and computational analysis
Sample preparation and microarray hybridization were per-formed by Kangchen Bio-tech, Shanghai P.R. China. Briefly, RNA was purified from 1mg total RNA after removal of rRNA (mRNA-ONLY Eukaryotic mRNA Isolation Kit, Epicentre). Then, each sample was amplified and transcribed into fluorescent cRNA along the entire length of the transcripts without 39 bias utilizing a random priming method. The labeled cRNAs were
Figure 1. Flowchart of the experiment.
doi:10.1371/journal.pone.0101707.g001
LncRNA Expression Profile in HCC
hybridized onto the Human LncRNA Array v2.0 (8660 K, Arraystar). After having washed the slides, the arrays were scanned by the Agilent Scanner G2505B. Agilent Feature Extraction software (version 10.7.3.1) was utilized to analyze acquired array images. Quantile normalization and subsequent data processing were carried out using the GeneSpring GX v11.5.1 software package (Agilent Technologies). Differentially expressed LncRNAs and mRNAs were identified through fold change filtering (Fold Change $2.0 or #0.5), paired t-test (p,0.05) and multiple hypothesis testing (FDR,0.05). P values and FDR were calculated by Microsoft Excel and MATLAB respectively. The microarray data has been deposited in NCBI Gene Expression Omnibus (GEO) and the GEO accession number is GSE55191 (http:// www.ncbi.nlm.nih.gov/geo/query/acc.cgi?acc = GSE55191). Path-way analysis and GO analysis were applied to determine the roles of these differentially expressed mRNAs played in these biological pathways or GO terms. Differentially regulated mRNAs were uploaded into the Database for Annotation, Visualization and Integrated Discovery (DAVID, http://david.abcc.ncifcrf.gov/) to analyze the enrichment of these coding genes. After uploaded 338 seqnames of differentially regulated mRNAs into Functional Annotation Chart, 325 mRNAs were matched to the list. The annotation summary results were shown up by this webserver.
Quantitative real-time polymerase chain reaction (qRT-PCR) validation and Statistical analysis
Total RNA was reverse-transcribed using ImProm II Reverse Transcriptase (Promega) according to the manufacturer’s protocol. Real-time PCR was done with SYBR Premix Ex Taq (TaKaRa) on MX3000p instrument according to the manufacturer’s protocol. Specific primers of each genes are listed in Table S1. The relative fold change was calculated using the 22DDCtmethod normalized to GAPDH. Differences of lncRNAs between tumor and normal were analyzed using paired t-test. P value,0.05 was considered as statistically significant.
Co-expression network construction
The lncRNA-mRNA co-expression network was constructed based on the correlation between the differentially expressed lncRNAs and mRNAs. The algorithm was quoted from previously described report [24]. Red ellipse represents as down-regulated lncRNA, green diamond represents as down-regulated mRNA, blue ellipse represents as up-regulated lncRNA, black diamond represents as up-regulated mRNA. Solid lines represent positive correlation, dotted lines represent negative correlation.
Results
Expression profile of lncRNAs and mRNAs in HCC Fold-change (Tumor vs Normal) andP value were calculated from the normalized expression. Using microarray analysis, we identified 214 lncRNAs and 338 mRNAs to be significantly
differentially expressed in three HCC samples compared with their adjacent NT samples (Fold Change$2.0 or#0.5, p,0.05 and FDR,0.05). Among these, 166 lncRNAs and 219 mRNAs were identified to be consistently upregulated in all three HCC groups, and 48 lncRNAs and 119 mRNAs were consistently downregu-lated (Table S2). The expression of ENST00000448647 (Log2 Fold Change T/N = 7.8561822) was significantly upregulated, while the expression of ENST00000504368 (Log2 Fold Change T/N =27.4821358) was dramatically downregulated. The num-ber of deregulated lncRNAs and mRNAs varied in different patients (Table 2, 3). These lncRNAs may play important roles in the occurrence and development of HCC.
LncRNA Classification and Subgroup Analysis
According to previous reports, lncRNAs can be classified into different subgroups, such as HOX lncRNAs, lncRNAs with enhancer-like function (lncRNA-a) and large intergenic noncoding RNAs (lincRNAs) [25,26]. We carried out lncRNA classification and subgroup analysis to further investigate potential functions of these HCC associated lncRNAs.
Rinnet al.have identified a total of 407 discrete lncRNAs within the four human homeobox transcription factors (HOX) clusters, partitioned into 101 known HOX gene exons, 75 introns and 231 intergenic transcripts [26]. Among them, 6 of coding transcripts and 4 of noncoding transcripts were differentially expressed in three sets of HCC samples (Table S3).
Using the GENCODE annotation [27] of the human genome, Orom et al. have defined a set of lncRNAs with enhancer-like function in human cell lines [25]. Depletion of these lncRNAs led to decreasing expression of their neighboring protein-coding genes. The profiling data showed that 506 such lncRNAs were detected, while 26 of them were differentially expressed. Among these 26 lncRNAs, 15 were located in nearby aberrantly expressed coding genes (distance ,300 kb) (Table S4, S5), implying that these lncRNAs might be regulators of their neighboring coding genes in HCC cells.
By analyzing chromatin-state maps, Rinn and his colleagues have identified,3,300 lincRNAs with clear evolutionary conser-vation and association with diverse biological processes, including cell proliferation, immune surveillance, cell-cycle regulation and embryonic stem cell pluripotency [28,29]. The profiling data indicated that 46 of such lincRNAs were dysregulated in HCC samples, and 35 among them were located in nearby aberrantly expressed coding genes (distance,300 kb) (Table S6, S7).
Bioinformatic analysis of mRNAs expression in HCC Up to 12,751 coding transcripts could be detected in three pairs of samples through 30,215 coding transcripts probes. 338 mRNAs were differentially expressed in all three pairs of samples. Using DAVID Functional Annotation Chart, we analyzed the enrich-ment of these 338 differentially regulated mRNAs (Table S8). The result showed that the most significant functional groups consisted Table 1.Clinical Characteristics of the Patients.
Patient No. Age Gender Tumer Size (cm*cm*cm) HBsAg HCV-Ab Cirrhosis
H1 37 M 16*4*8 Positive Negative Yes
H2 64 M 8*5*4 Negative Positive No
H3 52 M 7*7*7 Positive Negative Yes
of metabolic process, cellular component organization, cell cycle and response to chemical stimulus (Figure 2). Liver is a highly metabolic organ balancing various biological processes. Its disorder is an important cause for the development and progression of HCC [30]. Specific nutrients or metabolites are associated with increased HCC risk. Recent data have suggested that several metabolic regulatory drugs may have the potential to decrease the incidence of HCC [31,32].
Genomic location of these differentially expressed lncRNAs
The functional characterization of these lncRNAs presents a formidable task, and some evidences suggested that lncRNAs regualte high order chromosomal dynamics, sub-cellular structural organization and telomere biology [33]. LncRNAs have been dedicated to originate from complex loci that include lncRNAs and associated protein-coding genes. For example, a number of lncRNAs have been reported to regulate the expression of adjacent protein-coding genes [34,35]. The relationship of lncRNAs and its nearby coding gene identified here includes bidirectional, exon overlapping, intergenic, intro sense-overlapping, intronic antisense and natural antisense. Among the 214 consistently regulated lncRNAs in three sets of HCC samples, including 29 directional sequences (23 upregulated and 6 downregulated), 18 exon sense-overlapping sequences (16 upre-gulated and 2 downreupre-gulated), 120 intergenic sequences (93 upregulated and 27 downregulated), 4 intro sense-overlapping sequences (3 upregulated and 1 down regulated), 29 inronic antisense (19 upregulated and 10 downregulated) and 27 natural antisense (23 upregulated and 4 downregulated). Such information about these lncRNAs and their nearby coding genes might be useful to predict their functional roles in HCC (Table S2).
Construction of the lncRNA-mRNA Co-expression Network
In order to ascertain the correlation between differentially expressed lncRNA and mRNA in HCC, we constructed a lncRNA-mRNA co-expression network as described [24]. Pearson correlation coefficients between all aberrant lncRNAs and mRNAs were calculated. Using P-value ,0.001 and absolute value of correlation coefficient $0.99, we identified 249 pairs of co-expressed lncRNAs and mRNAs composed of 131 mRNAs (39% of all differentially expressed mRNAs) and 103 lncRNAs (48% of all differentially expressed lncRNAs), and 146 pairs presented as positive correlation (Figure S2). LncRNA-mRNA pairs with the highest positive correlation coefficiency included BC016002-ZNF777, ENST00000424412-TUBB2A and CR625009-RPL17. ENST00000444546-CES1 and ENST00000433673, uc.472-PLG had the highest negative correlation coefficiency. This network indicated that one lncRNA could correlate with one to tens of mRNAs and so was the mRNA. Increasing evidences indicated that lncRNAs play roles in gene expression [36]. For example, long intergenic non-coding RNA-p21 activated by p53 mediates global gene repression in the p53 response [37]. Thus, we proposed that the expression profile of mRNAs and lncRNAs are significantly correlated.
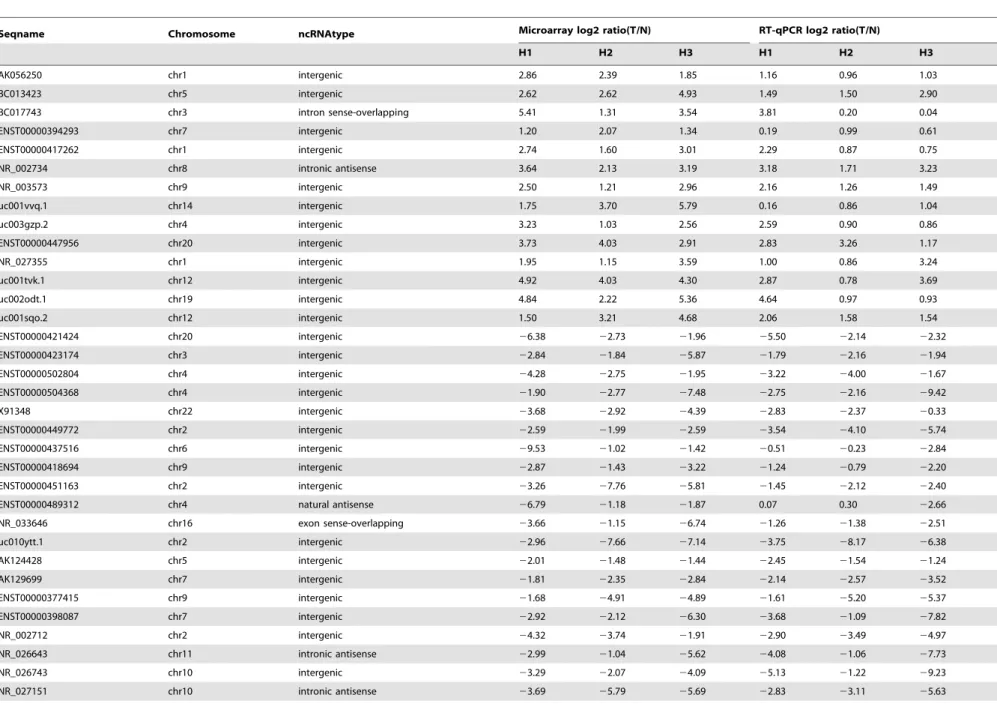
A set of lncRNAs were dysregulated in HCC samples To verify the microarray data, we randomly selected fifty differentially expressed lncRNAs including twenty up-regulated lncRNAs and thirty down-regulated ones and validated their expression levels by quantitative RT-PCR (qRT-PCR) in three sets of HCC tissues. The result showed that the expression patterns of forty lncRNAs were consistent with the microarray data (Table 4). Subsequently, eight lncRNAs from these forty were Table 2.Number of aberrantly expressed lncRNAs in microarray for three pairs of HCC and adjacent non-tumor tissues.
Sample ID Long noncoding RNA
Fold change 2–4 Fold change 4–6 Fold change.6 Total Aberrant lncRNAs
H1 up 1917 461 335 2713 4369
down 1120 235 301 1656
H2 up 1393 301 240 1934 3312
down 1033 177 168 1378
H3 up 1314 665 1901 3880 7093
down 1898 628 687 3213
doi:10.1371/journal.pone.0101707.t002
Table 3.Number of aberrantly expressed mRNAs in microarray for three pairs of HCC and adjacent non-tumor tissues.
Sample ID Message RNA
Fold change 2–4 Fold change 4–6 Fold change.6 Total Changed mRNAs
H1 up 2295 487 428 3210 6077
down 1852 419 596 2867
H2 up 2001 380 326 2707 5132
down 1595 381 449 2425
H3 up 1831 918 2402 5151 10110
down 2709 885 1365 4959
doi:10.1371/journal.pone.0101707.t003
LncRNA Expression Profile in HCC
evaluated in the nineteen pairs of HCC and adjacent NT samples using qRT-PCR (Table S9). The results showed that BC017743, ENST00000395084, NR_026591, NR_015378 and NR_024284 were up-regulated and NR_027151, AK056988 and uc003yqb.1
were down-regulated in HCC samples compared with adjacent NT samples (Figure 3). Additionally, microarray data also provided the nearby coding gene of these differentially expressed lncRNAs (Table S10). We found that the changing trend of Figure 2. Gene ontology (GO) enrichment analysis for differentially regulated mRNAs.(A) GO analysis of mRNAs according to biological process. (B) GO analysis of mRNAs according to cellular component. (C) GO analysis of mRNAs according to molecular function.
Table 4.Quantitative RT-PCR confirmation for selected forty lncRNAs.
Seqname Chromosome ncRNAtype Microarray log2 ratio(T/N) RT-qPCR log2 ratio(T/N)
H1 H2 H3 H1 H2 H3
AK056250 chr1 intergenic 2.86 2.39 1.85 1.16 0.96 1.03
BC013423 chr5 intergenic 2.62 2.62 4.93 1.49 1.50 2.90
BC017743 chr3 intron sense-overlapping 5.41 1.31 3.54 3.81 0.20 0.04
ENST00000394293 chr7 intergenic 1.20 2.07 1.34 0.19 0.99 0.61
ENST00000417262 chr1 intergenic 2.74 1.60 3.01 2.29 0.87 0.75
NR_002734 chr8 intronic antisense 3.64 2.13 3.19 3.18 1.71 3.23
NR_003573 chr9 intergenic 2.50 1.21 2.96 2.16 1.26 1.49
uc001vvq.1 chr14 intergenic 1.75 3.70 5.79 0.16 0.86 1.04
uc003gzp.2 chr4 intergenic 3.23 1.03 2.56 2.59 0.90 0.86
ENST00000447956 chr20 intergenic 3.73 4.03 2.91 2.83 3.26 1.17
NR_027355 chr1 intergenic 1.95 1.15 3.59 1.00 0.86 3.24
uc001tvk.1 chr12 intergenic 4.92 4.03 4.30 2.87 0.78 3.69
uc002odt.1 chr19 intergenic 4.84 2.22 5.36 4.64 0.97 0.93
uc001sqo.2 chr12 intergenic 1.50 3.21 4.68 2.06 1.58 1.54
ENST00000421424 chr20 intergenic 26.38 22.73 21.96 25.50 22.14 22.32
ENST00000423174 chr3 intergenic 22.84 21.84 25.87 21.79 22.16 21.94
ENST00000502804 chr4 intergenic 24.28 22.75 21.95 23.22 24.00 21.67
ENST00000504368 chr4 intergenic 21.90 22.77 27.48 22.75 22.16 29.42
X91348 chr22 intergenic 23.68 22.92 24.39 22.83 22.37 20.33
ENST00000449772 chr2 intergenic 22.59 21.99 22.59 23.54 24.10 25.74
ENST00000437516 chr6 intergenic 29.53 21.02 21.42 20.51 20.23 22.84
ENST00000418694 chr9 intergenic 22.87 21.43 23.22 21.24 20.79 22.20
ENST00000451163 chr2 intergenic 23.26 27.76 25.81 21.45 22.12 22.40
ENST00000489312 chr4 natural antisense 26.79 21.18 21.87 0.07 0.30 22.66
NR_033646 chr16 exon sense-overlapping 23.66 21.15 26.74 21.26 21.38 22.51
uc010ytt.1 chr2 intergenic 22.96 27.66 27.14 23.75 28.17 26.38
AK124428 chr5 intergenic 22.01 21.48 21.44 22.45 21.54 21.24
AK129699 chr7 intergenic 21.81 22.35 22.84 22.14 22.57 23.52
ENST00000377415 chr9 intergenic 21.68 24.91 24.89 21.61 25.20 25.37
ENST00000398087 chr7 intergenic 22.92 22.12 26.30 23.68 21.09 27.82
NR_002712 chr2 intergenic 24.32 23.74 21.91 22.90 23.49 24.97
NR_026643 chr11 intronic antisense 22.99 21.04 25.62 24.08 21.06 27.73
NR_026743 chr10 intergenic 23.29 22.07 24.09 25.13 21.22 29.23
NR_027151 chr10 intronic antisense 23.69 25.79 25.69 22.83 23.11 25.63
LncRNA
Expression
Profile
in
HCC
PLOS
ONE
|
www.ploson
e.org
6
July
2014
|
Volume
9
|
Issue
7
|
lncRNAs and their nearby coding genes is basically identical through qRT-PCR analysis of a selected number of differentially expressed lncRNAs and their nearby genes (Figure 4). These results provided strong evidence for the point that lncRNAs have intrinsic cis-regulatory capacity to their own locus.
Discussion
HCC is the fifth most common malignancy in human beings, accounting for approximately 90% of primary liver cancers [38]. Hepatocarcinogenesis is a complicated biological process charac-terized by a myriad spectrum of molecular abnormalities. Over the past decades, the molecular mechanism of HCC has been extensively investigated. However, the exact pathogenesis of this disease is still vague. Increasing evidence indicates that lncRNAs may play a significant role in regulating gene expression [39]. LncRNA expression is de-regulated in many types of cancers, such as HOTAIR in breast tumours and metastases, BACE1-AS in Alzheimer’s disease and Gas5 in breast cancer [15,40,41]. Dysregulation of lncRNAs, including H19, HEIH, MVIH, HULC and MEG3, has been identified in HCC [16–18,22]. Some of these lncRNAs were also identified in our microarry data. For example, H19 was downregulated in H1 and H2 tissues. Therefore, it is a critical step to figure out the expression profile of lncRNAs and related mRNAs in HCC in understanding its pathogenesis of HCC.
In this study, we investigated gene expression profiles of HCC by using lncRNA microarray. Compared with previous report [18], which showed hierarchical clustering analysis of 254 mRNAs and 174 lncRNAs that were differentially expressed between five pairs of HCC samples and nontumor samples (all samples using here are HBV-related), we analyzed three pairs of HCC and adjacent non-tumor samples (two patients infected with Hepatitis B, and one infected with Hepatitis C) and identified 214 lncRNAs and 338 mRNAs abnormally expressed in all three HCC tissues (Fold Change $2.0, P,0.05 and FDR,0.05) which is partly different from previous results. This is due to differences in cancerous tissues. Moreover, the microarray which we used is human lncRNA microarray version 2.0, whereas the microarray which was used in the above report is human lncRNA microarray version 1.0. Compared with version 1.0, version 2.0 contains more comprehensive and reliable array content, most extensive and updated coverage available, specific exon or splice junction probes, efficient and robust labeling system and systematic lncRNA classification. According to the absolute expression profile in three pairs of sample, the numbers of significantly differentially expressed lncRNAs and mRNAs (Fold Change$2.0 or#0.5) are 624 and 1050 separately. After statistical analysis (the threshold for deregulated genes was p,0.05 and FDR,0.05), this number decreased to only 214 and 338. This phenomenon might be because the gene expression level varies considerably in different patients. Therefore, this statistical analysis will lead to the results that many important differentially expressed genes have been excluded.
Yang F et al.have confirmed that AY129027, uc002pyc, and DQ786243 were overexpressed, whereas the expression of AK055007 and AK123790 was decreased in 50 paired HCC compared with adjacent NT samples using RT-PCR [18]. In our study, we demonstrated that BC017743, ENST00000395084, NR_026591, NR_015378 and NR_024284 were up-regulated, whereas NR_027151, AK056988 and uc003yqb.1 were down-regulated in nineteen pairs of HCC samples compared with adjacent NT samples using qRT-PCR. Moreover, expression of seven lncRNAs was significantly correlated with their nearby
coding genes which have not been described before. For example, NR_026591 is a 4525 bp exon sense-overlapping lncRNA transcribed from chr5. It is one of the alternatively spliced transcript variants of the RAD1 gene, which encodes a component of the 9-1-1 complex, a heterotrimeric cell cycle checkpoint complex involved in stopping cell cycle progression. NR_026591 and BRIX1 make up a bidirectional transcript pair, expression of which are initiated in opposite directions and in close proximity [42]. QRT-PCR results showed that the expression trend of protein-coding genes (RAD1, BRIX1) and lncRNA (NR_026591) was consistent. We speculate that NR_026591 may have cis-regulatory capacity to their own locus. All the seven lncRNAs (Table S10) are uncharacteristic and associated biological func-tions of them are unclear. The present data will be beneficial to more in-depth exploration of HCC.
LncRNAs are involved in transcriptional regulation of many protein-coding genes. In order to obtain novel insight into the function of lncRNAs, we further combined differentially expressed lncRNAs with differentially expressed mRNAs to construct a co-expression network. Owing to differences of abnormally expressed lncRNAs and mRNAs, the lncRNA-mRNA co-expresion network
is different from the network described in the previous report. We found that many lncRNAs were significantly correlated with multiple protein-coding genes. For example, this network indicat-ed that ZNF777 was associatindicat-ed with BC016002. BC016002 is a 960 bp intergenic lncRNA located on chr7. ZNF777 is involved in transcriptional regulation due to its DNA binding function which is the most significant functional group in the result of GO analysis of differentially regulated mRNAs. Therefore, we hypothesized that ZNF777 may be the direct or indirect target genes of BC016002. This network also indicated that CES1 are predicted to be associated with ENST00000444546. ENST00000444546 is a 1150 bp intergenic lncRNA located on chr1. CES1 encodes a member of the carboxylesterase large family which are responsible for the hydrolysis or transesterification of various xenobiotics. This enzyme is the major liver enzyme and functions in liver drug clearance. Drug clearance which is an important characteristic of CES1 may be critical for the function of ENST00000444546. ENST00000433673 is a 2690 bp intergenic lncRNAs located on chr2 and uc.472 is a 202 bp exon sense-overlapping lncRNA located on chrX. Their correlated gene in co-expression network is PLG. Protein encodes by this gene is plasminogen which is Figure 3. Distribution of eight lncRNAs in nineteen pairs of HCC samples.Selected eight differentially expressed lncRNAs were validated by qPCR in 19 pairs of HCC samples. The heights of the columns in the chart represent the relative concentration of each lncRNA validated across the 19 patients.
doi:10.1371/journal.pone.0101707.g003
LncRNA Expression Profile in HCC
activated by proteolysis and converts to plasmin and angiostatin. Plasmin is an essential protease in a variety of cellular processes including embryonic development, tissue remodeling, tumor invasion and inflammation. Angiostatin is an angiogenesis
inhibitor that blocks neovascularization and growth of primary and metastatic tumors. This characteristic indicates that ENST00000433673 and uc.472 may be associate with PLG to exert its function in HCC. The lncRNA and mRNA co-expression Figure 4. Consistency of lncRNAs and their nearby genes expression level.Selected seven differentially expressed lncRNAs and their nearby genes were validated by qPCR in 19 pairs of HCC samples. The heights of the columns in the chart represent the log2 fold changes (T/N) in expression across the 19 patients for each of the seven lncRNAs validated.
network provides a strong foundation for predicting the function of lncRNA. The malfunction of regulation in this co-expression network may be a possible step for development and progression of HCC. The precise molecular mechanisms have yet to be defined.
In conclusion, we described the expression profile of lncRNAs and mRNAs in HCC by microarray and identified 214 lncRNAs and 338 mRNAs abnormally expressed in all three HCC tissues (Fold Change $2.0, P,0.05 and FDR,0.05). After qRT-PCR verification, we demonstrated for the first time that BC017743, ENST00000395084, NR_026591, NR_015378 and NR_024284 were up-regulated, whereas NR_027151, AK056988 and uc003yqb.1 were down-regulated in nineteen pairs of HCC samples compared with adjacent NT samples. Moreover, expres-sion of seven lncRNAs was significantly correlated to their nearby coding genes, suggesting these lncRNAs may play roles in HCC cells by regulating their nearby coding genes. For these dysregulated lncRNAs, we carried out lncRNA classification and subgroup analysis, and constructed lncRNA-mRNA co-expression network. Such information would be used for investigating the functions of these lncRNA in the occurrence and development of HCC. Our results revealed a penetrating layer of lncRNA of biological significance in pathologies of HCC, thereby pointing intriguing directions for further research.
Supporting Information
Figure S1 Results of RNA quantity and quality. (PDF)
Figure S2 LncRNA-mRNA co-expression network. 249 pairs of co-expressed lncRNAs and mRNAs composed of 131 mRNAs and 103 lncRNAs, and 146 pairs presented as a positive correlation. Pearson correlation coefficients between all aberrant lncRNAs and mRNAs were calculated, p-value,0.001 and absolute value of correlation coefficient$0.99. Red ellipse represents as down-regulated lncRNA, green diamond represents as down-down-regulated mRNA, blue ellipse represents as up-regulated lncRNA, black diamond represents as up-regulated mRNA. Solid lines represent positive correlation, dotted lines represent negative correlation. (PDF)
Table S1 Primers used for qRT-PCR. (XLSX)
Table S2 Common Differentially Expressed mRNAs and lncRNAs in three HCC samples.
(XLSX)
Table S3 HOX cluster profiling. (XLSX)
Table S4 Enhancer LncRNAs profiling. (XLSX)
Table S5 Enhancer LncRNAs nearby coding gene data. (XLSX)
Table S6 Rinn lincRNAs profiling. (XLS)
Table S7 LincRNAs nearby coding gene data. (XLS)
Table S8 Functional classification of mRNAs by GO. (XLSX)
Table S9 gCt values of lncRNAs in nineteen pairs of HCC samples and p value.
(XLSX)
Table S10 Seven differentially expressed lncRNAs and their nearby coding genes.
(XLSX)
Acknowledgments
We thank Dr. Shuai Li from Tianjin Medical University Cancer Institute and Hospital for modifying context of this manuscript.
Author Contributions
Conceived and designed the experiments: JJZ XFZ YGW HJF. Performed the experiments: JJZ SSL. Analyzed the data: FQY JJZ. Contributed reagents/materials/analysis tools: JJZ SSL FQY YS YT JZ YHJ. Wrote the paper: JJZ.
References
1. Jemal A, Ward E, Hao Y, Thun M (2005) Trends in the leading causes of death in the United States, 1970–2002. JAMA 294: 1255–1259.
2. Bosch FX, Ribes J, Diaz M, Cleries R (2004) Primary liver cancer: worldwide incidence and trends. Gastroenterology 127: S5–S16.
3. Bosch FX, Ribes J, Borras J (1999) Epidemiology of primary liver cancer. Semin Liver Dis 19: 271–285.
4. Hao K, Luk JM, Lee NP, Mao M, Zhang C, et al. (2009) Predicting prognosis in hepatocellular carcinoma after curative surgery with common clinicopathologic parameters. BMC Cancer 9: 389.
5. Ponting CP, Oliver PL, Reik W (2009) Evolution and functions of long noncoding RNAs. Cell 136: 629–641.
6. Prensner JR, Chinnaiyan AM (2011) The emergence of lncRNAs in cancer biology. Cancer Discov 1: 391–407.
7. Kowalczyk MS, Higgs DR, Gingeras TR (2012) Molecular biology: RNA discrimination. Nature 482: 310–311.
8. Meng F, Henson R, Wehbe-Janek H, Ghoshal K, Jacob ST, et al. (2007) MicroRNA-21 regulates expression of the PTEN tumor suppressor gene in human hepatocellular cancer. Gastroenterology 133: 647–658.
9. Song K, Han C, Zhang J, Lu D, Dash S, et al. (2013) Epigenetic regulation of miR-122 by PPARgamma and hepatitis B virus X protein in hepatocellular carcinoma cells. Hepatology 58: 1681–92.
10. Zhang L, Yang L, Liu X, Chen W, Chang L, et al. (2013) MicroRNA-657 promotes tumorigenesis in hepatocellular carcinoma by targeting transducin-like enhancer protein 1 through nuclear factor kappa B pathways. Hepatology 57: 1919–1930.
11. Giordano S, Columbano A (2013) MicroRNAs: new tools for diagnosis, prognosis, and therapy in hepatocellular carcinoma? Hepatology 57: 840–847. 12. Wang KC, Chang HY (2011) Molecular mechanisms of long noncoding RNAs.
Mol Cell 43: 904–914.
13. Gupta RA, Shah N, Wang KC, Kim J, Horlings HM, et al. Long non-coding RNA HOTAIR reprograms chromatin state to promote cancer metastasis. Nature 464: 1071–1076.
14. Johnson R (2012) Long non-coding RNAs in Huntington’s disease neurode-generation. Neurobiol Dis 46: 245–254.
15. Faghihi MA, Modarresi F, Khalil AM, Wood DE, Sahagan BG, et al. (2008) Expression of a noncoding RNA is elevated in Alzheimer’s disease and drives rapid feed-forward regulation of beta-secretase. Nat Med 14: 723–730. 16. Yuan SX, Yang F, Yang Y, Tao QF, Zhang J, et al. (2012) Long non-coding
RNA-MVIH promotes angiogenesis and serves as a predictor for HCC patients’ poor recurrence-free survival after hepatectomy. Hepatology 56: 2231–41. 17. Matouk IJ, DeGroot N, Mezan S, Ayesh S, Abu-lail R, et al. (2007) The H19
non-coding RNA is essential for human tumor growth. PLoS One 2: e845. 18. Yang F, Zhang L, Huo XS, Yuan JH, Xu D, et al. (2011) Long noncoding RNA
high expression in hepatocellular carcinoma facilitates tumor growth through enhancer of zeste homolog 2 in humans. Hepatology 54: 1679–1689. 19. Panzitt K, Tschernatsch MM, Guelly C, Moustafa T, Stradner M, et al. (2007)
Characterization of HULC, a novel gene with striking up-regulation in hepatocellular carcinoma, as noncoding RNA. Gastroenterology 132: 330–342. 20. Lai MC, Yang Z, Zhou L, Zhu QQ, Xie HY, et al. (2011) Long non-coding RNA MALAT-1 overexpression predicts tumor recurrence of hepatocellular carcinoma after liver transplantation. Med Oncol 29: 1810–6.
21. Braconi C, Valeri N, Kogure T, Gasparini P, Huang N, et al. (2011) Expression and functional role of a transcribed noncoding RNA with an ultraconserved element in hepatocellular carcinoma. Proc Natl Acad Sci U S A 108: 786–791. 22. Braconi C, Kogure T, Valeri N, Huang N, Nuovo G, et al. (2011) microRNA-29 can regulate expression of the long non-coding RNA gene MEG3 in hepatocellular cancer. Oncogene 30: 4750–6.
LncRNA Expression Profile in HCC
23. Xu C, Liu S, Fu H, Li S, Tie Y, et al. (2010) MicroRNA-193b regulates proliferation, migration and invasion in human hepatocellular carcinoma cells. Eur J Cancer 46: 2828–2836.
24. Yu G, Yao W, Wang J, Ma X, Xiao W, et al. (2012) LncRNAs expression signatures of renal clear cell carcinoma revealed by microarray. PLoS One 7: e42377.
25. Orom UA, Derrien T, Beringer M, Gumireddy K, Gardini A, et al. (2010) Long noncoding RNAs with enhancer-like function in human cells. Cell 143: 46–58. 26. Rinn JL, Kertesz M, Wang JK, Squazzo SL, Xu X, et al. (2007) Functional demarcation of active and silent chromatin domains in human HOX loci by noncoding RNAs. Cell 129: 1311–1323.
27. Harrow J, Denoeud F, Frankish A, Reymond A, Chen CK, et al. (2006) GENCODE: producing a reference annotation for ENCODE. Genome Biol 7 Suppl 1: S4 1–9.
28. Guttman M, Amit I, Garber M, French C, Lin MF, et al. (2009) Chromatin signature reveals over a thousand highly conserved large non-coding RNAs in mammals. Nature 458: 223–227.
29. Khalil AM, Guttman M, Huarte M, Garber M, Raj A, et al. (2009) Many human large intergenic noncoding RNAs associate with chromatin-modifying complexes and affect gene expression. Proc Natl Acad Sci U S A 106: 11667– 11672.
30. Puszyk WM, Trinh TL, Chapple SJ, Liu C (2013) Linking metabolism and epigenetic regulation in development of hepatocellular carcinoma. Lab Invest 93: 983–990.
31. Paradis V, Zalinski S, Chelbi E, Guedj N, Degos F, et al. (2009) Hepatocellular carcinomas in patients with metabolic syndrome often develop without significant liver fibrosis: a pathological analysis. Hepatology 49: 851–859. 32. Smith RJ (2013) Nutrition and metabolism in hepatocellular carcinoma.
Hepatobiliary Surg Nutr 2: 89–96.
33. Amaral PP, Mattick JS (2008) Noncoding RNA in development. Mamm Genome 19: 454–492.
34. Martianov I, Ramadass A, Serra Barros A, Chow N, Akoulitchev A (2007) Repression of the human dihydrofolate reductase gene by a non-coding interfering transcript. Nature 445: 666–670.
35. Feng J, Bi C, Clark BS, Mady R, Shah P, et al. (2006) The Evf-2 noncoding RNA is transcribed from the Dlx-5/6 ultraconserved region and functions as a Dlx-2 transcriptional coactivator. Genes Dev 20: 1470–1484.
36. Mercer TR, Dinger ME, Mattick JS (2009) Long non-coding RNAs: insights into functions. Nat Rev Genet 10: 155–159.
37. Huarte M, Guttman M, Feldser D, Garber M, Koziol MJ, et al. A large intergenic noncoding RNA induced by p53 mediates global gene repression in the p53 response. Cell 142: 409–419.
38. El-Serag HB, Rudolph KL (2007) Hepatocellular carcinoma: epidemiology and molecular carcinogenesis. Gastroenterology 132: 2557–2576.
39. Pan YF, Feng L, Zhang XQ, Song LJ, Liang HX, et al. (2011) Role of long non-coding RNAs in gene regulation and oncogenesis. Chin Med J (Engl) 124: 2378– 2383.
40. Gupta RA, Shah N, Wang KC, Kim J, Horlings HM, et al. (2010) Long non-coding RNA HOTAIR reprograms chromatin state to promote cancer metastasis. Nature 464: 1071–1076.
41. Mourtada-Maarabouni M, Pickard MR, Hedge VL, Farzaneh F, Williams GT (2009) GAS5, a non-protein-coding RNA, controls apoptosis and is downreg-ulated in breast cancer. Oncogene 28: 195–208.