Photosynthetic Response of Soybean to
Microclimate in 26-Year-Old Tree-Based
Intercropping Systems in Southern Ontario,
Canada
Xiaobang Peng1,2*, Naresh V. Thevathasan2, Andrew M. Gordon2, Idris Mohammed2, Pengxiang Gao3
1Department of Biological and Medical Engineering, Shangluo University, Shangluo, Shaanxi, China, 2School of Environmental Sciences, University of Guelph, Guelph, Ontario, Canada,3College of Forestry, Northwest A&F University, Yangling, Shaanxi, China
Abstract
In order to study the effect of light competition and microclimatic modifications on the net as-similation (NA), growth and yield of soybean (Glycine maxL.) as an understory crop, three 26-year-old soybean-tree (Acer saccharinumMarsh.,Populus deltoides X nigra,Juglans nigraL.) intercropping systems were examined. Tree competition reduced photosynthetical-ly active radiation (PAR) incident on soybeans and reduced net assimilation, growth and yield of soybean. Soil moisture of 20 cm depth close (<3 m) to the tree rows was also re-duced. Correlation analysis showed that NA and soil water content were highly correlated with growth and yield of soybean. When compared with the monoculture soybean system, the relative humidity (RH) of the poplar-soybean, silver maple-soybean, and black walnut-soybean intercropped systems was increased by 7.1%, 8.0% and 5.9%, soil water content was reduced by 37.8%, 26.3% and 30.9%, ambient temperature was reduced by 1.3°C, 1.4°C and 1.0°C, PAR was reduced by 53.6%, 57.9% and 39.9%, and air CO2
concentra-tion was reduced by 3.7μmolmol-1, 4.2μmolmol-1and 2.8μmolmol-1, respectively.
Com-pared to the monoculture, the average NA of soybean in poplar, maple and walnut treatments was also reduced by 53.1%, 67.5% and 46.5%, respectively. Multivariate step-wise regression analysis showed that PAR, ambient temperature and CO2concentration
were the dominant factors influencing net photosynthetic rate.
Introduction
Agroforestry, a conservation land management practice where trees, agricultural crops, grasses and/or animals are grown simultaneously on the same landscape, is being promoted as an al-ternative management system that can diversify income and improve environmental quality and environmental benefits on the farm landscape [1,2]. These land-use systems provide
OPEN ACCESS
Citation:Peng X, Thevathasan NV, Gordon AM, Mohammed I, Gao P (2015) Photosynthetic Response of Soybean to Microclimate in 26-Year-Old Tree-Based Intercropping Systems in Southern Ontario, Canada. PLoS ONE 10(6): e0129467. doi:10.1371/journal.pone.0129467
Academic Editor:Jonathan A Coles, Glasgow University, UNITED KINGDOM
Received:November 15, 2014
Accepted:May 10, 2015
Published:June 8, 2015
Copyright:© 2015 Peng et al. This is an open access article distributed under the terms of the
Creative Commons Attribution License, which permits unrestricted use, distribution, and reproduction in any medium, provided the original author and source are credited.
Data Availability Statement:All relevant data are within the paper.
various products and benefits for household and national economies including food and me-dicinal products for humans and animals, timber for construction and fuel, and cash income.
Agroforestry originated in developing countries as a result of high population densities coupled with scarce land resources. Because of the ecological, social and economic benefits as-sociated with agroforestry compared with traditional forestry and agricultural practices, many developing countries and regions have adopted this land-use system [3,4]. More recently, de-veloped countries in temperate regions (e.g. U.S.A., Canada, Great Britain and Australia) have begun to develop and promote agroforestry systems [5–7]. In southern Ontario, over the past 25 years, investigations on tree-based intercropping systems have revealed the presence of sev-eral complementary biophysical interactions associated with this land-use system [8,9].
Although“tree-influenced microclimatic modifications may act in such a way as to increase the overall productivity of the associated agricultural crop”[9], biophysical interactions are likely to change and become modified as the perennial tree component of the system ages. This study was designed to investigate net assimilation (NA) and photosynthetically active radiation (PAR) associated with an understory soybean crop and microclimatic parameters in three 26-year-old hardwood-based intercropping systems. Our results are compared to those of Rey-nolds et al. [10] when the same systems were only 12-year-old.
Materials and Methods
Site description and plant materials
The 30-ha study site is located at the Guelph Agroforestry Research Station in Wellington County (43°32028@N Lat., 80°12032@W Long., elevation 334 m a.s.l.) near Guelph, southern On-tario, Canada. No specific permissions were required for this location and the field studies did not involve endangered or protected species. Eight hardwood and two coniferous species have been annually intercropped with several annual crops at the research site. For this study, soy-beans (Glycine maxL.) were intercropped under 26-year-old hybrid poplar (Populus deltoides x nigra var'DN-177'), silver maple (Acer saccharinumMarsh.), and black walnut (Juglans nigra L.) and compared to the same systems described by Reynolds et al. [10] when the trees were 12 years old. The tree rows are oriented approximately north and south, with each species planted in groups of eight trees. Tree rows were initially approximately 1 m in width (i.e., 6.7% of the available land area). Soils of the study area are from the Guelph Loam series and the texture ranges from silt loam to loam (Order: Alfisols, group: Typic Hapludalf) [9].
In this study, soybean, a C3species, was intercropped with hybrid poplar, silver maple and
black walnut, or grown by themselves in the absence of trees, for a total of four treatments. In the experiment, all tree species chosen were planted with a within-row spacing of 6 m and a be-tween-row spacing of 15 m. The characteristics of selected poplar, maple and walnut trees in-tercropped with soybeans in 1997 and 2012 (when the trees were 12- and 26-year-old) are given inTable 1.
Soybeans were grown at a spacing of approximately 0.2 m within rows and 0.3 m between rows for each treatment. For each treatment with trees, three trees were sampled, with 18 sam-ple locations chosen around each tree, at 2 m, 4 m and 6 m east and west of the tree (primary axis perpendicular to the tree row) and at 2 m north and south of each location of the primary axis (Fig 1). For the control treatment, three sample locations were randomly taken.
Collection and measurement of photosynthetic data
A portable photosynthesis system (LI-6400; LI-COR, Inc., Lincoln, NE, USA) with a red/blue LED light source (LI6400-02B) mounted onto a 6 cm2clamp-on leaf chamber was used to de-termine NA in sunny and windless weather. A single leaf from the upper canopy of the each
had no role in study design, data collection and analysis, decision to publish, or preparation of the manuscript.
soybean was measured at every location (18 in total per tree species) during five clear sunny days between 09:00 and 17:00 at 2 hour intervals in July 2012 (July 4, 5, 6, 8, 10). PAR, ambient temperature, humidity and CO2concentration were also measured concurrently with the
LI-6400 Photosynthesis System.
Soil moisture
Soil was sampled in July, 2012, using a soil auger; soil gravimetric moisture content was mea-sured at a depth of 0 to 20 cm, with soil samples taken from all locations described inFig 1.
Measurements of soybean growth, biomass, and yield
A single soybean plant was sampled at each of the 18 locations (i.e. poplar, maple, walnut) and three plants in the control treatment on July 28 and 29 of 2012. A total of 57 soybean plants were harvested. Plants were taken to the lab, where above-ground dry weights, leaf number,
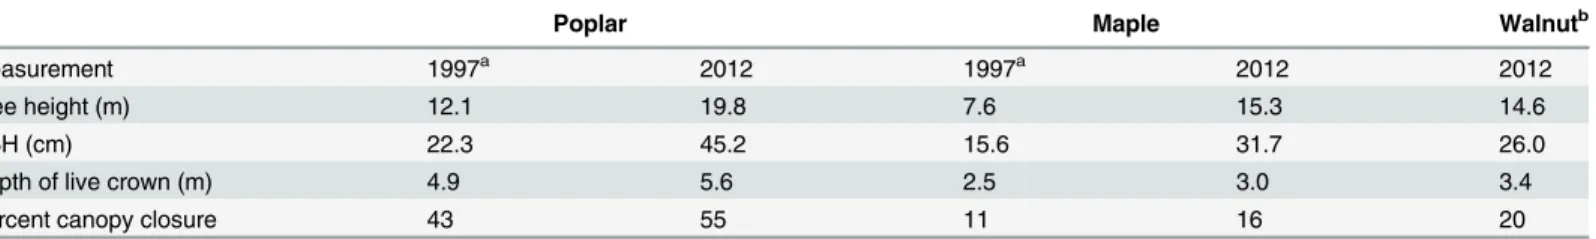
Table 1. 12 and 26-year-old trees (1997 and 2012, respectively) intercropped with soybean at the same study site.
Poplar Maple Walnutb
Measurement 1997a 2012 1997a 2012 2012
Tree height (m) 12.1 19.8 7.6 15.3 14.6
DBH (cm) 22.3 45.2 15.6 31.7 26.0
Depth of live crown (m) 4.9 5.6 2.5 3.0 3.4
Percent canopy closure 43 55 11 16 20
Note: DBH is the diameter at breast height of tree.
a
Data of 1997 adapted from Simpson [22].
b1997 data not measured.
doi:10.1371/journal.pone.0129467.t001
Fig 1. Sampling locations from the tree row into the cropping alley.The crop like symbol refer to sample plot.
plant height, whole plant leaf area and whole plant leaf oven-dried (70°C) weights were deter-mined. Leaf areas were determined using a LI-COR 3100 Leaf Area Meter (LI-COR, Inc., Lin-coln, NE, USA).
106 days after planting (15 September 2012), a 1 m2area of soybeans on both sides of the tree rows and in the control treatment were harvested for the determination of aboveground biomass (dry weight basis, 70°C drying temperature and dried for 1 week). Yield was reported on a per hectare basis and does not represent land lost due to tree production.
Data visualization and analysis
An analysis of variance (ANOVA) was performed as needed, using the statistical software SPSS 12.0.1 for Windows XP. One-way ANOVA’S were performed on soybean data to determine treatment differences for environmental, physiological, and various crop productivity parame-ters. Within each treatment, differences for crop productivity parameters, daily environmental parameters, and daily physiological parameters for the three major locations (2, 4 and 6 m) were also analyzed using ANOVA. Correlation analysis was performed on mean daily net as-similation, crop growth, biomass, and yield of soybean with environmental and physiological parameters. Multivariate stepwise regression was utilized to investigate the relationship be-tween microenvironmental factors and net assimilation of soybean.
Results
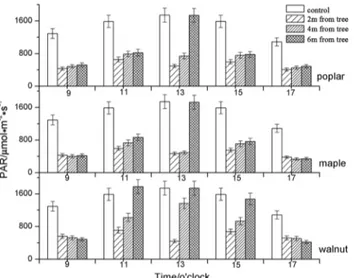
PAR impacting soybean in the different intercropping systems (poplar, maple and walnut) was all lower than that of the control treatment at two hour intervals from 9:00 to 17:00 hours (as shown inFig 2).
According toTable 2, the total solar radiation reaching the upper parts of soybean canopies in the different intercropping systems (677.3, 614.7, 877.3μmols-1m-2) was lower than that in
control treatment (1460μmols-1m-2). The PAR of all treatments increased with the distance (2,
4 and 6 m) from the tree row (Table 3).
Compared to the control treatment, the average PAR (2 m, 4 m and 6 m) on soybean under poplar, maple and walnut agroforestry systems was reduced by 53.6%, 57.9% and 39.9%, re-spectively. The results showed that the reduction of PAR on the understory soybean, as
Fig 2. Diurnal PAR for soybean in control plots and within 2 m, 4 m and 6 m of poplar, maple and walnut.Values presented are means (N = 4), error bars indicate the standard error of the mean.
influenced by the different tree species, varied and that the lowest incidence of PAR was found closer to the tree rows. The greatest shading was observed under poplar and maple intercrop-ping systems compared to the walnut system.
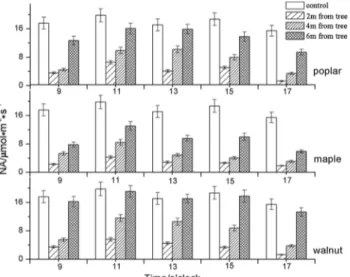
The net assimilation of soybean under different treatments (poplar, maple and walnut) was all lower than that in the control treatment at different time periods in the day (Fig 3,Table 2).
The general trend was that the highest net assimilation was at 6 m from the tree row, fol-lowed by 4 m and 2 m from the tree row (Table 3). In addition, NA of soybean within different intercropping systems did not show any“midday depression of photosynthesis”, a phenome-non which was observed in the monocropping system between 12 noon and 2 pm. Compared to the control treatment, the average NA of soybean in poplar, maple and walnut treatments was reduced by 53.1%, 67.5% and 46.5%, respectively (Table 3).
Plant height, whole plant leaf area and whole plant leaf weight of soybean in the poplar, maple and walnut treatments were lower than the same parameters measured in the control
Table 2. Differences in measured parameters associated with soybean plants in three intercropping treatments and monoculture control 12 (1997) and 26 (2012) years after establishing poplar, maple and walnut intercropping systems.
Measurement 1997 2012
Control Poplar Maple Control Poplar Maple Walnut
PAR (μmol s-1m-2) 1525.0a 1251.8a 1301.8a 1460a 677.3b 614.7b 877.3b
Daily net assimilation(μmol m-2s-1) 18.6a 14.8a 14.7a 17.73a* 8.31b* 5.76b 9.48b*
Height (cm) 79.1a* 56.5b* 56.9b* 77.7a 28.8b 31.4b 33.4b
Whole plant leaf area (cm2) 933.2a* 474.1b* 506.7b* 858.6a 307.2b 317.6b 479.7b
Whole plant leaf weight (gm) 3.6a 1.8b 1.9b 3.56a 1.83b 1.76b 2.00b
Total above-ground biomass (gm) 9.2a 4.6b 5.0b 8.97a 3.06b 3.92b* 4.58b*
Seed yield (tha-1) 2.59a 1.50b 1.67b 2.16a 0.61b 0.77b 0.89b
Values are means of (N = 4) 2W, 4W, 6W, 2E, 4E and 6E locations. Within each year, values in each row followed by the same letter are not significantly different (Tukey’s HSD, P<0.05).
*Significant at 10% level.
1997 data adapted from Reynolds [10]. doi:10.1371/journal.pone.0129467.t002
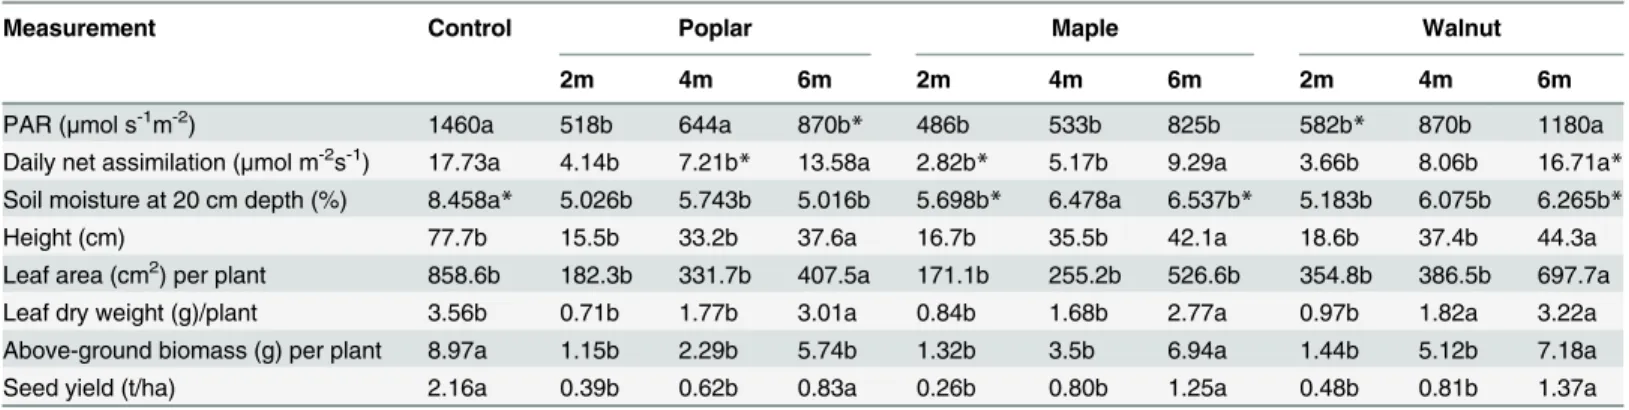
Table 3. Within plot microclimate and soybean responses 2, 4, and 6 m from tree row to three 26-year-old hardwood intercropping systems and monocropped soybeans.
Measurement Control Poplar Maple Walnut
2m 4m 6m 2m 4m 6m 2m 4m 6m
PAR (μmol s-1m-2) 1460a 518b 644a 870b* 486b 533b 825b 582b* 870b 1180a
Daily net assimilation (μmol m-2s-1) 17.73a 4.14b 7.21b* 13.58a 2.82b* 5.17b 9.29a 3.66b 8.06b 16.71a* Soil moisture at 20 cm depth (%) 8.458a* 5.026b 5.743b 5.016b 5.698b* 6.478a 6.537b* 5.183b 6.075b 6.265b*
Height (cm) 77.7b 15.5b 33.2b 37.6a 16.7b 35.5b 42.1a 18.6b 37.4b 44.3a
Leaf area (cm2) per plant 858.6b 182.3b 331.7b 407.5a 171.1b 255.2b 526.6b 354.8b 386.5b 697.7a
Leaf dry weight (g)/plant 3.56b 0.71b 1.77b 3.01a 0.84b 1.68b 2.77a 0.97b 1.82a 3.22a
Above-ground biomass (g) per plant 8.97a 1.15b 2.29b 5.74b 1.32b 3.5b 6.94a 1.44b 5.12b 7.18a
Seed yield (t/ha) 2.16a 0.39b 0.62b 0.83a 0.26b 0.80b 1.25a 0.48b 0.81b 1.37a
Across all treatments (control, poplar, maple, walnut), values in each row followed by the same letter are not significantly different (Tukey’s HSD, P<0.05). *Significant at P<0.10 (10%) level.
treatment (Table 2). Similarly, the study found that the total above-ground biomass and seed yield of soybean in different tree-based treatments were lower when compared with the seed yields derived in the monoculture treatment. From 6 m to 2 m from the tree row, the above five parameters decreased when compared to the values derived from the control treatment (Table 3). Compared with the control treatment, the yield of soybean in poplar, maple and wal-nut treatments was reduced to 71.8%, 64.4% and 58.8%, respectively. The correlation analysis results showed that there was a significant positive correlation between NA and yield (P<0.05).
As shown inTable 3, the soil water content in all three intercropped treatments at 0–20 cm depth was lower than that in the monoculture treatment. There was also a positive correlation between soil water content and soybean aboveground biomass (p<0.05).
When the microclimates of the poplar, maple and walnut intercropping systems were com-pared to that of the monoculture system (Table 4), the relative humidity was increased by 7.1%, 8.0% and 5.9%, soil water content was decreased by 37.8%, 26.3% and 30.9%, atmospher-ic temperature was reduced by 1.3°C, 1.4°C and 1.0°C, PAR was reduced by 53.6%, 57.9% and 39.9% and air CO2concentration was also reduced by 3.7μy 3 mol-1, 4.27tra mol-1and 2.8amol
mol-1, respectively.
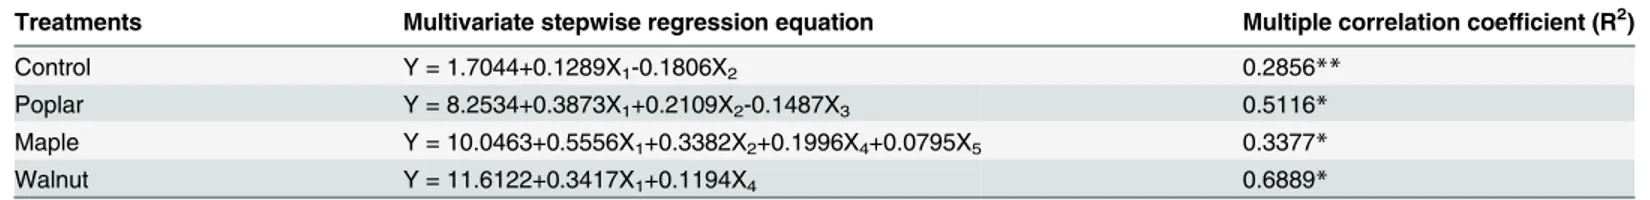
We used multivariate stepwise regression analysis to determine the relationship between soybean NA (Y variable) and microclimatic factors, where X1is PAR, X2is air temperature, X3
is RH, X4is CO2concentration, and X5is soil water content (Table 5).
PAR (X1) is highly correlated (p<0.01) with soybean NA in all intercrop treatments and
less so in the control treatment (p<0.05). Atmospheric temperature (X2) is another relatively
frequent impact factor in addition to photosynthetic active radiation (X1) in the given
equa-tions (Table 5). However, based on the F test (not shown), PAR had greater positive effect on NA rate than the atmospheric temperature. Atmospheric CO2concentration (X4) had a
posi-tive effect on the NA of soybeans only in the maple and walnut treatments. On the other hand, relative humidity (X3) had a negative correlation with the NA rate of soybeans in the poplar
treatment and the soil water content (X5) had a positive correlation on net assimilation rate
only in the maple treatment.
Fig 3. Diurnal NA for soybean in control plots and within 2 m, 4 m and 6 m of poplar, maple and walnut.Values presented are means (N = 4), error bars indicate the standard error of the mean.
Discussion
Plant photosynthesis is a complicated physiological and biochemical process, and it is restrict-ed by many environmental factors such as PAR, atmospheric temperature, atmospheric hu-midity and atmospheric CO2concentration. In our study, intercropping systems were shown
to improve field microclimatic conditions (e.g. reduced atmospheric temperature, increased RH). Given climate change conditions and associated climate extremes, in a dry year, enhanced RH above the understory crop canopy and lower atmospheric temperature may contribute to less evapotranspirative loss from the understory crop. However, PAR and CO2concentrations
measured in the intercropping systems were significantly lower than the same parameters mea-sured in the monocropping system (control). As these two parameters had a positive correla-tion with the net assimilacorrela-tion (NA) of soybeans, this negatively influenced the final soybean above ground biomass and crop yield (Table 2). Similar results and observations have also been reported in other tree-based intercropping experiments [11–15].
The diurnal variation of NA of soybean in the monoculture system was a bimodal curve in our study and an obvious“lunch break”phenomenon was observed; however, in most inter-cropping treatments this phenomenon was not observed (Fig 3). In the control treatment, the NA was found to be lower during the peak PAR readings of the day (13:00) confirming that the
“lunch break”phenomenon has a direct relationship with PAR [16]. However, Raschke and Resemann [17] studied the leaves ofArbutus undeoL. and showed that the photosynthetic
“lunch break”phenomenon can occur at low levels of photosynthetically active radiation (about 500μmol m-2s-1), and that it has a certain relationship with plant growth rhythm and
genetic characteristics. Nevertheless, strong PAR is the basic driving force that causes a variety of changes in environmental factors such as reduced atmospheric humidity and increased at-mospheric temperature, indirectly leading to the photosynthetic“lunch break”phenomenon
Table 4. Differences in a variety of environmental parameters measured (2012) in three intercropping treatments and monoculture control 26 (2012) years after establishing poplar, maple and walnut intercropping systems.
Treatments Environmental Parameters
PARμmols-1m-2 Temperature°C Relative humidity % CO2concentrationμmol mol-1 Soil moisture %
Control 1460.0a 36.57a 48.03b 361.022a 8.458a
Poplar 677.3b 35.32b 51.44a 357.308b 5.262b
Maple 614.7b 35.13b 51.89a 356.837b 6.238b
Walnut 877.3b 35.56b 50.87a 358.236b 5.841b
Values are means of (N = 6) 2W, 4W, 6W, 2E, 4E and 6E locations. Within each measured environmental parameter, values in each column followed by the same letter are not significantly different (Tukey’s HSD, P<0.05).
doi:10.1371/journal.pone.0129467.t004
Table 5. Multiple regression analysis of environmental factors and photosynthetic rates of soybean in different treatments in 2012.
Treatments Multivariate stepwise regression equation Multiple correlation coefficient (R2)
Control Y = 1.7044+0.1289X1-0.1806X2 0.2856**
Poplar Y = 8.2534+0.3873X1+0.2109X2-0.1487X3 0.5116*
Maple Y = 10.0463+0.5556X1+0.3382X2+0.1996X4+0.0795X5 0.3377*
Walnut Y = 11.6122+0.3417X1+0.1194X4 0.6889*
*,**indicate significant at 5% and 1% levels, respectively.
Note: Y is the predicted value of NA, X1is PAR, X2is air temperature, X3is RH, X4is CO2concentration, and X5is soil water content.
[16]. In our study, the temperature in the monoculture soybean experimental plots was as high as 36.57°C (Table 4); this temperature could have caused adverse effects on the photosyn-thetic ability of soybean causing enhanced transpiration, leading to the photosynphotosyn-thetic“lunch break”phenomenon. Interestingly, the significantly lower ambient temperatures measured in all three intercropping treatments (Table 4) did not likely affect the photosynthesis process of the associated understory crop. The moderation of extreme temperatures often seen in tree-based intercropping systems is an important factor. Given the climate extremes that is being experienced and associated with crop losses, integration of trees into agricultural systems may enhance adaptation to climate changes [9] and reduce crop losses. While proper management strategies, such as branch pruning, is adopted to allow more PAR.
Soil water content (0–20 cm) of the intercropping system was significantly lower than that of the monoculture system. The shorter the distance from the trees, the stronger the water competition was between overstory trees and understory crops (Table 3). Reynolds et al. [10] found average soil moisture content to be 6.8% in the intercropping treatments on the same site when trees were only 12-year-old. The current study indicated the average soil moisture under intercropping treatments to be 5.6%. Therefore, it appears that competition for soil water under matured tree-based intercropping systems is unavoidable.
In our study, compared with the control treatment, the PAR under poplar and maple inter-cropping systems was reduced by 53.6% and 57.9%, respectively. In the 1997 study, Reynolds et al. [10] reported that PAR on soybeans under the poplar and maple intercropping systems was only reduced by 17.9% and 14.6%. In the same study, soybean seed yield was also reduced by 42.1% and 35.5%, respectively (Table 2), but in our study, seed yields were reduced by 71.8% and 64.4%, respectively. It is obvious that the growth of trees since 1997 (Table 1) has resulted in increased competition for light and soil water. However, the competition for light and soil water can be reduced with proper design and management such as adopting branch and lateral tree root pruning [9]in tree-based intercropping systems. Working with temperate tree-based intercropping systems in China, Wu and Zhu [18] have recommended that spacing be depen-dent upon the relative value of the crop and the tree. They recommended 5–10 m spacing where wood from the tree is the most valued, 15–20 m where both crops and trees are equally valuable (similar to the tree spacing in this study), and 30–50 m where the understory agricul-tural crop is the most valuable component. Based on their research results, the distance be-tween trees (15 m), as in our study, was the correct distance bebe-tween the tree rows. However, our research results are indicating that when trees get mature (seeTable 1, from 1997 to 2012), a 15 m tree-row spacing may not be the right distance for understory agricultural crops (soy-bean). Therefore, the tree-row distance or spacing should be widened to reduce light and soil water competition and thereby maintain economic crop yields. Changing the design configura-tion by removing alternate trees within rows, or even removing alternate tree rows, should help to reduce competition for light and soil moisture. Another important factor to consider is the choice of the agricultural crop (C3versus C4) to be grown in tree-based intercropping systems.
As plants with a C4photosynthetic pathway are less adapted to shade than those with a C3
pathway, C4understory crops should be avoided under mature tree-based intercropping
Conclusions
It appears that when trees mature competition for moisture and light may become as limiting factors for crop growth. In 1997, when the trees were only 12-year-old, the average soil moisture measurement was 6.8% in the intercropping treatments [10]. The current study was conducted in 2012 and trees are now 26-year-old and the average soil moisture under intercropping treat-ments was 5.6%. When compared with the control treatment (no trees), the PAR under poplar and maple intercropping systems was reduced by 53.6% and 57.9%, respectively. In the 1997 study, at the same experimental site, the PAR on soybeans under poplar and maple intercrop-ping systems was only reduced by 17.9% and 14.6%, respectively [10]. In the same study, soy-beans seed yield was also reduced by 42.1% and 35.5%, respectively, but in our current study the yield was reduced by 71.8% and 64.4%, respectively. It is therefore suggested that for long-term benefits, thinning of trees and/or removing alternate trees rows and cultivation of shade tolerant crops may help to reduce light competition and possibly the competition for soil moisture. These results could be used as guidelines for improving and optimizing productivity in maturing agroforestry systems.
Acknowledgments
The authors wish to express their gratitude to the Chinese Scholarship Council for providing the scholarship to Dr. Peng Xiaobang, which enabled him to undertake this study in the School of Environmental Sciences, University of Guelph, Guelph, Ontario, Canada. Our thanks are also due to Dr. Youbin Zhang, University of Guelph, for his assistance in providing the needed field equipment.
Author Contributions
Conceived and designed the experiments: XP NVT AMG. Performed the experiments: XP NVT AMG IM. Analyzed the data: XP. Contributed reagents/materials/analysis tools: XP AMG IM. Wrote the paper: XP NVT AMG PG.
References
1. Gold MA, Hanover JW. Agroforestry systems for temperate zones. Agrofor Syst. 1987; 5: 109–121. 2. Garrity DP. Agroforestry and the achievement of the millennium development goals. Agrofor Syst.
2004; 61: 5–17.
3. Peng XB, Cai J, Jiang ZM, Zhang YY, Zhang SX. Light competition and productivity of agroforestry sys-tem in loess area of Weibei in Shaanxi. Chinese J Appl Ecol. 2008; 19: 2414–2419.
4. Peng XB, Zhang YY, Cai J, Jiang ZM, Zhang SX. Photosynthesis, growth and yield of soybean and maize in a tree-based agroforestry intercropping system on the Loess Plateau. Agrofor Syst. 2009; 76: 569–577.
5. Buck LE. Agroforestry policy issues and research directions in the US and less developed countries: in-sights and challenges from recent experience. Agrofor Syst. 1995; 30: 57–73.
6. Garrett HE. Agroforestry practice and policy in the United States of America. Forest Ecol Manag. 1997; 91: 5–15.
7. ZinkHan FC, Mercer DE. An assessment of agroforestry systems in the southern USA. Agrofor Syst. 1997; 35: 303–321.
8. Thevathasan NV, Gordon AM. Ecology of tree intercropping systems in the north temperate regrion: Ex-periences from southern ontario, canada. Agroforestry Syst. 2004; 61: 257–268.
9. Thevathasan NV, Gordon AM, Simpson JA, Reynolds PE, Price GW, Zhang P. Biophysical and eco-logical interactions in a temperate tree-based intercropping system. J Crop Improv. 2004; 12: 339– 363.
11. Kang BT, Wilson GF, Sipkens L. Alley cropping maize and leucaena in southern Nigeria. Plant and Soil. 1981; 63: 165–179.
12. Lowan TL, Kang BT. Yield of maize and cowpea in alley cropping system in relation to available light. Agric For Metere. 1990; 52: 49–359.
13. Newman SM, Bennett K, Wu Y. Performance of maize, beans and ginger as intercrops inPaulownia plantations in China. Agrofor Syst. 1998; 39: 23–30.
14. Tamang B, Andreu MG, Rockwood DL. Microclimate patterns on the leeside of single-row tree wind-breaks during different weather conditions in Florida farms: implications for improved crop production. Agrofor Syst. 2010; 79: 111–122.
15. Nerlich K, Graeff-Hönninger S, Claupein W. Agroforestry in Europe: a review of the disappearance of traditional systems and development of modern agroforestry practices, with emphasis on experiences in Germany. Agrofor Syst. 2013; 87: 475–492.
16. Peng XB, Zhong CG, Shen P, Zhang SX. Photosynthetic response of maize and soybean to the micro-climatic in an agroforestry system. Acta Ecologica Sinica. 2010; 30:710–716.
17. Raschke K, Resemann A. The midday depression of CO2assimilation in leaves ofArbutus undeoL:
di-urnal changes in photosynthetic capacity related to changes in temperature and humidity. Planta. 1986; 168: 546–558. doi:10.1007/BF00392275PMID:24232332
18. Wu YY, Zhu ZH. Temperate agroforestry in China. In: Gordon AM, Newman SM, editors. Temperate agroforestry systems. Wallingford: CAB International Press; 1997. p. 149–179.
19. Blenkinsop PG, Dale JE. The effects of shade treatment and light intensity onribulose-1,5-diphosphate carboxylase activity and fraction I protein level in the first leaf of barley. J Exp Bot. 1974; 25:899–912. 20. Sankar CR, Swamy SM. Influence of light and temperature on leaf area index, chlorophyll content, and
yield of ginger. J Maharashtra Univ. 1988; 13: 216–217.
21. Zhang JS, Meng P, Xin XB, Yin CJ. Effects of apple-ginger inter-cropping in the hilly land of Taihang Mountain. Sci Silvac Sin. 2001; 37:74–78.