Anibal Gusso(1), Damien Arvor(2) and Jorge Ricardo Ducati(3)
(1)Universidade Federal do Rio Grande do Sul, Instituto de Física, Campus do Vale, Avenida Bento Gonçalves, no 9.500, CEP 91501-970 Porto Alegre, RS, Brazil. E-mail: [email protected] (2)Université Rennes 2, CNRS, UMR LETG 6554, Place du recteur Henri Le Moal, CS 24307 35043, Rennes Cedex, France. E-mail: [email protected] (3)Universidade Federal do Rio Grande do Sul, Centro Estadual de Pesquisas em Sensoriamento Remoto e Meteorologia, Campus do Vale, Avenida Bento Gonçalves, no 9.500, Caixa Postal 15044, CEP 91501-970 Porto Alegre, RS, Brazil. E-mail: [email protected]
Abstract – The objective of this work was to evaluate the reliability of the physiological meaning of the enhanced vegetation index (EVI) data for the development of a remote sensing-based procedure to estimate soybean production prior to crop harvest. Time-series data from the moderate resolution imaging spectroradiometer (Modis) were applied to investigate the relationship between local yield fluctuations of soybean and the prevailing physically-driven conditions in the state of Mato Grosso, located in the south of the Brazilian Amazon. The developed methodology was based on the coupled model (CM). The CM provides production estimates for early January, using images from the maximum crop development period. Production estimates were validated at three different spatial scales: state, municipality, and local. At the state and municipality levels, the results obtained from the CM were compared with official agricultural statistics from Instituto Brasileiro de Geografia e Estatística and Companhia Nacional de Abastecimento, from 2001 to 2011. The coefficients of determination ranged from 0.91 to 0.98, with overall result of R2=0.96 (p≤0.01), indicating that the model adheres to official statistics. At the local level, spatially distributed data were compared with production data from 422 crop fields. The coefficient of determination (R2=0.87) confirmed the reliability of the EVI for its applicability on remote sensing-based models for soybean production forecast.
Index terms: agriculture, EVI, Modis, remote sensing, satellite.
Modelo para previsão da produção de soja baseado
em condições físicas predominantes
Resumo – O objetivo deste trabalho foi avaliar a confiabilidade do significado fisiológico de dados do índice de vegetação “enhanced vegetation index” (EVI) no desenvolvimento de um procedimento baseado em sensoriamento remoto para estimar a produção de soja antes da colheita. Foram aplicados dados de séries temporais do “moderate resolution imaging spectroradiometer” (Modis) para investigar a relação entre as flutuações locais na produtividade da soja e as condições físicas predominantes no Estado de Mato Grosso, localizado no sul da Amazônia brasileira. A metodologia desenvolvida foi baseada no modelo acoplado (CM). O CM fornece estimativas de produção para o início de janeiro, ao utilizar imagens do período de máximo desenvolvimento da cultura. As estimativas de produção foram validadas em três escalas espaciais diferentes: estadual, municipal e local. Nos níveis estadual e municipal, os resultados obtidos a partir do CM foram comparados às estatísticas agrícolas oficiais do Instituto Brasileiro de Geografia e Estatística e da Companhia Nacional de Abastecimento, de 2001 a 2011. Os coeficientes de determinação variaram entre 0,91 e 0,98, com resultado global de R2=0,96 (p≤0,01), o que indica que o modelo se ajusta às estatísticas oficiais. No nível local, os dados espacialmente distribuídos foram comparados a dados de produção de 422 lavouras. O coeficiente de determinação (R2=0,87) confirmou a confiabilidade do EVI para ser aplicado em modelos baseados em sensoriamento remoto, para previsão da produção de soja.
Termos para indexação: agricultura, EVI, Modis, sensoriamento remoto, satélite.
Introduction
Agricultural monitoring and forecasting are aspects of major priority in policies aiming to ensure food
safety, being crucial to regulate agricultural markets and to plan the reduction of environmental impacts at various levels by social and governmental organizations
Currently, Brazil plays an important role in agriculture and is the second largest soybean [Glycine max (L.) Merr.] producer worldwide, with 65 million tons harvested in 2012 according to Companhia
Nacional de Abastecimento (Conab, 2013). However,
these estimates are based on information obtained by subjective methods, which usually only consider
the municipality level. This happens due to five main
factors: municipality-level statistics are released more than a year after the end of soybean harvest; there is
a lack of fine spatial resolution for area, yield, and
production estimates at the intra-municipality level; yield estimates are often quantized, causing several municipalities to show the same yield values; no measurement error is associated with the estimates,
causing a confidence issue in the production estimates
(Gusso et al., 2012; Johann et al., 2012); and estimates tend to overlap, because the spatial resolution of the estimation production in one municipality may include soybean from other municipalities.
In Brazil, the state of Mato Grosso is an important region for national and global agricultural production,
requiring an efficient crop monitoring system. A
remote sensing-based model could potentially promote important improvements for crop production forecasts in the area. In this context, remote sensing data should
play a significant role in obtaining accurate spatialized and near real-time agricultural statistics. However, intense cloud cover during key identification periods
usually hinders the operational implementation of Landsat-based methodologies that provide agricultural statistics of summer crops (Sano et al., 2007).
The difficulty related to cloud cover may be overcome
by using imagery from the Earth observing system-moderate resolution imaging spectroradiometer (EOS-Modis) sensor aboard the Terra satellite, for crop cycle monitoring, primary productivity, and biophysical
parameter estimates (Melo et al., 2008). The Modis sensor provides an adequate imaging configuration
for crop monitoring due to its almost-daily revisit rate combined with a reasonable spatial resolution of 250 m, which is considered adequate for mapping
large-scale agricultural fields (Lobell & Asner, 2004).
Moreover, it has a good geometric quality that allows for time series and crop development analyses (Justice et al., 2002).
Different methodologies proposed by previous studies showed that the Modis medium spatial
resolution is capable of revealing cropland presence over large areas (Morton et al., 2006; Pittman et al.,
2010; Arvor et al., 2011; Gusso et al., 2014). However,
most of the published methods were designed to
analyze specific use cases – a specific crop, a few
crop years, or a restricted area, for example – and are not always valid under highly variable and extreme agrometeorological conditions within a routine and systematic crop forecasting system (Gusso et al., 2012).
In order to determine agricultural production, it is necessary to combine crop area and yield estimates. Yield estimate models usually consider agricultural practices, weather, and climatological conditions, especially rainfall (Fontana et al., 2002; Ferreira &
Rao, 2011), as the predominant physically-driven
conditions for the agricultural cycle modelling
(Melo et al., 2008; Cardoso et al., 2011). However,
the aggregation of agrometeorological components, even with low spatial resolution, results in increased complexity or substantial errors in the models (Assad
et al., 2007; Sims et al., 2008), leading to low predictive
power for support. Furthermore, meteorological data are often not available at the same time or at the same spatial scale as the remote sensing imagery (Sims et
al., 2008). In this way, simplified models based on
the spectral behavior of crop cycles can be a good alternative to support decision making prior to crop harvest (Mercante et al., 2010; Gusso et al., 2013).
Gusso et al. (2013) used an associative transfer property to show that the mathematical relationship
between a crop’s vigor profile and grain production can
be used to obtain the spatial distribution of the enhanced vegetation index (EVI) on an intra-annual basis. This assumption is based on the fact that vegetation indices are correlated with soybean yield because they are mainly associated with biomass evolution (Fontana
et al., 2002; Melo et al., 2008). On this premises,
Gusso et al. (2013) developed a coupled model (CM) that combines the Modis crop detection algorithm (MCDA) map with the resulting Modis productivity detection model (MPDM) to estimate soybean yield and production; however, it is still not clear to which spatial and temporal extent these physically-driven conditions can be sensitive to different management practices and climate conditions.
vegetation index (EVI) data for the development of a remote sensing-based procedure to estimate soybean production prior to crop harvest.
Materials and Methods
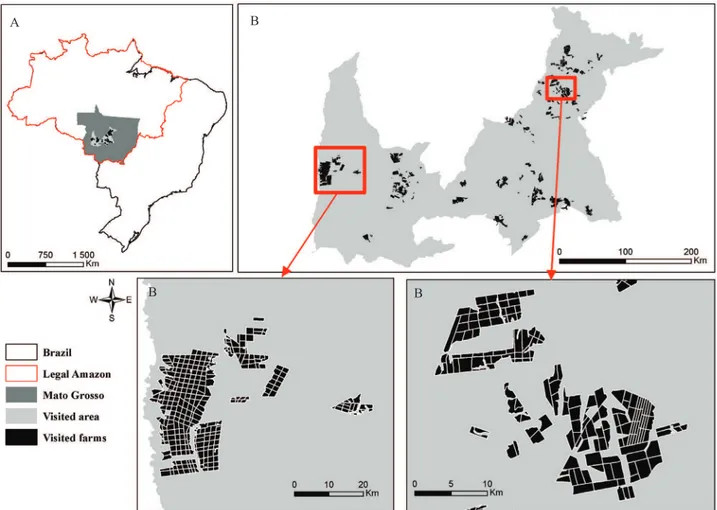
The experiment was conducted in the state of Mato Grosso, Brazil (between 7° and 19°S; and 50° and 60°W), where the sowing period for soybean lasts from
mid-September to early November, and the prevailing
management practice is no-tillage farming (Figure 1). The climate is tropical, super humid, Af, according to Köppen, with dry periods during the winter season. The average annual rainfall is 1,610 mm, as registered
by Instituto Nacional de Meteorologia (Inmet, 2009),
and the annual rainfall ranges from 1,200 to 2,000 mm in the soybean crop areas (Arvor et al., 2012).
To accurately adjust and calibrate the parameterization for a reliable representation of the
primary physical conditions and management practices found in the state of Mato Grosso, different levels of
information and two data types were used. However,
the dynamic-induced changes were modulated into a procedure for which EVI is the only input data for the coupled model (CM) approach.
The first type of data was acquired from the shuttle radar topography mission (SRTM) at 90-m spatial resolution (Rabus et al., 2003), which were used to
generate a slope map to exclude improper areas for mechanization (slope >12%).
The second type was obtained from Inmet (2009) and included annual rainfall data from 2000 to 2011 and 30 day-accumulated rainfall from 12 meteorological stations, covering the period from September to February, during these same years. The objective was
to refine the period of initial sowing and evaluate total
rainfall during crop development.
Modis EVI data (MOD13Q1 product, collection 5) covered all of the state of Mato Grosso (six image tiles:
H11V09, H11V10, H12V09, H12V10, H13V09, and H13V10) for the 2000–2011 study period. The Modis images and its products were obtained from National Aeronautics and Space Administration (Nasa, 2009).
The EVI formulation is 2.5 × (Nir - Red) / (Nir + 6 × Red - 7.5 × Blue + 1), in which Nir, Red, and Blue
are the atmospherically or partially-atmospherically
corrected surface reflectances of the near-infrared, red, and blue bands, respectively (Huete et al., 2002). In the
present study, EVI is also considered as an indicator of
water stress (Sims et al., 2008).
Regarding the different information levels, the
relationship between EVI and soybean yield was analyzed to detect the scale effect range. Smoothed EVI values were obtained by averaging two time windows from the maximum vegetation development stage, which ranged from 337–017 and 353–033 days of the year (DOY), and were compared with soybean yield averages at a regional scale, showing a logarithmic relationship. For this purpose, a log-based
mathematical rule, such as y = a × ln(x) + b, fits better
to the contour conditions in the relationship between EVI and soybean yield. In this way, the area calculated
below the crop profile graph, described as a function
of EVI and above zero is proportional to the maximum crop production so that different crop development conditions sweep out different areas during equal time windows in the same period (Gusso et al., 2013).
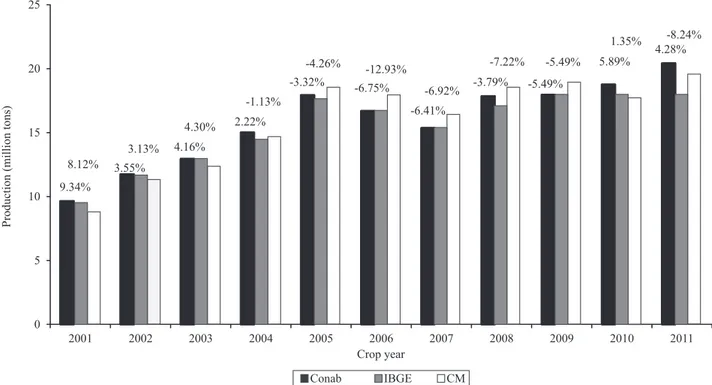
The validation of the production estimates from the CM was, therefore, carried out at three different spatial scales: state, municipality, and local. At the state scale, these estimates were compared with the annual soybean agricultural statistics from Conab and IBGE, as already mentioned (Figure 2). At the municipality scale, only the estimates from IBGE (2013) were available for comparison. Finally, at the local scale, validation data on yields were obtained at the crop level from two harvests in 2005 and 2006 during a
field campaign across a total of 76 farms visited and
mapped in 13 municipalities, representing the two main agricultural regions in central and western Mato
Grosso, along the BR-163 road and on the plateau
Chapada dos Parecis, respectively (Figure 1, Arvor et al., 2011). The validation was based on information
obtained for 422 sites – 211 in 2005 and 211 in 2006 –, with acreages between 14 and 569 ha.
EVI data was also used to parameterize the profile
of the crop development cycle related to canopy vigor.
This profile was considered as the complete cycle of the physiological stages of the vegetation profile,
which is representative of the total agrometeorological conditions and management practices acting during
the crop development profile.
Four physical vegetation concepts were adopted in the present study from Gusso et al. (2013), as follows.
First, the complete crop development profile from the
EVI is representative of the canopy vigor status of a particular crop. In this case, the physiological meaning stands for the contour conditions that associate crop canopy vigor with production.
Second, that the area calculated below the crop
profile graph (described as a function of EVI) and above
zero is proportional to the maximum crop production, so that different crop development conditions sweep out different graph areas during equal time windows at the same time (Gusso et al., 2013). This shows that the calculated graph area is correlated with the maximum
crop yield possible in a specific crop year of a specific
region.
Third, that the predominant crop development calendar in the state of Mato Grosso reaches its
maximum within a fixed window period, which is
covered by the MOD13Q1 product from 337 to 033 DOY (Gusso et al., 2013).
Lastly, that once the crop profile reaches its maximum and flattens off, the maximum EVI value of the current crop is calculated by averaging it in a fixed
time window that covers the maximum vegetation development, as previously described. This period of
time covers the stages from flowering to the beginning of grain filling and is determined using a
knowledge-driven approach. Four consecutive EVI images from the maximum plant growth were used to obtain an integrated EVI, which is referred to as the maxEVI window (Gusso et al., 2013).
It should be noted that the MCDA map coupled to the resulting MPDM map only considers the EVI values associated with the soybean crop area selected from the MCDA. Therefore, pixels that fall out from the soybean crop areas are tagged as zero yield. Based on this approach, parameterizations were performed during the development cycle of the culture, which
are best represented by images of the vegetation index (Gusso et al., 2012, 2013). In this case, soybean yield estimation can be provided immediately after a set of EVI images becomes available in early February in the state of Mato Grosso.
The parameters defined in the CM for crop
production estimates are constant in the mathematical code, independently of the soybean crop development or multiyear dynamics in the state of Mato Grosso. The MCDA and MPDM processes were coupled to generate results at a pixel basis, based solely on the EVI images as input parameters. The results were described with a single nonlinear mathematical function relating the integrated value of the EVI to yield at different scales, using a log-based mathematical rule, in which parameters a and b were determined for the state of Mato Grosso, through the equation: yield = a × (maxEVI) + b, in which a is the variation rate parameter 7,000 kg ha-1; b is the positive dimensionless
constant value of 5,100 kg ha-1, associated with the
lower yield threshold; and maxEVI is the dimensionless value of the EVI obtained from the time window of maximum plant growth.
The production estimates were obtained by multiplying yield by pixel area (a pixel of 250 m is 6.25 ha), using the equation: CM (tons) = MCDA (hectare) × MPDM (tons per hectare).
The soybean production estimates obtained from the CM for the state of Mato Grosso were compared
with the official ones from IBGE and Conab, at the
state and municipality levels, from 2001 to 2011. Spatially interpolated maps were generated from the municipal yield data acquired from IBGE and the CM, then allocated into municipal centroids. A total of 141 municipalities was analyzed for each crop year, and the averages were obtained for the period from 2001 to 2011 (Figure 1).
Results and Discussion
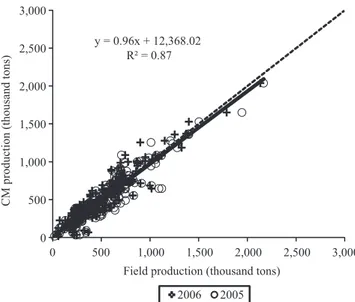
The slope coefficient values close to 1 indicates a
slight tendency of the CM to underestimate the production for municipalities with the highest
production (Figure 3). However, the obtained coefficient of determination (R2) of 0.96 (p≤0.01) indicated that
the model adheres to official statistics (Figures 3 and
4). The CM yield estimate was of 2,965 kg ha-1 in
were of 2,678 and 2,695 kg ha-1, respectively. This
result suggests that the CM is probably detecting inner trends and variations given by intra-municipality crop areas that the subjective and non-spatialized methods cannot. Furthermore, the 2005, 2006, and 2007 crop years were quite atypical for producers in the state of Mato Grosso due to adverse economic factors (Arvor et al., 2009, 2012), which actually generates uncertainties in non-spatialized methods.
The major soybean producer in the state of Mato Grosso is the municipality of Sorriso, as shown by the nine points above 1.5 million tons representative
of soybean production, with more than 1,482,000 tons
(IBGE, 2013). The root mean square deviation was
48,878 tons for all aggregated data. The dashed
lines show 95% of yield occurrences with Pearson’s
correlation coefficient of 0.98, indicating that the CM
estimates are consistent (Figure 3).
The obtained R2 between the production estimates
from the CM and from field data acquired from Arvor et al. (2011) was 0.87; Pearson’s correlation coefficient was 0.93; and the slope coefficient was 0.96 (Figure 4).
A slight tendency for the underestimation of the CM was also observed, which is in alignment with municipality-level results.
The forecasts generated by the CM adhere to data
from the official agencies Conab and IBGE, with
differences ranging from as low as +2.22% (Conab to CM) and -1.13% (IBGE to CM) in 2004, to as high as -6.75% (Conab to CM) and -12.93% (IBGE to CM) in 2006 (Figure 3). At the local level, yields are affected by local factors such as agricultural practices, which are smoothed at the municipal level and even more so at the state level. The difference observed between IBGE and the CM in 2006 coincides with reported tensions, including low prices, high costs, soybean disease in the
fields, climatic variability, and environmental issues,
which led to a decrease in total area and production between 2004 and 2007 (Arvor et al., 2009).
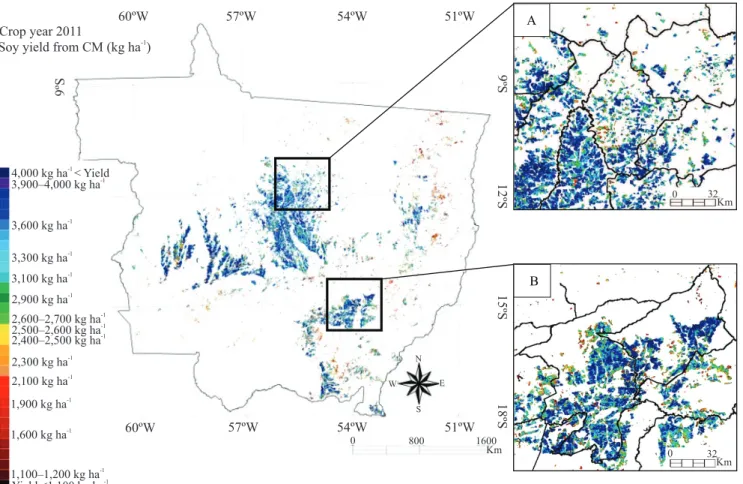
The overall results obtained from the CM approach show that the estimations of this model adhere to the spatial variability of soybean yield (Figure 5). In most cropped areas, the predominant yield values found were between 3,000 kg ha-1, in light blue, and 3,700 kg ha-1,
in dark blue, especially in the southwestern region
of the state of Mato Grosso. However, the yield
values decreased to approximately 2,700 kg ha-1 in
the central-western areas, in yellow, and to below 2,000 kg ha-1, mainly towards the agricultural frontiers
in the northeastern region of the state, in red. It should be pointed out that the CM is less affected by complex and time-consuming analytical methodologies related
Figure 3. Scatter plot comparing production estimates for the municipalities in the state of Mato Grosso, Brazil, obtained from the coupled model (CM) and Instituto Brasileiro de Geografia e Estatística (IBGE), from 2001 to 2011.
to image interpretation. Additionally, a CM map can be released at the 250-m Modis pixel resolution
(Figure 5). However, fine adjustments of the model
to regional conditions are still crucial. Liu & Kogan (2002) evaluated soybean cultivation in several regions of Brazil, using the vegetation condition index, from
1985 to 1998, and found R2=0.71 for the state of
Mato Grosso. Assad et al. (2007) used a different source of data for a forecasting system in the same
state and obtained Pearson’s correlation coefficient of
0.95 between data from the yield forecasting model and from Conab; however, the authors considered
official area estimates from IBGE for the production
computation. Therefore, the CM approach, adjusted to the prevailing physiological meaning of vegetation cover conditions in Mato Grosso, led to adequate production forecasts at the crop level, as expected. Most of this result is due to the accurate crop area estimation
by the MCDA, since the output values that were obtained by applying this approach are representative of the prevailing physically-driven conditions of crop vegetative development through time. Similarly, the MCDA was used to generate accurate results in
two different ecoregions, including the states of Rio
Grande do Sul (Gusso et al., 2012) and Mato Grosso (Gusso et al., 2014), characterized by different crop management systems.
Implementing operational crop yield forecasts before crop harvests remains a challenge at the regional level because the forecast models operate at different spatial scales. These regional conditions, including management practices, both logistic and economic, induce alterations in yield and their combined effect impacts the CM parameters. As expected, although a physiological meaning of the EVI was related to yield and production forecasts, such results also suggest that
the annual variability in the index is not only a function of crop vegetation type and climate but also of regional management practices. The relevance of local data for
fine adjustment due to local management practices is
also an important feature of the CM. In the present study, for modelling development of the state of Mato Grosso, two different maximum EVI windows were used to estimate soybean yield from the maximum development stage, whereas, for the modelling of the prevailing vegetation cover conditions of another
ecoregion, in the state of Rio Grande do Sul (Gusso
et al., 2013), for example, only one maximum EVI window was needed.
Conclusions
1. The physiological meaning of the enhanced
vegetation index profile can objectively explain
soybean (Glycine max) yield fluctuations through
time at different spatial scales and under a variety of remote-sensing conditions.
2. The proposed methodology is able to estimate soybean crop production prior to soybean crop harvest.
Acknowledgements
To Land Processes Distributed Active Archive
Center (LP DAAC) of National Aeronautical and Space Administration (Nasa) and to Earth Resources Observation and Science (EROS) Center from U.S. Geological Survey (USGS), for the data provided.
References
ARVOR, D.; DUBREUIL, V.; MENDEZ DEL VILLAR, P.; FERREIRA, C.M.; MEIRELLES, M.S.P. Développement, crises et adaptation des territoires du soja au Mato Grosso: l’exemple de Sorriso. Confins, v.6, 2009. Available at: <http://confins.revues. org/index5934.html>. Accessed on: Apr. 20 2010.
ARVOR, D.; JONATHAN, M.; MEIRELLES, M.S.P.; DUBREUIL, V.; DURIEUX, L. Classification of Modis EVI time series for crop mapping in the state of Mato Grosso, Brazil.
International Journal of Remote Sensing, v.32, p.7847-7871,
2011. DOI: 10.1080/01431161.2010.531783.
ARVOR, D.; MEIRELLES, M.; DUBREUIL, V.; BÉEGUÉ, A.; SHIMABUKURO, Y.E. Analyzing the agricultural transition in Mato Grosso, Brazil, using satellite-derived indices.
Applied Geography, v.32, p.702-713, 2012. DOI: 10.1016/j.
apgeog.2011.08.007.
ASSAD, E.D.; MARIN, F.R.; EVANGELISTA, S.R.; PILAU, F.; FARIAS, J.R.B.; PINTO, H.S.; ZULLO JÚNIOR, J. Sistema de
previsão da safra de soja para o Brasil. Pesquisa Agropecuária
Brasileira, v.42, p.615-625, 2007. DOI:
10.1590/S0100-204X2007000500002.
CARDOSO, A. de O.; AVILA, A.M.H. de; PINTO, H.S.; ASSAD, E.D. Use of climate forecasts to soybean yield estimates. In: EL-SHEMY, H.A. (Ed.). Soybean physiology and biochemistry. Rijeka: InTech, 2011. p.37-50. DOI: 10.5772/19988.
CONAB. Companhia Nacional de Abastecimento. Séries
históricas. Available at: <www.conab.gov.br/conteudos.
p h p ? a = 1 2 5 2 & t = 2 & P a g i n a _ o b j c m s c o n t e u d o s = 3 # A _ objcmsconteudos>. Accessed on: Oct. 1 2013.
FERREIRA, D.B.; RAO, V.B. Recent climate variability and its impacts on soybean yields in Southern Brazil. Theoretical and
Applied Climatology, v.105, p.83-97, 2011. DOI:
10.1007/s00704-010-0358-8.
FONTANA, D.C.; WEBER, E.; DUCATI, J.R.; BERLATO, M.A.; GUASSELLI, L.A.; GUSSO, A. Monitoramento da cultura da soja no centro-sul do Brasil durante a La Niña de 1998/2000. Revista
Brasileira de Agrometeorologia, v.10, p.343-351, 2002.
GUSSO, A.; ARVOR, D.; DUCATI, J.R.; VERONEZ, M.R.; SILVEIRA JUNIOR, L.G. da. Assessing the MODIS crop detection algorithm for soybean crop area mapping and expansion in the Mato Grosso State, Brazil. The Scientific World Journal, v.2014, article ID 863141, 2014. DOI: 10.1155/2014/863141. GUSSO, A.; DUCATI, J.R.; VERONEZ, M.R.; ARVOR, D.; SILVEIRA JR., L.G. da. Spectral model for soybean yield estimate using Modis/EVI data. International Journal of Geosciences, v.4, p.1233-1241, 2013. DOI: 10.4236/ijg.2013.49117.
GUSSO, A.; FORMAGGIO, A.R.; RIZZI, R.; ADAMI, M.; RUDORFF, B.F.T. Soybean crop area estimation by Modis/Evi data. Pesquisa Agropecuária Brasileira, v.47, p.425-435, 2012. DOI: 10.1590/S0100-204X2012000300015.
HUETE, A.; DIDAN, K.; MIURA, T.; RODRIGUEZ, E.P.; GAO, X.; FERREIRA, L.G. Overview of the radiometric and biophysical performance of the MODIS vegetation indices. Remote Sensing
of Environment, v.83, p.195-213, 2002. DOI:
10.1016/S0034-4257(02)00096-2.
IBGE. Instituto Brasileiro de Geografia e Estatística. Produção
agrícola municipal. Available at: <www.sidra.ibge.gov.br/>.
Accessed on: Mar. 2 2013.
INMET. Instituto Nacional de Meteorologia. Normais
climatológicas do Brasil de 1961-1990. 2009. Available
at: <http://www.inmet.gov.br/portal/index.php?r=clima/ normaisClimatologicas>. Accessed on: Mar. 30 2012.
JOHANN, J.A.; ROCHA, J.V.; DUFT, D.G.; LAMPARELLI, R.A.C. Estimativa de áreas com culturas de verão no Paraná, por meio de imagens multitemporais EVI/Modis. Pesquisa
Agropecuária Brasileira, v.47, p.1295-1306, 2012. DOI: 10.1590/
S0100-204X2012000900015.
JUSTICE, C.O.; TOWNSHEND, J.R.G.; VERMOTE, E.F.; MASUOKA, E.; WOLFE, R.E.; SALEOUS, N.; ROY, D.P.; MORISETTE, J.T. An overview of Modis Land data processing and product status. Remote Sensing of Environment, v.83,
LIU, W.T.; KOGAN, F. Monitoring Brazilian soybean production using NOAA/AVHRR based vegetation condition indices.
International Journal of Remote Sensing, v.23, p.1161-1180,
2002. DOI: 10.1080/01431160110076126.
LOBELL, D.B.; ASNER, G.P. Cropland distributions from temporal unmixing of MODIS data. Remote Sensing
of Environment, v.93, p.412-422, 2004. DOI: 10.1016/j.
rse.2004.08.002.
MASUDA, T.; GOLDSMITH, P.D. World soybean production: area harvested, yield, and long-term projections. International
Food and Agribusiness Management Review, v.12, p.143-163,
2009.
MELO, R.W. de; FONTANA, D.C.; BERLATO, M.A.; DUCATI, J.R. An agrometeorological-spectral model to estimate soybean yield, applied to southern Brazil. International
Journal of Remote Sensing, v.29, p.4013-4028, 2008. DOI:
10.1080/01431160701881905.
MERCANTE, E.; LAMPARELLI, R.A.C.; URIBE-OPAZO, M.A.; ROCHA. J.V. Modelos de regressão lineares para estimativa de produtividade da soja no oeste do Paraná, utilizando dados espectrais. Engenharia Agrícola, v.30, p.504-517, 2010. DOI: 10.1590/S0100-69162010000300014.
MORTON, D.C.; DEFRIES, R.S.; SHIMABUKURO, Y.E.; ANDERSON, L.O.; ARAI, E.; ESPIRITO-SANTO, F. del B.; FREITAS, R.; MORISETTE, J. Cropland expansion changes deforestation dynamics in the southern Brazilian Amazon.
Proceedings of the National Academy of Sciences of the United
States of America, v.103, p.14637-14641, 2006. DOI: 10.1073/
pnas.0606377103.
NASA. National Aeronautics and Space Administration. Land
Processes Distributed Active Archive Center (LP DAAC).
2009. Available at: <https://lpdaac.usgs.gov>. Accessed on: Nov.
21 2014.
NELLEMANN, C.; MACDEVETTE, M.; MANDERS, T.; EICKHOUT, B.; SVIHUS, B.; PRINS, A.G.; KALTENBORN, B.P. (Ed.). The environmental food crisis: the environment’s role in averting future food crises. Nairobi: United Nations Environment Programme, 2009. 101p. Available at: <http://www. unep.org/pdf/foodcrisis_lores.pdf>. Accessed on: Mar. 1 2010. PITTMAN, K.; HANSEN, M.C.; BECKER-RESHEF, I.; POTAPOV, P.V.; JUSTICE, C.O. Estimating global cropland extent with multi-year MODIS data. Remote Sensing, v.2,
p.1844-1863, 2010. DOI: 10.3390/rs2071844.
RABUS, B.; EINEDER, A.R.R.; ROTH, A.; BAMLER, R. The shuttle radar topography mission – a new class of digital elevation models acquired by spaceborne radar. ISPRS Journal
ofPhotogrammetry and Remote Sensing, v.57, p.241-262, 2003.
DOI: 10.1016/S0924-2716(02)00124-7.
SANO, E.E.; FERREIRA, L.G.; ASNER, G.P.; STEINKE, E.T. Spatial and temporal probabilities of obtaining cloud-free Landsat images over the Brazilian tropical savanna. International
Journal of Remote Sensing, v.28, p.2739-2752, 2007. DOI:
10.1080/01431160600981517.
SIMS, D.A.; RAHMAN, A.F.; CORDOVA, V.D.; EL-MASRI, B.Z.; BALDOCCHI, D.D.; BOLSTAD, P.V.; FLANAGAN, L.B.; GOLDSTEIN, A.H.; HOLLINGER, D.Y.; MISSON, L.; MONSON, R.K.; OECHEL, W.C.; SCHMID, H.P.; WOFSY, S.C.; XU, L. A new model of gross primary productivity for North American ecosystems based solely on the enhanced vegetation index and land surface temperature from MODIS. Remote
Sensing of Environment, v.112, p.1633-1646, 2008. DOI:
10.1016/j.rse.2007.08.004.