www.biogeosciences.net/14/241/2017/ doi:10.5194/bg-14-241-2017
© Author(s) 2017. CC Attribution 3.0 License.
Contributions of microbial activity and ash deposition to post-fire
nitrogen availability in a pine savanna
Cari D. Ficken and Justin P. Wright
Department of Biology, Duke University, Durham, NC, 27708, USA
Correspondence to:Cari D. Ficken ([email protected])
Received: 20 July 2016 – Published in Biogeosciences Discuss.: 12 August 2016
Revised: 10 December 2016 – Accepted: 19 December 2016 – Published: 17 January 2017
Abstract. Many ecosystems experience drastic changes to soil nutrient availability associated with fire, but the mag-nitude and duration of these changes are highly variable among vegetation and fire types. In pyrogenic pine savan-nas across the southeastern United States, pulses of soil in-organic nitrogen (N) occur in tandem with ecosystem-scale nutrient losses from prescribed burns. Despite the impor-tance of this management tool for restoring and maintaining fire-dependent plant communities, the contributions of differ-ent mechanisms underlying fire-associated changes to soil N availability remain unclear. Pulses of N availability follow-ing fire have been hypothesized to occur through (1) changes to microbial cycling rates and (2) direct ash deposition. Here, we document fire-associated changes to N availability across the growing season in a longleaf pine savanna in North Car-olina. To differentiate between possible mechanisms driving soil N pulses, we measured net microbial cycling rates and changes to soil δ15N before and after a burn. Our findings refute both proposed mechanisms: we found no evidence for changes in microbial activity, and limited evidence that ash deposition could account for the increase in ammonium availability to more than 5–25 times background levels. Con-sequently, we propose a third mechanism to explain post-fire patterns of soil N availability, namely that (3) changes to plant sink strength may contribute to ephemeral increases in soil N availability, and encourage future studies to explicitly test this mechanism.
1 Introduction
Temporal heterogeneity in resource supply is ubiquitous across ecosystems (Schimel and Bennett, 2004; James and Richards, 2006; Archer et al., 2014) and such resource pulses can be important if they contribute disproportionately to the overall resource budget of an ecosystem (McClain et al., 2003). Because they vary in magnitude and frequency, nu-trient pulses across ecosystems differ in their potential to in-fluence community and ecosystem dynamics. Despite com-pelling modelling-based evidence suggesting that nutrient pulses can influence ecological dynamics including species richness (Tilman and Pacala, 1993), physiological nutrient uptake constraints (Bonachela et al., 2011), and stoichiomet-ric coupling (Appling and Heffernan, 2014), it can be diffi-cult to predict when and where temporal nutrient heterogene-ity will occur. This uncertainty makes it difficult to assess the conditions under which temporal heterogeneity in nutri-ent supply might influence community- or ecosystem-level functioning.
follow-ing fires are more variable; some studies have documented no change in soil N pools following fire (Christensen, 1977; Richter et al., 1982), while others have documented imme-diate increases (2 days) that quickly dissipate (Lavoie et al., 1992). This suggests a need for localized studies with tempo-ral data resolution appropriate for that ecosystem to evaluate the mechanism behind changes in soil N availability follow-ing fire.
Pine savannas in the southeastern US are often managed with prescribed fires in the absence of recurring natural fires to maintain habitat for endangered species (Sorrie et al., 2006), and nutrient losses or pool redistributions from these fires can be substantial (Boring et al., 2004; Wilson et al., 2002, 1999). In addition to large quantities of carbon (C) re-leased through fuel consumption (Boring et al., 2004), pre-scribed fires can release up to 50 % of the phosphorus (P) and up to 75 % of the N that was stored in the understory biomass (Carter and Foster, 2004; Wan et al., 2001). These nutrients can be lost through volatilization, or redistributed as ash in low-intensity fires. Despite the ecosystem-level nu-trient losses associated with fires, short-term pulses of in-creased N availability in the soil are also observed following prescribed forest fires across vegetation types (Certini, 2005; Schafer and Mack, 2010; Smithwick et al., 2005; Wan et al., 2001), including in longleaf pine (Pinus palustrisMill.) sa-vannas (Boring et al., 2004). In longleaf pine sasa-vannas, be-cause these nutrient pulses occur during a period of rapid post-fire plant regrowth, they may influence successional pat-terns (Shenoy et al., 2013), plant diversity, and ecosystem productivity.
The mechanisms driving these ephemeral increases in N availability following fire remain poorly resolved, and so it remains difficult to predict how a specific fire will influence local N availability and turnover. Fire can decrease N avail-ability if N is volatilized and lost from the system in high-intensity fires (Lavoie et al., 2010; Certini, 2005). On the other hand, fire can increase N availability if it spurs micro-bial turnover of organic matter (Wilson et al., 2002; Certini, 2005), returns nutrient-rich ash to the system (Boring et al., 2004), or decreases the vegetation demand for N. Short-term increases in soil N availability may not translate to longer-term ecosystem retention if N is lost through leaching or as gaseous products during turnover.
In addition to difficulties associated with assessing the relative importance of each mechanism influencing post-fire N availability, logistical challenges remain to accurately measure N availability. First, changes to soil N availabil-ity are likely to occur rapidly following fire. Since micro-bial turnover occurs on a span of hours to days, and plants in fire-adapted systems begin re-sprouting within days to weeks, changes to N availability in pyrogenic systems are also likely to be ephemeral. Previous studies of post-fire N dynamics in longleaf pine savannas have relied on monthly or less-frequent soil samples (Wilson et al., 2002; Lavoie et al., 2010), but this sampling resolution may be too coarse if
changes in N dynamics occur rapidly following fire, or are transient. Secondly, net N cycling rates are often calculated as the difference in pool size between two time points. When measured in the field, repeated sampling of the same soil core would control for spatial heterogeneity in starting conditions, but would likely distort estimates of N dynamics because soil disturbance can increase rates of C mineralization and micro-bial respiration. Instead, to avoid disturbance associated with repeated sampling of the same core, nutrients are assumed to be distributed homogeneously in a small sampling area. Thus, it is assumed that cores collected in close proximity to each other are comparable and can be considered replicates. However, nutrient pool sizes can vary by orders of magni-tude within a metre (Jackson and Caldwell, 1993), and so these assumptions, while practical, are problematic and often invalid. Therefore, field estimates of net cycling rates cal-culated from the difference between two nearby cores may be influenced by the idiosyncrasies of N spatial heterogene-ity, and may not accurately represent local or larger-scale N dynamics. Without using expensive tracers, field-based sam-pling protocols to estimate net nutrient cycling remain im-perfect and researchers must collect extensive soil replicates to overcome the issues associated with environmental hetero-geneity.
In this study, our broad aim was to evaluate alternative mechanisms driving post-fire changes in N availability while addressing the above-mentioned methodological and analyt-ical challenges to estimating net cycling rates. We measured soil N status every week for 9 weeks during the 2014 grow-ing season in five longleaf pine savannas sites in North Car-olina. Our study is the first that we know of to provide high-resolution temporal (i.e. weekly) data on the effects of pre-scribed fire on soil N dynamics in longleaf pine savannas. We then used a Bayesian hierarchical linear model to account for heterogeneous in situ N availability. The goals of our study were (1) to evaluate the short-term effects of fire on soil in-organic N availability and (2) evaluate whether changes in N pool sizes following fire could be attributed to changes in net microbial cycling rates or ash deposition.
2 Methods
2.1 Study site and fire characteristics
palustris Mill.) and an understory dominated by wiregrass (Aristida stricta Michx.; Sorrie et al., 2006). Several hard-wood species andPinus serotinaMichx. replaceP. palustris
in the wetlands lining streambeds; in these areas, the soil is often saturated and the ground covered withSphagnumL. sp. Separating the uplands from the wetlands, the ecotones have dense, shrubby vegetation dominated by ericaceous species, includingVaccinium formosumAndrews,V. fuscatumAiton,
V. tenellum Aiton, Lyonia lucida(Lam.) K. Koch, L.
mar-iana(L.) D. Don, and Gaylussacia frondosa(L.) Torr. and Gray ex. Torr.
Since the 1980s, prescribed burns have been used as a management tool to maintain the longleaf pine savannas on the reservation; since the mid-1990s, these burns have oc-curred on 3-year rotations to promote longleaf pine regener-ation and maintain habitat for rare and endangered species (Sorrie et al., 2006). Prescribed burns are set primarily dur-ing the growdur-ing seasons, when wildfires also occur. To main-tain control of the prescribed burns, they are performed as low-intensity backing fires (ignited along a road or other fire break and allowed to burn into the wind). This fire re-turn interval mimics the historical fire rere-turn interval of 1 to 3 years (Frost, 1998), with burns occurring on average every 2.2 years (Stambaugh et al., 2011). Fort Bragg is composed of burn parcels (hereafter “sites”) with independent burn his-tories. Permanent vegetation sampling transects spanning the topographic gradient have been maintained in 32 sites since 2011; the burn regime in the majority of these sites has been experimentally altered, with a subset of sites being main-tained in 3-year burn intervals (Ames et al., 2015).
From these sites, we selected three sites scheduled to burn in 2014, and three not schedule to burn in 2014 for use in a before–after, control–impact experiment. To avoid any arte-facts associated with different historical burn characteristics (e.g. historical burns occurring in wetter or drier years; his-torical burn intensity and frequency), we limited the number of burned sites to those with similar burn histories (i.e. all on the same 3-year burn rotation). However, one site not sched-uled to burn until 2016 experienced a wildfire in July 2014, and another site scheduled to burn did not. The site that burned prematurely due to a wildfire was grouped with other burned sites, despite its shortened fire return interval (1 year) relative to the other burned sites (3 years). Previous work has found no significant difference in vegetation cover after 40 years of management with either a 2 or 3-year burn inter-val (Brockway and Lewis, 1997); because biomass is a strong determinant of fire intensity, we did not anticipate that a site experiencing a shortened burn regime for 1 year would have substantial effects on fire dynamics. The site that failed to burn was considerably different from the remaining sites (% soil moisture and % soil organic matter were both more than double that of the other sites), and thus was dropped from further analyses. Thus, we were left with five study sites: B1, B2, and B3 experienced burns in 2014; C1 and C2 were con-trol sites that remained unburned. Our study sites, renamed
here for clarity, correspond to sites 3 and 11 (wildfire site), 15b (B1–3), and 9 and 32 (C1 and C2) described in Ames et al. (2015). At each site, we established a 1 m2sampling area approximately 5 m upslope of the ecotone. This topo-graphic location was chosen to minimize the effects of ex-tremely well drained, hydrologically disconnected (as found in the uplands) or saturated, anoxic (as found in the wetlands) soils on microbial processing. At the onset of the experiment, all vegetation within sampling plots was identified to species. Percent cover of each species was estimated visually to the nearest percent.
Burns occurred in treatment sites B1, B2 (wildfire), and B3 on 4, 9, and 7 July 2014, respectively (Julian days 185, 190, and 188). Using metal tags marked with Tempi-laq temperature-sensitive paint (Air Liquide America 296 Corporation, South Plainfield, NJ, USA), we collected data on aboveground fire temperature at B1 (six tags) and B3 (eight tags). Tags were installed on metal polls approxi-mately 50 cm above the soil surface. They were installed sur-rounding our plots approximately 3 m apart from each other. We did not collect fire temperature data at B2 because it was not initially scheduled to burn.
2.2 Soil analyses
From 30 May through 25 July 2014, soil cores were collected weekly (9 weeks) from each site for pool size measurements (Fig. 1). We collected pool size cores for a minimum of 3 weeks after a prescribed burn. Therefore, our site-specific sampling allowed us to collect data before and after burns and detect any immediate changes in N concentration in re-sponse to the burn. Each week, three cores (each 5 cm diame-ter×12 cm deep and adjacent (∼10 cm) to each other) were randomly collected from each site, for a total of 27 cores collected for pool size measurements at each site over the 9-week sampling period. (In burned sites, the number of cores collected prior to versus following prescribed fires differed between sites depending on when the burns occurred. In B1,
N=15 cores were collected prior to burns andN=12 cores
were collected following prescribed burns. In B2 and B3,
N=18 cores were collected prior to burns andN=9 cores were collected following prescribed burns.) These cores were used to compare the pool sizes of nitrate (NO−3)and NH+4 during the growing season (Fig. 1). After collection, all cores were stored on ice, immediately transported back to the lab-oratory, and kept at 4◦C until they were analysed for inor-ganic N, soil moisture, soil orinor-ganic matter, pH, andδ15N. All cores were homogenized by passing through a 2 mm sieve. Frequent fires in this ecosystem consume aboveground veg-etation and litter, preventing the development of an O hori-zon in these soils (Boring et al., 2004). As a result, sieving removed coarse root fragments, rather than partially decom-posed organic matter. Subsamples (∼10 g) from each core
T0 T1
Triplicate T0 and T1 cores are installed at the same time. T0 cores are immediately removed for analysis of N pool; T1 cores are incubated in situuntil the following week.
T1 cores are removed after one week of incubation. At the same time, the next set of triplicate cores are installed (T0 and T1 of week 2). T0 cores are immediately removed; T1 cores are incubated in situ. N pool size data
are obtained from T0 cores collected each week.
Net N cycling rates are calculated from the difference in N content between incubated cores (T1) and T0. (i.e. y1i,j– y0i,j)
Week 1
Week 2
Week 3 ...
Figure 1.Schematic illustrating the sampling design across 9 weeks during the growing season. Each week, two sets of three replicate cores were installed at each study site. One set was immediately removed for pool size estimates; the second set was incubated in situ for 1 week to estimate net cycling rates.
30 min, centrifuged, and the extract was then filtered out and stored frozen until analysis on a Lachat QuikChem 8500. Ad-ditional soil subsamples were oven-dried for gravimetric soil moisture analysis and combusted at 450◦C to measure or-ganic matter content. Finally, we measured soil pH in 2 : 1 dH2O : soil ratios with a bench-top pH probe.
To measure net cycling rates, we also installed three PVC collars (5 cm internal diameter×12 cm deep) in each site
ev-ery week (N=27 cycling rate cores collected at each site
over the 9-week sampling period; the number of cores col-lected prior to versus following the prescribed burns differed between sites depending on when burns occurred, as above). These collars were installed adjacent to the soil cores col-lected for pool size measures (Fig. 1), and were incubated in situ for 1 week, after which time they were collected and analysed as above for inorganic N pool sizes, soil moisture, soil organic matter, and pH. After allowing for error in the initial pool size of the incubated soil core (see below for model details), net nitrogen cycling rates were calculated based on the difference in extractable NO−3 and NH+4 in the incubated cores and the un-incubated cores. That is, while traditional methods assume that the N pool sizes in the initial and incubated soil cores are equivalent, our analyses calcu-lated net cycling rates allowing for differences in initial con-ditions between the two cores.
2.3 δ15N analysis and mixing models
To assess plant-derived ash inputs to soil N pools after fire, we analysed soils from a subsample of time points forδ15N. Plants generally discriminate against 15N in favour of 14N uptake (Craine et al., 2015; Hogberg, 1997), and, thus, veg-etation tends to be depleted in15N relative to soil. If appre-ciable plant-derived N was deposited on burned sites as ash, we expected to see a decrease in δ15N while observing an
increase in N pool size. Although ash is deposited on surfi-cial soils, heavy rains occur frequently during June–August in this region of North Carolina (11.5, 14.8, and 11.5 cm, respectively; State Climate Office of NC), and the well-drained, sandy soils could leach nutrients through the soil profile. Moreover, because plants begin resprouting within days of a fire (C. Ficken, personal observation, 2014), we did not want to discount the potential for nutrients to be redis-tributed by roots. As a consequence of our uncertainty re-garding the vertical distribution of deposited15N, we sub-sampled the full soil cores (0–12 cm) for15N analyses. The enrichment of the sample in15N is reported on a per mille basis (‰) and was calculated as follows:
δ15N(‰)=Rsample−Rstandard Rstandard
×1000, (1)
where Rsample is the ratio of 15N :14N in the sample and
Rstandard=0.0036 the ratio in atmospheric N2.
We subsampled cores collected at each site for pool size estimates from the two sampling weeks pre-burn and the two sampling weeks post-burn, for a total of four consecutive sampling weeks surrounding each burn (for B1–3,N =6 un-burned andN=6 burned samples; for C1 and C2,N=12 samples). For unburned sites, we subsampled δ15N for 4 weeks corresponding to the same consecutive weeks sur-rounding the burn dates in burned sites (hereafterburn sea-son). For example, site B1 burned on 3 July 2014, corre-sponding to our sixth sampling week. For this site, and for the unburned site C1, we therefore measuredδ15N from soil subsamples in the fourth to seventh sampling weeks. Because our sites were not truly paired, we chose time points forδ15N analyses in the unburned sites based on the burn dates of the closest burn site. In this way, we allowed ourselves to detect any ash drifting between sites. Soils were oven-dried at 40◦C until a constant weight, then ground finely, encapsulated in tin capsules, and combusted on a Carlo-Erba elemental anal-yser coupled to a mass spectrometer at the Duke Environ-ment Isotope Laboratory.
We used two endmember mixing models to estimate the mass of ash-N deposited onto the system. We usedδ15N and N concentrations from pre-burn soil, and publishedδ15N sig-natures of ash (−0.81δ15N; Huber et al., 2013) as the end-members, and post-burn soilδ15N and N concentrations as the resulting mixture from the two endmembers. We solved for the mass of ash-N needed to be deposited in order to ac-count for the observed shift in soilδ15N signature.
2.4 Model development and statistical analyses 2.4.1 Pool sizes
To assess the spatial distribution of nutrient (NO−3 and NH+4)
and soil organic matter availability, we calculated the coeffi-cient of variation (CV) for each site prior to prescribed burns. To understand how fire and soil variables affect N pool sizes, we fitted a Bayesian hierarchical linear model; this is akin to a multiple regression that also allows for variability in the relationship between true soil N pool sizes (µ) and measured pool sizes (y)which might occur, for example, through ana-lytical error. Any effect of soil environmental conditions on N pool sizes would occur onµ, noty. Each core was mod-elled independently, and we accounted for site blocking ef-fects by including random intercepts for each site. For core
i=1. . ..nat sitej=1. . .5, observed N pool size (NH+4 or NO−3)was modelled as a function of random site effects, per-cent soil moisture (SM), perper-cent soil organic matter (SOM), soil pH, and the number of days since the previous burn (days since fire; DSF) as follows:
y0i,j∼N (µ0i,jσ
2), (2a)
µ0i,j =β0i,j+β1iSMi+β2iSOMi+β3ipHi +β4iDSF
−1i, (2b)
σ ∼unif(0,100). (2c)
For NO−3, we added an additional predictive parameter,
β5iNH +
4i to allow for NO −
3 concentrations to additionally vary with nitrification substrate (NH+4)availability. We ex-pected the effects of a burn to diminish with time, so we transformed DSF to DSF−1, so that as DSF increased, DSF−1→0. Full models included all main effects and no interactions.
2.4.2 Cycling rates
We built a hierarchical state-space model within a Bayesian framework to understand how fire and soil variables affected N cycling rates. As in the models of N pool sizes above, our cycling rate models allowed for variation in the relationship between true (µ)and measured (z) cycling rates, modelled below asτ. In addition, we also allowed for error associated with the assumption that the N concentrations in initial cores (y0; as from Eq. 2a) were equal to the initial concentrations of the incubating cores (y1). By including these errors into our model, we essentially relaxed the assumption that paired cores (un-incubated and incubated cores) were true replicates and had equal initial N concentration and edaphic conditions (SOM, pH, SM). We removed four core pairs (of 135) that exhibited NH+4 or NO−3 concentrations below the detection limit in the initial concentration. For corei=1. . .nat each
sitej =1. . .5, cycling rate was modelled as
zi,j ∼N (µi,j, τ ) (3a)
µi,j=y11,j−y01,j=β1iSMi+β2iSOMi+β3ipHi, +β4iDSF
−1
i +β5iDi+β6iy0i,j, (3b)
τ=σ−2, (3c)
σ∼unif(0,100). (3d)
To model cycling rates, we included incubation length (D, in days) and initial NH+4 or NO−3 concentration as additional predictors. Again, full models included all main effects and no interactions.
Prior to all analyses, we removed two cores from B1 (burned) and two from C2 that had pool size values below the analytical detection limit (4 of 135 cores). All models were built with the rjags package (version 3.15) in R ver-sion 3.2.1 (R Development Core Team, 2011). All predic-tors, including random site effects, were modelled with unin-formative normally distributed priors. Models were run with three chains and run with 200 000 iterations after a 100 000-iteration burn-in period. Convergence was tested by examin-ing chain density and trace plots to ensure proper chain mix-ing, and by calculating the Gelman–Rubin diagnostics using the gelman.diag() in the coda package (version 0.18.1) to en-sure scale reduction factors for each predictor was<1.05. All values are reported with 95 % credible intervals (CIs).
3 Results
3.1 Site conditions and fire characteristics
Although plant community composition varied, shrubs Gay-lussacia frondosa(L.) Torr. & A. Gray ex Torr.,Clethra
al-nifoliaL., and the native bambooArundinaria tecta(Walter)
Muh. were dominant in all of our study sites. Study sites were dry, low in organic matter, and acidic (Fig. 2). Prescribed burns in all three sites thoroughly consumed all or most of the aboveground biomass. Aboveground understory vegeta-tion in B1 and B3 was completely consumed. In B2 some scorched leaves remained on the woody vegetation, but the herbaceous understory species were completely consumed. Fire temperatures were similar between B1 and B3: average maximum fire temperature at B1 was 612◦C±18 and at B3 was 635◦C±18. Fire temperature was not measured in B2. 3.2 Pool sizes
(a)
0 10 20 30
SM (%)
Unburned Burned
(c)
0 10 20 30
B1 B2 B3 C1 C2
SOM (%)
(b)
0 1 2 3 4
pH
(d)
0 10 20 30 40
B1 B2 B3 C1 C2
TIN
(
µ
g
gds
−
1)
Figure 2.Mean soil moisture (SM;a), pH(b), soil organic matter
(SOM;c), and total inorganic N (TIN, i.e. NH+4 and NO−3;d) prior
to and following burns at each site. TIN is reported per gram of dry
soil (gds). Values are reported±95 % CI.
size was high within each site, but each site exhibited simi-lar variation in NO−3 pool size. CV-NO−3 ranged from 42.3 in B1 to 57.6 in C2. NH+4 pool sizes were also highly variable across sites, and there was a considerable range of the spatial heterogeneity across sites. CV-NH+4 ranged from 57.0 in B2 to 114.2 in C2.
In the first week of sampling, initial pool sizes of inorganic N were similar between sites. Over the pre-burn season, sites had greater NO−3 than NH+4 availability (3.06±0.16 µg NO−3 per gram of dry soil (gds−1) and 0.86±0.07 µg NH+
4 gds−1). However, the ratio of NH+4 : NO−3 increased following pre-scribed burns and sites B2 and B3 both experienced a shift in the dominant inorganic N form to NH+4 immediately after a burn.
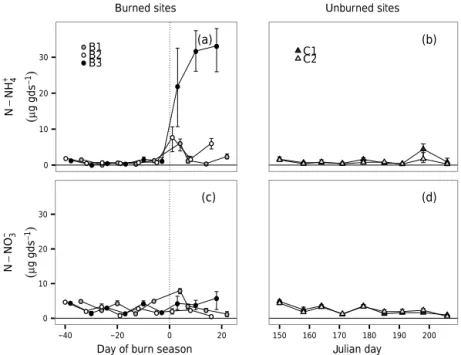
There were observable increases in NH+4 pool sizes im-mediately after a burn relative to the same time points in unburned control sites and time points in burned sites im-mediately prior to the burn (Fig. 5). Three days post-burn in Site B1, NH+4 had increased from 0.83±0.15 µg NH+
4 gds−1 in the pre-burn season to 6.10±1.08 µg NH+4 gds−1. One day post-burn in Site B2, NH+4 had increased from 0.91±0.12 µg NH+4 gds−1 in the pre-burn season to 7.79±2.09 µg NH+
4 gds−1. The pattern of NH +
4 pool size change in Site B3 was qualitatively different than changes observed in sites B1 and B2. In Site B3, there was an approximate exponential increase in NH+4 pool size that plateaued, but did not diminish, by the end of our sam-pling, more than 3 weeks post-burn. Three days follow-ing a burn in Site B3, NH+4 pool size had increased
B1 B2 B3
C1 C2
0 2 4 6 8
0 2 4 6 8
0 2 4 6 0 2 4 6
N−NH4+(µggds−1
)
Count
Figure 3.Histogram of soil NH+4 concentrations (reported per gram of dry soil, gds) prior to prescribed burns. Solid vertical lines indi-cate the median concentration across all sites; dashed vertical lines indicate the site-specific median concentration.
B1 B2 B3
C1 C2
0 2 4 6 8
0 2 4 6 8
0 2 4 6 0 2 4 6
N−NO3−(µggds−1)
Count
Figure 4.Histogram of soil NO−3 concentrations (reported per gram of dry soil, gds) prior to prescribed burns. Solid vertical lines indi-cate the median concentration across all sites; dashed vertical lines indicate the site-specific median concentration.
from 0.84±0.16 µg NH+4 gds−1 in the pre-burn season to 21.9±6.31 µg NH+
4 gds−1. Site effects (β0) had the strongest overall effect on NH+4 pool sizes, although this effect was not significant at C1. In burned sites B1–3,
β0 was −26.9 (95 % credible interval (CI)= −46.11 to
−6.57),−22.03 (95 % CI= −38.91 to −4.78), and−24.16 (95 % CI= −41.78 to −6.12), respectively. At C2,β0 was
−23.23 (95 % CI= −40.38 to −5.69). After random site
effects, pool sizes of NH+4 were most strongly correlated with days since fire (DSF;βDSF=12.50, 95 % credible in-terval (CI)=5.34 to 19.66; Fig. 6) and pH (βpH=6.16, 95 % CI=1.79 to 10.46; Fig. 6). Because we fit our pool
indi-●
● ● ● ● ●
● ● ● ●
● ● ● ● ● ●
● ●
●
● ● ● ● ●
● ● ●
(a)
0 10 20 30
N
−
N
H4
+
(
µ
g
g
d
s
−
1) ● ●
●
B1 B2 B3
Burned sites
● ●
● ●
● ●
● ●
● ●
● ● ●
●
● ● ● ●
● ●
● ●
● ●
● ● ●
(c)
0 10 20 30
−40 −20 0 20
Day of burn season
N
−
N
O3
−
(
µ
g
g
d
s
−
1)
(b) C1
C2
Unburned sites
(d)
150 160 170 180 190 200
ulian day J
Figure 5.Changes in pool sizes of(a)NH+4 in burned sites,(b)NH+4 in control sites,(c)NO−3 in burned sites, and(d)NO−3 in control sites.
Thexaxis for A and C shows time (in days) centred on the date of burn; days immediately before the burn are negativexvalues, while
days immediately following a burn are positive; the burn date is at 0 and is demarcated with a vertical dotted line. Thexaxis for sites B and
D depicts time in Julian days. Prescribed burns in B1, B2, and B3 occurred on Julian days 185, 190, and 188, respectively. Pool sizes are
reported in µg N gds−1. Error bars (±95 % CI) for individual time points may be obscured by the point.
cates decreasing pool sizes as time since fire lengthens. Pool sizes of NH+4 were larger for less acidic soils and in recently burned soils. Pool sizes of NH+4 were slightly greater in soils with more organic matter (βSOM=0.2, 95 % CI=0.01 to 0.30), but did not vary with soil moisture (βSM= −0.11, 95% CI= −0.30 to 0.07; Fig. 6).
In contrast to observed pulses of NH+4 availability fol-lowing fire, we did not find strong fire-associated in-creases in NO−3 pool size (Fig. 5). NO−3 availability ranged from 0.1 to 8.56 µg NO−3 gds−1and on average was 2.85±0.15 µg NO−3 gds−1. Site effects on NO−3 pool sizes were much weaker than for NH+4 and were only significant at B1 (β0= −4.81, 95 % CI= −9.46 to−0.08). DSF was not related to NO−3 pool sizes (βDSF=0.44, 95 % CI= −1.22 to 2.10; Fig. 6). Pool sizes of NO−3 varied with soil or-ganic matter content (βSOM=0.03, 95 % CI=0.01 to 0.07), NH+4 pool size (βNH+
4
=0.06, 95 % CI=0.02 to 0.10), and pH (βpH=1.46, 95 % CI=0.39 to 2.49; Fig. 6).
We also examined whether there was a long-term legacy of fire detectable in sites that had not experienced pre-scribed burns in that growing season (i.e. across pre-burn time points in burned sites, and all time points from un-burned sites). In these areas that had not experienced recent fires, DSF had no effect on NH+4 (βDSF=0.70, 95 % CI= −60.54 to 61.46) or NO−
3 availability (βDSF= 1.79, 95 % CI= −60.31 to 63.75). Soil moisture (βSM= 1.55, 95 % CI=0.65 to 2.45) and, to lesser extents, NH+4
B1 B2 B3
C1 C2
0 2 4 6 8
0 2 4 6 8
0 2 4 6 0 2 4 6
N−NH4+(µggds−1
)
Count
Figure 6.Mean posterior estimates for parameters predicting pool
sizes of NH+4 and NO−3. Parameters are days since fire (DSF), soil
pH, soil moisture (SM), soil organic matter (SOM), and substrate
availability (i.e. NH+4 reported per gram of dry soil, gds). Thin black
lines show 95 % CI and thick lines show 50 % CI. CI may be ob-scured by the mean point. For visual clarity, posterior distributions of site effects are not included here. See text for details.
availability (βNH+
4
● ● ● ● ● ●
● ● ● ●
●
● ● ● ● ● ●
●
● ●
● ● ●
●
● ●
●
(a)
−20 −10 0 10 20 30
Net miner
alization
(
µ
g
N
−
N
H4 +g
d
s
−
1w
e
e
k
−
1)
● ●
●
B1 B2 B3
Burned sites
● ●
● ●
● ●
● ● ● ●
● ●
● ● ●
● ● ●
● ●
● ●
● ●
● ● ●
(c)
−20 −10 0 10 20 30
−20 0 20
Day of burn season
Net nitr
ification
(
µ
g
N
−
N
O3 −g
d
s
−
1w
e
e
k
−
1)
(b) C1
C2
Unburned sites
(d)
160 180 200
ulian day J
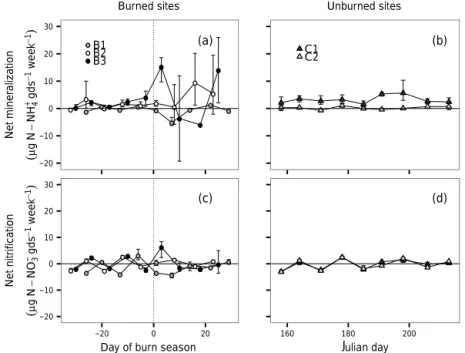
Figure 7.Changes in(a)net mineralization in burned sites,(b)net mineralization in unburned sites,(c)net nitrification in burned sites, and
(d)net nitrification in unburned sites. Thexaxis for A and C shows time (in days) centred on the date of burn; days immediately before the
burn are negativexvalues while days immediately following a burn are positive; the burn date is at 0 and is demarcated with a vertical dotted
line. Thexaxis for sites B and D depicts time in Julian days. Prescribed burns in B1, B2, and B3 occurred on Julian days 185, 190, and 188,
respectively. Cycling rates are reported in µg N per gram of dry soil per week (gds−1week−1). Error bars (±95 % CI) for individual time
points may be obscured by the point.
3.3 Cycling rates
Net N cycling rates were generally low and tempo-rally heterogeneous across the growing season (Fig. 7). They varied between net production and net consump-tion between sampling points (Fig. 7). Across the whole growing season, net mineralization in unburned sites was 0.19 (±0.16) µg gds−1day−1; in burned sites, it was 0.26
(±0.05) µg gds−1day−1. Net mineralization rates were
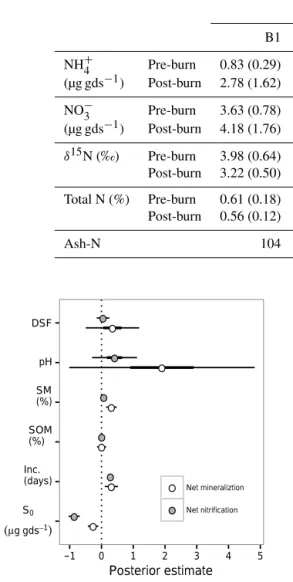
ap-preciably more variable the week following a burn, but patterns between sites were inconsistent (Fig. 7). For the first week following burns in sites B1–3, net mineraliza-tion rates were −1.72 (±0.32), 0.31 (±0.10), and 2.54 (±0.46) µg gds−1day−1, respectively. Despite the change in net mineralization pattern following a burn, there was no consistent effect of DSF on net mineralization rate (Fig. 8;βDSF=0.34, 95 % CI= −0.50 to 1.19). Of the mea-sured edaphic variables, net mineralization rates were cor-related only slightly with soil moisture (Fig. 8;βSM=0.31, 95 % CI=0.14 to 0.48).
Net nitrification rates were temporally heterogeneous throughout the full growing season but were not apprecia-bly more variable immediately following burns. Net nitri-fication rates were very low across the growing season in burned (−0.08±0.05 µg gds−1day−1) and unburned sites (−0.04±0.04 µg gds−1day−1; Fig. 7). Measured edaphic
parameters were poorly correlated with observed net
nitri-fication rates, although there was a slight positive relation-ship between net nitrification rates and soil moisture (Fig. 8;
βSM=0.07, 95 % CI=0.03 to 0.11).
3.4 Total soilδ15N and ash deposition
Soil N concentration was relatively stable through-out the burn season, and was similar between burned (0.35 % N±0.09) and unburned sites (0.38 % N±0.07;
Ta-ble 1). Mean total soil N varied between sites (TaTa-ble 1; Fig. 9). On average, B2 had the lowest total soil N content (0.18 % N±0.02), and total soil N ranged from 0.08 % at
C1 to 0.98 % at C2. Across all burned and unburned time points, confidence intervals overlapped between burned and unburned conditions at each site, indicating no persistent change in total N over the full growing season (Table 1).
Across the full growing season, soilδ15N in burned sites was 2.76 ‰ (±0.36) and in unburned sites was 2.00 ‰ (±0.36). The response of δ15N to burning varied between sites. Soilδ15N in unburned sites C1 and C2 was on average 1.22 ‰ (±0.52) and 1.79 ‰ (±0.36; Table 1), respectively.
In burned sites, there were shifts inδ15N, although the direc-tion of shift varied between sites. Soils in B1 were depleted in 15N after a prescribed burn relative to before the burn;δ15N shifted from 3.98 ‰ (±0.64) to 3.22 ‰ (±0.50). In Site B2
the soilδ15N decreased from 2.67 ‰ (±0.57) before the
Table 1.Mean soil inorganic N pool sizes reported per gram of dry soil (gds),δ15N values, and total N for each study site. Values are reported
±95 % CI. Sample sizes for inorganic N pool sizes differ between sites depending on when the prescribed burns occurred; see Methods for
details on sample sizes. Soil % N andδ15N values were collected on a subset of time points; sample sizes for these variables areN=6 for
burned site means, andN=12 for control (unburned) site means. Ash-derived N values are the estimated masses of N needed to be deposited
onto each site to result in the observed post-burnδ15N. Note that Christensen (1977) measured 1.15±0.49 g N m−2deposited in ash fall in
fire in a longleaf pine savannas.
Burned sites Unburned sites
B1 B2 B3 C1 C2
NH+4 Pre-burn 0.83 (0.29) 0.91 (0.24) 0.84 (0.31) 1.25 (0.28) 0.80 (0.14)
(µg gds−1) Post-burn 2.78 (1.62) 5.18 (2.21) 29.68 (6.03)
NO−3 Pre-burn 3.63 (0.78) 2.61 (0.63) 2.74 (0.63) 2.34 (0.26) 2.44 (0.22)
(µg gds−1) Post-burn 4.18 (1.76) 1.69 (0.65) 4.66 (1.35)
δ15N (‰) Pre-burn 3.98 (0.64) 2.67 (0.57) 1.37 (0.36) 1.22 (0.52) 1.79 (0.36)
Post-burn 3.22 (0.50) 2.45 (0.24) 2.60 (0.93)
Total N (%) Pre-burn 0.61 (0.18) 0.19 (0.04) 0.54 (0.20) 0.29 (0.10) 0.39 (0.14)
Post-burn 0.56 (0.12) 0.18 (0.02) 0.30 (0.11)
Ash-N 104 11 −175 (g N m−2)
● ●
● ● ● ● ● ●
● ● ●
●
S0
(µggds−1)
Inc. (days)
SOM (%)
SM (%) pH DSF
−1 0 1 2 3 4 5
Posterior estimate ●
●
Net mineraliztion
Net nitrification
Figure 8.Estimates of parameter posterior mean effects with bars showing 95 % CI for net mineralization and net nitrification rates. Parameters are days since fire (DSF), soil pH, soil moisture (SM), soil organic matter (SOM), the incubation length (Inc.), and initial
substrate availability (S0)per gram of dry soil (gds). For visual
clar-ity, posterior distributions of site effects are not included here. See text for details.
was a slight enrichment in soil 15N in Site B3 following fire; δ15N shifted from 1.37 ‰ (±0.36; Table 1) to 2.59 ‰
(±0.93; Table 1). The 95 % CIs surrounding the meanδ15N (and % N) overlapped for all burned sites, indicating the soil
δ15N at each site was statistically indistinguishable pre- and post-burn.
We used pre-burn soil δ15N isotopic signature in mixing models to calculate the mass of ash-N needed to be deposited
on our sites to achieve both the minimum and the empiri-cally measured shift in soilδ15N. To achieve a shift in soil
δ15N of the minimum external precision, sites B1, B2, and B3 would need 11, 5, and 20 g N m−2ash-N, respectively, de-posited following fire. To achieve the measured shift in soil
δ15N, sites B1 and B2 would need 100 and 11 g N m−2added through ash deposition; B3 would need 175 g N m−2to be re-moved from fire (Table 1). We also calculated the same val-ues using fresh leafδ15N from leaves collected from our sam-ple site (−2.9 ‰±0.1; J. Wright, unpublished data), rather
than published ashδ15N values (Table S1 in the Supplement).
4 Discussion
In this study, we collected weekly measurements of soil inor-ganic N availability to document short-lived changes in N dy-namics following fire and throughout the growing season of a pyrogenic forest in the southeastern US. As far as we know, this is the first study to pair estimates of N pool sizes and cycling rates at high temporal resolution in a longleaf pine savanna. Prior to prescribed burns, there was high variability in N availability, particularly for NH+4 pool sizes. This het-erogeneity reinforces the need for a methodological approach that considers initial edaphic conditions when carrying out in situ experiments on paired soil cores. To address this, we re-laxed the assumption that initial and incubating cores were true edaphic replicates; we used a Bayesian statistical frame-work to allow for variability in the relationship between true versus measured inorganic N concentrations in our soils.
be-(a)
0.0 0.5 1.0 1.5
Inorganic N (% o
f to
ta
l N
) Unburned
Burned
(b)
0 2 4 6
B1 B2 B3 C1 C2
T
o
ta
l
N
(
m
g
g
d
s
−
1)
Figure 9.Bar chart showing the pulse of inorganic N relative to the
total N pool size. Panel(a)shows the mean percent of inorganic N
(i.e. NH+4 and NO−3)in soil under in unburned and burned periods.
Panel(b)shows the mean total N soil content in burned and
un-burned periods, reported per gram of dry soil (gds). Error bars are
±95 % CI.
tween sites. Unlike studies in southeastern US pine savannas with monthly or less-frequent temporal sampling protocols, our weekly sampling allowed us to capture highly ephemeral changes in soil inorganic N pools. Furthermore, we found no changes in cycling rates and no evidence that ash deposition could account for the large increases in N availability follow-ing fire. Instead, we speculate that an ephemeral dampenfollow-ing of plant uptake could contribute to the observed increases in inorganic N following fire.
4.1 Changes in N dynamics across the growing season Throughout the growing season, inorganic N availability and net cycling rates were low, as is common in longleaf pine savannas (Binkley et al., 1992). In unburned conditions over the growing season, there was greater NO−3 availability than NH+4. This pattern is consistent with previous work, which documented relatively high NH+4 availability in the win-ter, followed by decreasing NH+4 availability throughout the growing season (Christensen, 1977). Net nitrification rates were low across the growing season and may have been inhibited by the low soil pH (Ste-Marie and Paré, 1999). Net mineralization in our study was higher than measured over the summer months in previous studies (Wilson et al., 1999), so rather than low mineralization rates, our low soil NH+4 : NO−3 ratios may be a result of preferential plant or microbial uptake of NH+4 over NO−3.
We observed sharp increases in soil inorganic NH+4, but not NO−3, immediately following fire across three longleaf pine savanna sites in North Carolina (Fig. 5). Although a global meta-analysis found that post-fire soil NO−3 concen-trations peak 10 months after NH+4 concentrations (Wan et
al., 2001), studies in southeastern US ecosystems found no change in soil NO−3 up to 30 days (pine savanna; Boring et al., 2004), 320 days (pine forest; Lavoie et al., 2010) and 500 days (shrubland; Schafer and Mack, 2010) following fire. Across the full growing season, we measured NH+4 pool sizes of burned sites that were nearly 5 times that of un-burned sites. The direction of the effect of fire was consis-tent across our study sites, however the magnitude of in-crease was highly site-specific. Within a site, inin-creases in NH+4 availability immediately following fire ranged from 5 times to more than 25 times the pre-burn levels. This NH+4 pulse was short-lived, and only in B3 was the increased NH+4 pool size sustained for longer than 1 week. As a consequence, a decreased sampling frequency would not have detected the ephemeral changes in soil NH+4 pool size in B1 and B2.
It remains unclear why, however, sites experience such variability in the magnitude of NH+4 response following fire. Although we cannot rule out the possibility that our high-intensity sampling influenced nitrogen cycling and pool sizes, we saw no evidence of increasing inorganic N avail-ability, or increasing variability in N availavail-ability, in our control sites, which experienced the same levels of sam-pling disturbance without fire. Our findings imply that an unaccounted-for biogeochemical mechanism may be in-volved in regulating nutrient availability following fire dis-turbance. We suggest that plant nutrient uptake, heretofore overlooked as a possible mechanism, may be another mech-anism driving post-fire nutrient availability. We noticed that B1 and B2 exhibited rapid vegetation resprouting following fire, while regrowth in B3 was patchy. Vegetation began re-sprouting in B1 and B2 6 days after fire, but not until 18 days after fire in B3 (C. Ficken, unpublished data). Moreover, in 2012, the last year all sites were sampled prior to the 2014 burns, B3 had the smallest standing biomass stocks of all three burned sites (J. Wright, unpublished data). If plant N uptake remained low following fire in B3, this might explain the persistent increase in N availability in this site. However, biomass stocks after 3 months of regrowth in 2014 were also substantially different between B1 and B2, despite these sites exhibiting similar patterns of NH+4 availability over time. In unburned years, Mitchell et al. (1999) found that annual net primary productivity (ANPP) in a longleaf pine savanna was positively correlated with local moisture availability and biomass estimates in this heterogeneous system are highly dependent on local woody versus herbaceous cover, as well as annual variability in environmental conditions. Factors controlling unburned ANPP may differ from those control-ling biomass regeneration, and given the spatiotemporal het-erogeneity of this system, teasing apart these drivers may re-quire a large-scale manipulative experiment.
we propose, (3) a decrease in plant uptake. Fire may stim-ulate microbial turnover of organic matter if additions of C or N from ash deposition or root exudation (southern shrub-land; Schafer and Mack, 2010) enhance microbial activity. Soil surface blackening after fire may increase soil temper-ature and stimulate immediate and prolonged N transfor-mations after fire (Booth et al., 2005; Ojima et al., 1994). Wilson et al. (2002) found significant increases in microbial biomass following fire in a longleaf pine savanna. Although we did not directly measure microbial biomass, we found no changes in net microbial mineralization associated with the observed increase in pool size, although cycling rates were increasingly variable following fire in burned sites (but not in unburned sites). Indeed, the increase in mass of NH+4 fol-lowing fire was much greater than the mass of NH+4 produced on a daily basis by net microbial mineralization, reinforcing the conclusion that changes in microbial cycling rates could not fully account for the observed increase in pool sizes.
We also found no indication that the newly available NH+4 substrate led to a delayed increase in net nitrification rate. This, along with high soil C : N (unburned sites – 47 : 1; burned sites – 53 : 1) relative to other longleaf pine soils (Lucash et al., 2007), might suggest that autotrophic nitrify-ing microbes are competitively inferior to heterotrophic mi-crobes under post-fire conditions in our study sites. Alter-natively, an unmeasured increase in gross nitrification might have allowed for a commensurate increase in microbial im-mobilization of NO−3 following fire. In general, however, the lack of change in microbial N cycling rates suggests that changes in microbial activity fail to account for the observed increases in NH+4 availability following fire.
Direct additions of N into the soil from ash may provide an alternative mechanism for the observed increase in min-eral N availability. To test this, we examined changes in both total N andδ15N immediately before and after burns. N from ash additions is primarily organic (Christensen, 1977; Huber et al., 2013; Raison, 1979), and is thought to increase N pools by stimulating microbial activity. We found no change in to-tal nitrogen (i.e. % N) or SOM before and after prescribed burns. These results support the findings of a global meta-analysis of fires in forested systems, which found no effect of fire on total N (Wan et al., 2001).
We used the natural abundance of15N as an isotopic tracer of ash additions. However, fractionation during volatiliza-tion preferentially releases14N, resulting in ash material that is enriched in 15N relative to fresh plant matter and an in-crease inδ15N signature in ash relative to fresh plant material (Saito et al., 2007; Stephan et al., 2015). A study in a sub-alpine grassland reported foliarδ15N values (−2.9 ‰) and N concentrations in ash (11.63±0.80 mg N g−1ash; Huber et al., 2013) comparable to foliarδ15N values (−2.9 ‰;±0.1; J. Wright, unpublished data) and ash-N concentrations of our system (8.75±0.90 mg N g−1ash; Christensen, 1977).
Hu-ber et al. (2013) also reportedδ15N values in ash of−0.81 ‰, which we used in mixing models.
Using this isotopic signature of ash, we found that 5 to 20 g ash-N m−2 would need to be deposited in our burned sites in order to observe a detectable shift in soil isotopic signature. These values are greater than the mass of ash-N deposition reported in a longleaf pine system (1.15 g m−2; Christensen, 1977), suggesting that this method may not be ideal for detecting ash inputs in systems with low above-ground vegetation stocks. Nevertheless, we estimated that 100, 11, and 175 g ash-N m−2would need to be deposited on sites B1–3 to account for our measured shifts in soilδ15N. These deposition levels are highly unlikely to have occurred at our sites, since they would require substantial aboveground vegetation accumulation and our system is burned every 3 years. However, it is unclear how quickly surface inputs can be expected to distribute throughout the soil profile. In the sandy soils of our system, frequent heavy summer rains or active root growth may quickly redistribute surface in-puts. While one study of longleaf pine savannas found that changes (losses) in total soil N following fire were concen-trated at the soil surface (Binkley et al., 1992), another study of subalpine woodlands and grasslands detected no changes in total N in surface soils following burning (Huber et al., 2013). Our work is in agreement with that of Christensen (1977), who found significant differences inδ15N with depth, but no change following fire.
Given the uncertainties surrounding the redistribution of surface inputs down the soil profile, we cannot conclusively rule out the potential to surface additions to contribute to the observed NH+4 pulse. Nevertheless, considering the unrealis-tic mass of ash-N needed to be deposited onto surface soils to account for our measured shifts inδ15N, we conclude that ash inputs are unlikely to fully account for the increase in measured soil inorganic N availability.
Never-theless, a change in plant sink strength may have contributed to post-fire NH+4 pulse.
Previous work found no evidence that plant species in an African savanna re-translocated nutrients from root biomass to resprouting shoot biomass following a fire (Vijver et al., 1999), indicating that soil pools can be important sources of N for regenerating biomass. Indeed, the biomass of resprout-ing vegetation followresprout-ing fire has been shown to be highly enriched in 15N relative to pre-burn biomass (Huber et al., 2013; Schafer and Mack, 2014), an indication that the source of N in resprouting biomass is also enriched (Evans, 2001). Root biomass is an important component of short-term N retention in grassland ecosystems (De Vries and Bardgett, 2016). In fire-prone systems, fire-tolerant plants could play an important role in preventing N leaching losses if they are able to resume N uptake quickly following fire.
We propose that plant demand for inorganic N may have a strong influence on soil N pool sizes in this system, and a temporary decrease in this demand may have contributed to the observed post-fire NH+4 pulse. Preference for NH+4 by plants inhabiting acidic soils, where nitrification is lim-ited by low pH and NO−3 availability is consequently low (Ste-Marie and Paré, 1999; Houlton et al., 2007; Wang and Macko, 2011; Kronzucker et al., 1997), could help to explain the relatively large pool sizes of NO−3 relative to NH+4 dur-ing the growdur-ing season (Vitousek, 1977), and this pattern is consistent with previous seasonal trends in a longleaf pine sa-vannas (Christensen, 1977). Furthermore, an increase in soil NH+4 pool size after fire without a stable increase in net mi-crobial mineralization rates could occur if there is a decrease in plant uptake. Similarly, a muted effect of fire on NO−3 pool size may occur if plants have diminished uptake of this in-organic N form, and plant uptake exerts a relatively weaker control on soil NO−3 pools. Plant control on ecosystem N sta-tus has been well documented in northeastern US hardwood forests, where a defoliation event resulted in substantial N losses from the ecosystem (Aber et al., 2002; Likens et al., 1969).
If post-fire patterns in N availability were related to plant uptake, we would expect differences in the magnitude and duration of soil N change following fire to be related to plant N demand and regrowth following fire. In stand-replacing fires in temperate forests, where vegetation is killed, rela-tively persistent increases in N pools should occur following fire. We similarly would expect smaller and more ephemeral changes in N pools in systems in which plants are only top-killed. Indeed, stand-replacing fires have been shown to re-sult in changes to soil N pools that persist more than 1 year following the fires (Smithwick et al., 2005; Turner et al., 2007). In contrast, elevated inorganic N immediately fol-lowing fires in grassland decreases throughout the growing season (Augustine et al., 2014). Low-intensity fires in grass-dominated glades adjacent to oak–hickory forest sites in a Kentucky study resulted in increases in post-burn soil NO−3
pool sizes, but no increase in lysimeter-detected NO−3 leach-ing losses below 10 cm (Trammell et al., 2004). Although the study did not examine microbial biomass, the authors found no effect of fire on net N mineralization, suggesting a role of plant uptake in patterns of N loss and retention post-fire. Such instances of plant control of N availability provide an important setting in which to examine the role of nutrient availability – and nutrient pulses in particular – on plant com-munity composition and ecosystem productivity. Differences in the ability of species to capture this ephemeral resource may help explain differences in post-fire resprouting patterns and biomass regeneration following fire.
4.3 Ecological implications of fire-associated N pulse To put the fire-associated pulse of inorganic N that we observed into context, we compared its mass to N in-puts in the longleaf pine savannas ecosystem. Although the pulse of soil N following fire is most likely a redis-tribution of N from other ecosystem pools, it is concep-tually helpful to understand the magnitude of this pulse relative to other components of the N cycle in longleaf pine savannas. The increase in soil inorganic N following fire (0.98 g N m−210 cm−1)was approximately 10 times the daily total net inorganic N production (i.e. net mineraliza-tion+net nitrification; 0.11 g N m−210 cm−1day−1).
These ephemeral increases in soil inorganic N availability occur during an important ontological stage of plant develop-ment as longleaf pine understory species begin resprouting within a few days following fire (C. Ficken, personal obser-vation, 2014). The mass of mineral N released following fire was more than twice the mass of N longleaf pine understory species assimilate into their biomass over a full growing sea-son (0.45 g N m−2; unpublished data). However, the extent to which plants or microbes have access to this ephemeral nutri-ent pulse remains unclear. Previous studies have documnutri-ented rapid plant uptake of N tracers by intact plants (Aber et al., 2002; Likens et al., 1969), suggesting that plants may have access to this N pulse during regrowth.
4.4 Conclusions
post-fire N availability. We propose here a role for plant up-take in regulating post-fire N availability, but we caution against drawing conclusions from this as-yet untested hy-pothesis. Instead, we propose this hypothesis to encourage future work to explore the relationships between N availabil-ity and plant biomass dynamics immediately following fire. Due to the rapid changes in N availability following fire, as well as the fast resprouting of understory species, we recom-mend that responses of the local plant community be con-sidered when determining an appropriate sampling regime for biogeochemical responses to disturbance. In systems in which the plant community responds rapidly, soil samples should be collectedly quickly and frequently to capture post-disturbance plant-nutrient and biogeochemical dynamics.
The pulses documented here were not associated with in-creases in microbial activity, and, although inconclusive, our data also do not support the hypothesis that the observed in-organic N pulse could be attributed to ash inputs to the sys-tem. We speculate that a temporary slowing of plant uptake may contribute to the observed mineral N pulse. Although plants begin resprouting a few days after a fire, the extent to which plants access the newly available NH+4 remains un-clear. Given the magnitude of this pulse relative to other N transformations in the system, and particularly relative to the mass of N estimated to be assimilated into the under-story biomass annually, these fire-associated N pulses may be important sources of plant-available N as the vegetation regrows. Thus, they may also play an important role in struc-turing plant recovery from disturbance and shaping commu-nity diversity in this system.
5 Data availability
Soil data are freely available from the figshare repository via doi:10.6084/m9.figshare.4543255.v2 (Ficken, 2017). Leaf carbon and nitrogen data are available by contacting the au-thor (Justin Wright).
The Supplement related to this article is available online at doi:10.5194/bg-14-241-2017-supplement.
Author contributions. Cari D. Ficken and Justin P. Wright con-ceived the project; Cari D. Ficken collected samples and per-formed laboratory and statistical analyses; Cari D. Ficken and Justin P. Wright wrote the manuscript.
Competing interests. The authors declare that they have no conflict of interest.
Acknowledgement. Funding for this project was provided by grant W9132T-11-2-0008 from the US Army Corps of Engineer Research Development Center, Construction Engineering Research Laboratory (ERDC-CERL), to Justin P. Wright, and by a Sigma Xi grant to Cari D. Ficken. The authors would like to thank Matt Hohmann with the Army Corps of Engineers for substan-tial constructive feedback throughout manuscript preparation, Janet Gray from the Fort Bragg Endangered Species Branch for logistical support, and Ben Grunwald for help with soil extractions.
Edited by: A. Ibrom
Reviewed by: two anonymous referees
References
Aber, J. D., Ollinger, S. V., Driscoll, C. T., Likens, G. E., Holmes, R. T., Freuder, R. J., and Goodale, C. L.: Inorganic nitrogen losses from a forested ecosystem in response to physical, chem-ical, biotic, and climatic perturbations, Ecosystems, 5, 648–658, doi:10.1007/s10021-002-0203-8, 2002.
Ames, G. M., Anderson, S. M., and Wright, J. P.: Multiple en-vironmental drivers structure plant traits at the community level in a pryogenic ecosystem, Funct. Ecol., 30, 789–798, doi:10.1111/1365-2435.12536, 2015.
Appling, A. P. and Heffernan, J. B.: Nutrient Limitation and Phys-iology Mediate the Fine-Scale (De)coupling of Biogeochemical Cycles, Am. Nat., 184, 384–406, doi:10.1086/677282, 2014. Archer, S. K., Allgeier, J. E., Semmens, B. X., Heppell, S. A.,
Pattengill-Semmens, C. V., Rosemond, A. D., Bush, P. G., Mc-Coy, C. M., Johnson, B. C., and Layman, C. A.: Hot moments in spawning aggregations: implications for ecosystem-scale nu-trient cycling, Coral Reefs, 34, 19–23, doi:10.1007/s00338-014-1208-4, 2014.
Augustine, D. L., Brewer, P., Blumenthal, D. M., Derner, J. D., and Von Fischer, J. C.: Prescribed fire, soil inorganic nitrogen dynam-ics, and plant respnoses in a semiarid grassland, J. Arid. Environ., 104, 59–66, doi:10.1016/j.jaridenv.2014.01.022, 2014.
Binkley, D., Richter, D., David, M. B., and Caldwell, B.: Soil Chem-istry in a Loblolly/Longleaf Pine Forest with Interval Burning, Ecol. Appl., 2, 157–164, doi:10.2307/1941772, 1992.
Bonachela, J. A., Raghib, M., and Levin, S. A.: Dynamic model of flexible phytoplankton nutrient uptake, P. Natl. Acad. Sci. USA, 108, 20633–20638, doi:10.1073/pnas.1118012108, 2011. Booth, M. S., Stark, J. M., and Rastetter, E. B.: Controls on
nitro-gen cycling in terrestrial ecosystems: A synthetic analysis of lit-erature data, Ecol. Monogr., 75, 139–157, doi:10.1890/04-0988, 2005.
Boring, L. R., Hendricks, J. J., Wilson, C. A., and Mitchell, R. J.: Season of burn and nutrient losses in a longleaf pine ecosystem, Int. J. Wildland Fire, 13, 443–453, doi:10.1071/WF03060, 2004. Brockway, D. G. and Lewis, C. E.: Long-term effects of dormant-season prescribed fire on plant community diversity, structure and productivity in a longleaf pine wiregrass ecosystem, Forest Ecol. Manag., 96, 167–183, doi:10.1016/S0378-1127(96)03939-4, 1997.
Certini, G.: Effects of fire on properties of forest soils: A review, Oecologia, 143, 1–10, doi:10.1007/s00442-004-1788-8, 2005. Christensen, N. L.: Fire and Soil-Plant Nutrient Relations in a
Pine-Wiregrass Savanna on the Coastal Plain of North Carolina, Oe-cologia, 31, 27–44, doi:10.1007/BF00348706, 1977.
Craine, J. M., Brookshire, E. N. J., Cramer, M. D., Hasselquist, N. J., Koba, K., Marin-Spiotta, E., and Wang, L.: Ecological inter-pretations of nitrogen isotope ratios of terrestrial plants and soils, Plant Soil, 396, 1–26, doi:10.1007/s11104-015-2542-1, 2015. De Vries, F. T. and Bardgett, R. D.: Plant community controls on
short-term ecosystem nitrogen retention, New Phytol., 210, 861– 874, doi:10.1111/nph.13832, 2016.
Evans, R. D.: Physiological mechanisms influencing plant ni-trogen isotope composition., Trends Plant. Sci., 6, 121–126, doi:10.1016/S1360-1385(01)01889-1, 2001.
Ficken, C.: Nmin_Data.csv, figshare,
doi:10.6084/m9.figshare.4543255.v2, 2017.
Frost, C. C.: Presettlement fire frequency regimes of the United States: A first approximation, Proceedings 20th Tall Timbers Fire Ecology Conference: Fire in Ecosystem Management: Shifting the Paradigm from Suppression to Prescription, Boise, ID, USA, 70–81, 1998.
Hartford, R. A. and Frandsen, W. H.: When it’s hot, it’s hot. . . or maybe it’s not! (Surface flaming may not portend extensive soil heating), Int. J. Wildland Fire, 2, 139–144, 1992.
Hogberg, P.: Tansley Review No. 9515N Natual Abundance in
Soil-Plant Systems, New Phytol., 137, 179–203, doi:10.1046/j.1469-8137.1997.00808.x, 1997.
Houlton, B. Z., Sigman, D. M., Schuur, E. A. G., and Hedin, L. O.: A climate-driven switch in plant nitrogen acquisition within tropical forest communities, P. Natl. Acad. Sci. USA, 104, 8902– 8906, doi:10.1073/pnas.0609935104, 2007.
Huber, E., Bell, T. L., and Adams, M. A.: Combustion influences on natural abundance nitrogen isotope ratio in soil and plants following a wildfire in a sub-alpine ecosystem, Oecologia, 173, 1063–1074, doi:10.1007/s00442-013-2665-0, 2013.
Jackson, R. B. and Caldwell, M. M.: The scale of nutrient hetero-geneity around individual plants and its quantification with geo-statistics, Ecology, 74, 612–614, doi:10.2307/1939320, 1993. James, J. J. and Richards, J. H.: Plant nitrogen capture in
pulse-driven systems: Interactions between root responses and soil processes, J. Ecol., 94, 765–777, doi:10.1111/j.1365-2745.2006.01137.x, 2006.
Just, M. G., Hohmann, M. G., and Hoffmann, W. A.: Where fire stops: vegetation structure and microclimate influence fire spread along an ecotonal gradient, Plant Ecol., 217, 631–644, doi:10.1007/s11258-015-0545-x, 2016.
Kronzucker, H. J., Siddiqi, M. Y., and Glass, A. D. M.: Conifer root discrimination against soil nitrate and the ecology of forest succession, Nature, 385, 59–61, doi:10.1038/385059a0, 1997. Lavoie, M., Starr, G., Mack, M. C., Martin, T. A., and Gholz, H.
L.: Effects of a prescribed fire on understory vegetation, car-bon pools, and soil nutrients in a Longleaf Pine-Slash Pine forest in Florida, Nat. Area. J., 30, 82–94, doi:10.3375/043.030.0109, 2010.
Lavoie, N., Vézina, L. P., and Margolis, H. A.: Absorption and as-similation of nitrate and ammonium ions by jack pine seedlings, Tree Physiol., 11, 171–183, doi:10.1093/treephys/11.2.171, 1992.
Likens, G. E., Bormann, F. H., and Johnson, N. M.: Nitrification: importance to nutrient losses from a cutover forested ecosystem, Science, 163, 1205–1206, doi:10.1126/science.163.3872.1205, 1969.
Lucash, M. S., Eissenstat, D. M., Joslin, J. D., McFarlane, K. J., and Yanai, R. D.: Estimating nutrient uptake by mature tree roots under field conditions: challenges and opportunities, Trees, 21, 593–603, doi:10.1007/s00468-007-0160-0, 2007.
McClain, M. E., Boyer, E. W., Dent, C. L., Gergel, S. E., Grimm, N. B., Groffman, P. M., Hart, S. C., Harvey, J. W., Johnston, C. A., Mayorga, E., McDowell, W. H., and Pinay, G.: Bio-geochemical Hot Spots and Hot Moments at the Interface of Terrestrial and Aquatic Ecosystems, Ecosystems, 6, 301–312, doi:10.1007/s10021-003-0161-9, 2003.
Mitchell, R. J., Kirkman, L. K., Pecot, S. D., Wilson, C. A., Palik, B. J., and Boring, L. R.: Patterns and controls of ecosystem function in longleaf pine-wiregrass savannas. I. Aboveground net primary productivity, Can. J. Forest Res., 29, 743–751, doi:10.1139/x99-051, 1999.
Ojima, D. S., Schimel, D. S., Parton, W. J., and Owensby, C. E.: Long- and short-term effects of fire on nitrogen cycling in tallgrass prairie, Biogeochemistry, 24, 67–84, doi:10.1007/BF02390180, 1994.
Raison, R. J.: Modification of the soil environment by vegetation fires, with particular reference to nitrogen transformations: A re-view, Plant Soil., 51, 73–108, 1979.
R Core Development Team: R: A language and environment for statistical computing, available at: http://www.R-project.org (last access: 11 January 2017), 2011.
Richter, D., Ralston, C. W., and Harms, W. R.: Prescribed Fire: Ef-fects on Water Quality and Forest Nutrient Cycling, Science, 215, 661–663, doi:10.1126/science.215.4533.661, 1982.
Saito, L., Miller, W. W., Johnson, D. W., Qualls, R. G., Provencher, L., Carroll, E., and Szameitat, P.: Fire Effects on Stable Isotopes in a Sierran Forested Watershed This study was supported by the Nevada Agricultural Experiment Station, College of Agriculture, Biotechnology, and Natural Resources, University of Nevada, Reno, publication number 52055531, and the US Forest Service, Lake Tahoe Basin Management Unit, J. Environ. Qual., 36, 91– 100, doi:10.2134/jeq2006.0233, 2007.
Schafer, J. L. and Mack, M. C.: Short-term effects of fire on soil and plant nutrients in palmetto flatwoods, Plant Soil., 334, 433–447, doi:10.1007/s11104-010-0394-2, 2010.
Schafer, J. L. and Mack, M. C.: Foliar Nutrient Concentrations and Ratios of Scrubby Flatwoods Species Change with Time After Fire, Castanea, 79, 237–245, doi:10.2179/14-013, 2014. Schimel, J. P. and Bennett, J.: Nitrogen mineralization: Challenges
of a changing paradigm, Ecology, 3, 591–602, doi:10.1890/03-8002, 2004.
Shenoy, A., Kielland, K., and Johnstone, J. F.: Effects of fire severity on plant nutrient uptake reinforce alternate pathways of succession in boreal forests, Plant Ecol., 214, 587–596, doi:10.1007/s11258-013-0191-0, 2013.
Sorrie, B. A., Gray, J. B., and Crutchfield, P. J.: The vascular flora of the Longleaf Pine ecosystem of Fort Bragg and Weymouth Woods, North Carolina, Castanea, 71, 129–161, 2006.
Stambaugh, M. C., Guyette, R. P., and Marschall, J. M.: Lon-gleaf pine (Pinus palustris Mill.) fire scars reveal new de-tails of frequent fire regime, J. Veg. Sci., 22, 1094–1104, doi:10.1111/j.1654-1103.2011.01322.x, 2011.
Ste-Marie, C. and Paré, D.: Soil, pH and N availability effects on net nitrification in the forest floors of a range of boreal forest stands, Soil Biol. Biochem., 31, 1579–1589, doi:10.1016/S0038-0717(99)00086-3, 1999.
Stephan, K., Kavenaugh, K. L., and Koyama, A.: Comparing the influence of wildfire and prescribed burns on watershed
nitro-gen biogoechemistry using15N natural abundance in terrestrial
and aquatic ecosystem components, PLoS ONE, 10, e0119560, doi:10.1371/journal.pone.0119560, 2015.
Tilman, D. and Pacala, S. W.: The maintenance of species richness in plant communities, in: Species Diversity in Ecology Commu-nities, edited by: Ricklefs, R. E. and Schluter, D., University of Chicago Press, Chicago, IL, 13–25, 1993.
Trammell, T. L. E., Rhoades, C. C., and Bukaveckas, P. A.: Effects of prescribed fire on nutrient pools and losses from glades occurring within oak-hickory forests of Cen-tral Kentucky, Restor. Ecol., 12, 597–604, doi:10.1111/j.1061-2971.2004.00275.x, 2004.
Turner, M. G., Smithwick, E. A. H., Metzger, K. L., Tin-ker, D. B., and Romme, W. H.: Inorganic nitrogen availabil-ity after severe stand-replacing fire in the Greater Yellow-stone ecosystem, P. Natl. Acad. Sci. USA, 104, 4782–4789, doi:10.1073/pnas.0700180104, 2007.
Vijver, C. A. D. M. V. D., Poot, P., and Prins, H. H. T.: Causes of increased nutrient concentrations in post-fire re-growth in an East African savanna, Plant Soil., 214, 173–185, doi:10.1023/A:1004753406424, 1999.
Vitousek, P. M.: The regulation of element concentrations in moun-tain streams in the northeastern United States, Ecol. Monogr., 47, 65–87, 1977.
Wan, S., Hui, D., and Luo, Y.: Fire effects on nitrogen pools and dynamics in terrestrial ecosystems: A meta-analysis, Ecol. Appl., 11, 1349–1365, doi:10.1890/1051-0761(2001)011[1349:FEONPA]2.0.CO;2, 2001.
Wang, L. and Macko, S. A.: Constrained preferences in nitrogen up-take across plant species and environments, Plant Cell Environ., 34, 525–536, doi:10.1111/j.1365-3040.2010.02260.x, 2011. Wilson, C. A., Mitchell, R. J., Hendricks, J. J., and Boring, L. R.:
Patterns and controls of ecosystem function in longleaf pine-wiregrass savannas. II. Nitrogen dynamics, Can. J Forest Res., 29, 752–760, doi:10.1139/x99-050, 1999.