Submitted2 February 2016
Accepted 14 September 2016
Published26 January 2017
Corresponding author
Emilie Ramsahai,
Academic editor
Raghu Metpally
Additional Information and Declarations can be found on page 13
DOI10.7717/peerj.2568 Copyright
2017 Ramsahai et al.
Distributed under
Creative Commons CC-BY 4.0
OPEN ACCESS
The use of gene interaction networks
to improve the identification of cancer
driver genes
Emilie Ramsahai1, Kheston Walkins2, Vrijesh Tripathi1and Melford John2
1Department of Mathematics & Statistics, The Faculty of Science and Technology, The University of the West Indies, St. Augustine Campus, Trinidad and Tobago
2Department of Preclinical Sciences, The University of the West Indies, St. Augustine, Trinidad and Tobago
ABSTRACT
Bioinformaticians have implemented different strategies to distinguish cancer driver genes from passenger genes. One of the more recent advances uses a pathway-oriented approach. Methods that employ this strategy are highly dependent on the quality and size of the pathway interaction network employed, and require a powerful statistical environment for analyses. A number of genomic libraries are available in R. DriverNet and DawnRank employ pathway-based methods that use gene interaction graphs in matrix form. We investigated the benefit of combining data from 3 different sources on the prediction outcome of cancer driver genes by DriverNet and DawnRank. An enriched dataset was derived comprising 13,862 genes with 372,250 interactions, which increased its accuracy by 17% and 28%, respectively, compared to their original networks. The study identified 33 new candidate driver genes. Our study highlights the potential of combining networks and weighting edges to provide greater accuracy in the identification of cancer driver genes.
SubjectsBioinformatics, Computational Biology, Statistics, Computational Science
Keywords Driver genes, Interaction network, Algorithm, Gene expression, Mutation, Weighted network, Cancer, Graph
INTRODUCTION
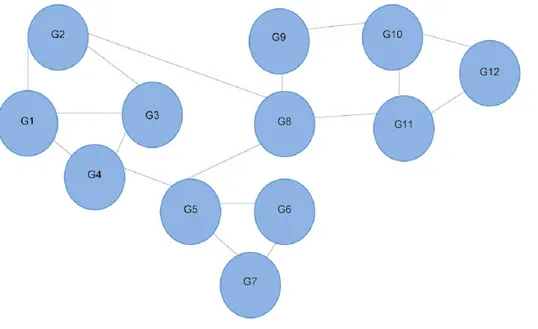
Figure 1 Interaction network of 12 different genes.Each line depicts an interaction between two genes. G4 is shown to interact directly with three other genes, and indirectly with all the others. Referred to as the 12-node network.
Cancer is characterized by uncontrolled cell proliferation. It develops when genetic aber-rations disrupt a number of signaling processes that promote the bypassing of normal re-strictions that keep cell proliferation in check. An understanding of mutated genes that drive the formation of cancer is important in the discovery of new drugs and the recommendation of targeted treatment regimes for patients.
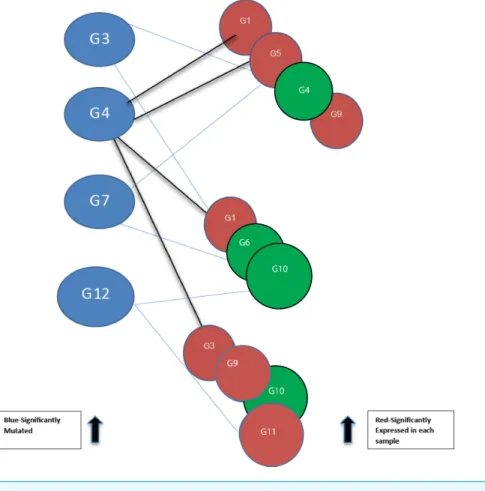
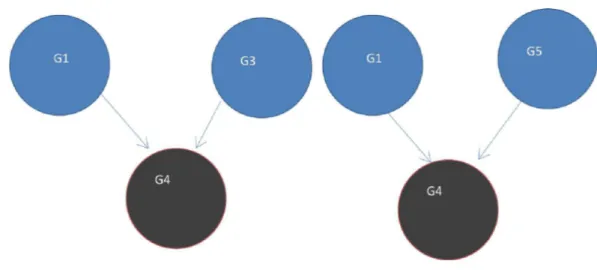
Figure 2 Bipartite graph constructed from the 12-node network inFig. 1. Blue nodes represent mu-tated genes. Those in red represent significantly expressed genes in three different samples while the green nodes are not significantly expressed.
In this paper we seek to determine if combining interaction graphs improves the identifi-cation of cancer driver genes by DriverNet and DawnRank. They were both developed using the R environment, which provides powerful data analysis and graphical features. DriverNet met the standards set by Bioconductor (Gentleman et al., 2004). We combined graphs from DriverNet (Bashashati et al., 2012), VarWalker (Jia & Zhao, 2014), and DawnRank (Hou & Ma, 2014) for our analyses.
DriverNet
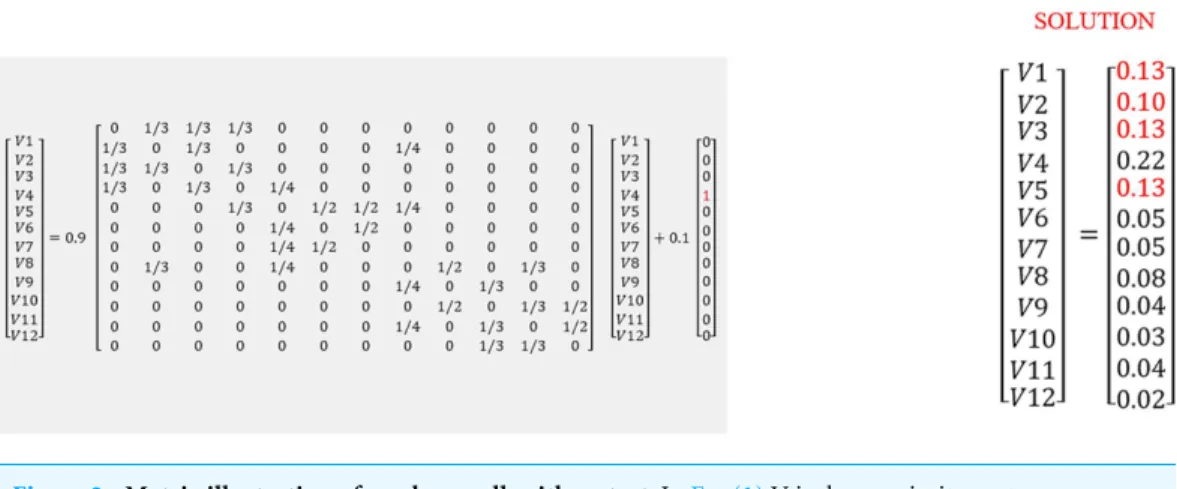
Figure 3 Matrix illustration of random walk with restart.InEq. (1)V is the proximity vector (V1. . . V12),ris the restart probability of 0.1. Matrix A represents the network.Pis the vector where the 4th element is 1, as the walker is at G4 at time 0. The solution shows nearby nodes with higher scores. The red values (0.13 and 0.10) were determined to be closer to G4.
network by using a Bayes classifier, and eliminates those that do not fit. DriverNet predicts driver genes by considering the effect of mutated genes on the gene expression levels of interacting partners.
Using threshold cut-off values genes are categorized as expressed or not. In Fig. 2, blue nodes partition of the bipartite graph represent mutated genes whilst nodes in red represent their expression status for different patients. Genes in red are significantly expressed. The gene interaction network connects nodes between the two sets. In the identification of candidate driver genes, the guiding principle is to select as many red nodes as possible using the fewest number of blue nodes. At each stage of the greedy algorithm, mutated genes with the highest number of significant connections (such as G4 inFig. 2) are selected as candidate driver genes.
VarWalker
VarWalker uses a Random Walk with Restart (RWR) algorithm. The network it uses was constructed using the Human Protein Reference Database (Keshava Prasad et al., 2009), a manually curated resource. It includes protein–protein interactions, catalytic reactions, and protein translocation events that have been evaluated against other repositories of human protein–protein interaction data in the public domain (Mathivanan et al., 2006). This
net-work shows
the Cancer Genome Census (CGC) genes (Futreal et al., 2004) tend to be located more closely to each other than other genes. Specifically, 71% of CGC genes are directly connected and 26% have a shortest path of two. VarWalker uses this trait to nominate candidate driver genes by ascertaining consensus across multiple samples for mutated genes that converge. An initial gene filtering process removes long genes that are more frequently mutated due to size.
In this case, its value would be the probability of moving to node j from i. If gene i does not link to gene j, then Aij=0. InFig. 1, from G4, it is possible to move directly to one of the three other nodes. The probability of moving to a directly connected node is proportional to the number of outgoing nodes from G4, in this case 1/3. The RWR is applicable as a proximity metric because after a sufficiently long time interval, the probability of being at G4 at a random time provides a measure of the proximity between G4 and all the other nodes.Figure 3is the matrix representation of this equation for the 12-gene network inFig. 1.
V=(1−r)AV+rP. (1)
In this example a restart probability value of 0.1 is used forr. The 12 by 12 matrix A presented inFig. 3is derived from the 12-node network inFig. 1. P is the vector in which the ith element holds the probability that the walker is at node i at time 0. In this case we start at G4, so the fourth element of P is 1, and all others are zero (seeFig. 3). The value of V is then calculated, to satisfyEq. (1). The solution of this equation is vector V given inFig. 3:
V=(0.13,0.10,0.13,0.22,0.13,0.05,0.05,0.08,0.04,0.03,0.04,0.02).
This solution indicates nearby nodes (G1, G3, and G5) with higher scores of 0.13. We can also determine G9 and G11 are equally distant from G4. With a large network, this can be computationally intensive, thus, this matrix solution can be replaced by an iterative solution.
DawnRank
DawnRank selects potential driver genes based on their impact on the overall differential ex-pression of its downstream genes in the interaction network. In this network, all redundant edges are collapsed to single edges when aggregating networks from different databases. With this method an individual patient sample is used rather than a large cohort, so drivers are identified on a personalized level. This single patient approach is totally independent of the mutation frequency, and can therefore be considered focused on finding more infrequent or rare drivers. It classifies rare and even patient-specific mutations. This is the use of the ‘long tail phenomenon’ when selecting driver genes, which considers cancer mutations as being characterized by a small number of frequently mutated genes and a large number of infrequently mutated genes. Selected genes are compared to CGC and Pan Cancer standard driver gene list (Cancer Genome Atlas Research et al., 2013;Tamborero et al., 2013) for validation.
Figure 4 (A) Initial statet =0, a rank of 1 is divided equally between all 4 nodes. To get to (B) next
statet=1, ranks are updated by adding up ranks of all incoming genes divided by the number of outgoing links from each of them.
Fig. 4B. Thus, new ranks shown inFig 5are calculated as follows:
G1=G3/2=0.25/2=0.125;G3=G1/2=0.25/2=0.125;
G4=G1/2+G3/2+G3/1=0.25/2+0.25/2+0.25/1=0.375;G5=0.
The ranks of genes may be weighted so that a gene is given a higher rank, even though there are fewer links to it, if more important genes link to it. The output of the PageRank algorithm is a list of genes and their rankings based on the gene network configuration. A high PageRank score for a mutated gene in cancer indicates that the gene is more likely to be a driver.
For DawnRank’s implementation of the PageRank algorithm the initial rank value for each gene would be 1/11,648, as the network of genes consists of 11,648 members. A gene linked to many other genes with high ranks receives a high rank. This process is modeled using states, the transitions from one state to another depending only on the current state rather than a preceding state. This is the Markov property, where each iteration is equally probable. The difference in the ranks between timet=0 andt=1 is computed recursively asrt+1andrt, until it converges to an insignificant value (epsilon). It can also stop after a
set number of iterations, which is 100 for DawnRank.
METHODS
Interaction network construction
Figure 5 Page Rank results at statet=1 after one iteration where ranks are recalculated as outlined in
Fig. 4.
For each of the three individual networks and the combined network we computed an interaction score assuming independence. To infer these interaction scores, we combined for each interaction between gene Giand gene Gj, two scores:
• Qij is the number of graphs the interaction between gene Gi and gene Gj occurs in,
represented on a common scale [0, 1]. This is where qij=0 represents no information
about the interaction, and qij=1 represents strong evidence for the interaction as it
occurs in all the graphs;
• Rij is a count of the number of v-structures the edge Gi->Gjis part of in the network
projected onto a common scale [0, 1] (seeFig. 7).
Qijand Rijwere represented as matrices, with genes identifying both rows and columns,
qijand rijare the scores for the interaction between gene Giand gene Gj. These two were
combined as Sijas inEq. (2). This schema for combining scores allows us to adjustwbetween
[0, 1] depending on the confidence in each of these contributors to the final weighting. For our implementation we used equal weighting by settingwto 0.5
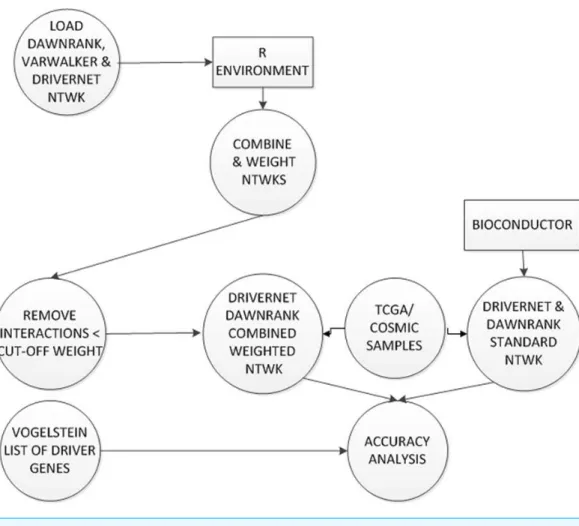
Figure 6 Construction and testing of weighted combined network.Each interaction in the combined network was weighted. Low scoring interactions were removed. This new weighted network was used by DriverNet and DawnRank in the prediction of driver genes. These were analysed against the published list of driver genes fromVogelstein et al. (2013).
Assessing the linear bias correction
In order to quantify the impact of the dependency on the interaction scores, we compared the sum of the interactions from the individual graphs to those produced from the combined network for those interactions common in all three networks. The individual scores were summed as inEq. (3) across the 3 graphs, and projected onto a common scale [0, 1].
Sum=XSi. (3)
Eq. (4)was used to calculate the bias. We applied a linear regression between the summed values and the calculated values usingEq. (2)for the combined network.
Combined network=α∗sum+β. (4)
Figure 7 Two V-structures.A V-structure configuration exists in the network based on the paths among a group of any 3 genes. Two of the genes directly linked into the third. The edge G1->G4 forms part of both of these V-structures G1->G4<-G3 and G1->G4<-G5.
Testing the weighted network
Interactions with a weight less than or equal to the cut-off value of 0.17 were discarded. The resultant network was used to analyse the prediction of driver genes by DriverNet and DawnRank.
Data consisting of 504 samples of breast cancer (BRCA) initially from TCGA were derived from DawnRank. These included somatic mutation and differential gene expression data between the cancer and normal transcriptome. Driver genes were predicted by DawnRank using its standard network and the weighted combined network. Mutation and expression datasets consisting of 178 cervical cancer samples were downloaded from the Catalogue of Somatic Mutation in Cancer (COSMIC) (Forbes et al., 2011). These were transformed into two binary matrices where the rows were patients and the columns were genes. For the purpose of our analysis, expression values between the range−2 and 2 were considered to be normal. Thus in the expression matrix, if az-score value was >2.0 or <−2 the binary matrix element was set to 1 (TRUE), otherwise it was set to 0 (FALSE). Glioblastoma Multiforme (GBM) samples from The Cancer Genome Atlas (TCGA) (Cancer Genome Atlas Research, 2008) were used from DriverNet. These were represented by 2 matrices with 200 rows and 1,255 columns. Driver genes were predicted using DriverNet for GBM and cervical cancer.
The analysis included sensitivity, specificity, accuracy and receiver operating charac-teristic (ROC) with Area under the curve (AUC) measures (Zhu, Zeng & Wang, 2010).
Genes predicted as candidate driver genes were classified as true positives if they were present in the 125 driver genes fromVogelstein et al. (2013). Details on this analysis can be found inSupplementary Files.
RESULTS AND DISCUSSION
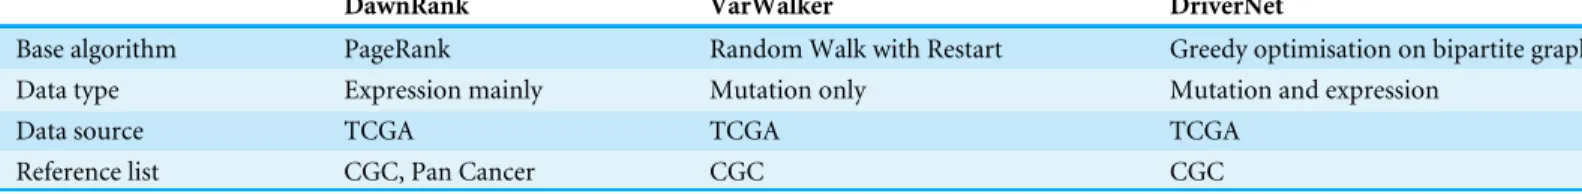
Table 1 Characteristics of packages used to predict cancer driver genes.
DawnRank VarWalker DriverNet
Base algorithm PageRank Random Walk with Restart Greedy optimisation on bipartite graph Data type Expression mainly Mutation only Mutation and expression
Data source TCGA TCGA TCGA
Reference list CGC, Pan Cancer CGC CGC
Table 2 Network characteristics of packages used to predict cancer driver genes.
DawnRank network VarWalker network DriverNet network Weighted
combined network
Pathway data source
Reactome, NCI-Nature, Kegg, PDI
Human Protein Reference Database (HPRD)
Reactome, NCI-Nature, Kegg, Panther Pathways, Cell Map, NCI-BioCarta, TRED
Interactions with a weight greater than 0.17
Nodes 11,648 8,768 1,255 13,862
Interactions 211,794 73,182 130,153 372,250
Density 0.00156 0.0009 0.0827 0.00193
Diameter 14 14 6 9
Table 3 Comparison of sensitivity, specificity, and accuracy of driver gene prediction using the standard network and the weighted combined network for DriverNet and DawnRank.
Parameter Standard network Weighted combined network
Sensitivity 0.8274 0.9796
Specificity 0.5400 0.2393
Glioblastoma multiforme
(DriverNet) Accuracy 0.8159 0.9734
Sensitivity 0.74440 0.91713
Specificity 0.58000 0.52991
Cervical (DriverNet)
Accuracy 0.7378 0.9139
Sensitivity 0.68284 0.96719
Specificity 0.61429 0.36752
Breast (DawnRank)
Accuracy 0.6796 0.9621
of their interaction networks, and in their use of gene mutation and expression data (see Tables 1and2). All packages use mutation data of tumor samples, but only DawnRank and DriverNet use gene expression data. Whereas DawnRank uses mainly expression data, DriverNet uses a combination of both. One would therefore expect there to be wide variations in their prediction of cancer driver genes. Our analysis shows this to be the case, when looking at the accuracy measures inTable 3.
Figure 8 Venn diagram of the 3 networks and how they overlap (A) number of interactions (B) num-ber of genes.
DawnRank; those reported in DriverNet and DawnRank but not in Varwalker; and also those reported in all three packages.
The Human Protein Reference Database (HPRD) used for the construction of the VarWalker network is not used by either of the other 2 packages (see Table 2). There are differences in the methods employed by DriverNet (Wu, Feng & Stein, 2010) and DawnRank (Ciriello et al., 2012) to determine pairwise interactions though there are some similarities in the pathway data used. Differences in the methods employed lead to significant differences in the number of nodes and interactions (seeTable 2).
The use of the weighted combined network made a significant improvement to the prediction of driver genes usingVogelstein’s list as a reference (seeTable 3). The accuracy increased from 81% to 97% for GBM and from 73% to 91% for cervical cancer by DriverNet. The largest accuracy increase was reported for breast cancer by DawnRank, a 28% increase from 68% to 96%.
DawnRank showed a larger improvement with its area under the ROC curve increasing from 0.6599 to 0.8241for breast cancer (Fig. 9A). A total of 235 driver genes were identified using GBM tumor samples with the DriverNet network compared to 308 for the combined network, an increase of 31%. The figures for cervical cancer were much higher, 337 and 1,201, respectively, an increase of more than 200%. These lists of genes are higher than Vogelstein’s list of 125, which used mutation characteristics to identify candidate oncogenes and tumor suppressor genes.
Figure 9 (A) ROC-DawnRank results (black) vs DawnRank results with weighted combined network (red). Area Under the Curve-AUC 0.6599 vs 0.8241. (B) ROC-DriverNet results with unweighted com-bined network (blue) vs DriverNet results with interactions above a cutoff weight of 0.17 (red). Area Un-der the Curve-AUC 0.6816 vs 0.7108.
present in Vogelstein’s list. Of the remaining 40, we found seven to be identified by the CGC, the other 33 we have marked as candidate driver genes, requiring further study.
Our analysis also indicates that a larger network does not always produce better performance in the identification of cancer driver genes. A better quality network based on our weighting outperformed the unweighted network. InFig. 9B, we see DriverNet produce better results when the low weighted interactions were removed. In the calculation of the weights assessing the linear bias correction given inEq. (4),αandβtook on values−0.07439 and 0.39795 respectively. We know each interaction weight is always greater than zero, so when summing positive values, the resultant weights are always greater than zero. The corrected combined weighting resulted in 18,541 interactions falling below the cut-off with a resultant network of 13,862 genes with 372,250 interactions.
CONCLUSIONS
Our approach of combining graphs and weighing their interactions can be used to improve other network graphs.
ACKNOWLEDGEMENTS
Input on the poster, ‘‘Combining gene interaction networks improves the identification of driver genes,’’ submitted at the Virus Evolution and Molecular Epidemiology (VEME) 2015 Workshop—Big Data Module was a valuable contribution to this paper.
ADDITIONAL INFORMATION AND DECLARATIONS
Funding
The authors received no funding for this work.
Competing Interests
The authors declare there are no competing interests.
Author Contributions
• Emilie Ramsahai conceived and designed the experiments, performed the experiments, analyzed the data, wrote the paper, prepared figures and/or tables, reviewed drafts of the paper.
• Kheston Walkins conceived and designed the experiments.
• Vrijesh Tripathi conceived and designed the experiments, analyzed the data, contributed reagents/materials/analysis tools, reviewed drafts of the paper.
• Melford John conceived and designed the experiments, contributed reagents/material-s/analysis tools, wrote the paper, reviewed drafts of the paper.
Data Availability
The following information was supplied regarding data availability:
Public datasets were used and referenced in the manuscript. The raw data has been supplied asSupplementary Files.
Supplemental Information
Supplemental information for this article can be found online athttp://dx.doi.org/10.7717/ peerj.2568#supplemental-information.
REFERENCES
Bashashati A, Haffari G, Ding J, Ha G, Lui K, Rosner J, Huntsman DG, Caldas C, Aparicio SA, Shah SP. 2012.DriverNet: uncovering the impact of somatic driver mutations on transcriptional networks in cancer.Genome Biology13:R124 DOI 10.1186/gb-2012-13-12-r124.
Cancer Genome Atlas Research N, Weinstein JN, Collisson EA, Mills GB, Shaw KR, Ozenberger BA, Ellrott K, Shmulevich I, Sander C, Stuart JM. 2013.The cancer genome Atlas pan-cancer analysis project.Nature Genetics45(10):1113–1120 DOI 10.1038/ng.2764.
Chelliah V, Laibe C. 2013.BioModels database: a repository of mathematical models of biological processes.Methods in Molecular Biology1021:189–199 DOI 10.1007/978-1-62703-450-0_10.
Ciriello G, Cerami E, Sander C, Schultz N. 2012.Mutual exclusivity analysis identifies oncogenic network modules.Genome Research22:398–406
DOI 10.1101/gr.125567.111.
Croft D, Mundo AF, Haw R, Milacic M, Weiser J, Wu G, Caudy M, Garapati P, Gillespie M, Kamdar MR, Jassal B, Jupe S, Matthews L, May B, Palatnik S, Rothfels K, Shamovsky V, Song H, Williams M, Birney E, Hermjakob H, Stein L, D’Eustachio P. 2014.The reactome pathway knowledgebase.Nucleic Acids Research
42(D1):D472–D477DOI 10.1093/nar/gkt1102.
Csardi G, Nepusz T. 2006.The igraph software package for complex network research. InterJournal, Complex Systems1695:1–9.
Fearnley LG, Davis MJ, Ragan MA, Nielsen LK. 2014.Extracting reaction networks from databases-opening Pandora’s box.Briefings in Bioinformatics15(6):973–983 DOI 10.1093/bib/bbt058.
Forbes SA, Bindal N, Bamford S, Cole C, Kok CY, Beare D, Jia M, Shepherd R, Leung K, Menzies A, Teague JW, Campbell PJ, Stratton MR, Futreal PA. 2011.COSMIC: mining complete cancer genomes in the catalogue of somatic mutations in cancer. Nucleic Acids Research39(Suppl 1):D945–D950DOI 10.1093/nar/gkq929.
Futreal PA, Coin L, Marshall M, Down T, Hubbard T, Wooster R, Rahman N, Stratton MR. 2004.A census of human cancer genes.Nature Reviews Cancer4:177–183 DOI 10.1038/nrc1299.
Gentleman RC, Carey VJ, Bates DM, Bolstad B, Dettling M, Dudoit S, Ellis B, Gautier L, Ge Y, Gentry J, Hornik K, Hothorn T, Huber W, Iacus S, Irizarry R, Leisch F, Li C, Maechler M, Rossini AJ, Sawitzki G, Smith C, Smyth G, Tierney L, Yang JY, Zhang J. 2004.Bioconductor: open software development for computational biology and bioinformatics.Genome Biology5:R80DOI 10.1186/gb-2004-5-10-r80.
Hou JP, Ma J. 2014.DawnRank: discovering personalized driver genes in cancer.Genome Medicine6:56DOI 10.1186/s13073-014-0056-8.
Jia P, Zhao Z. 2014.VarWalker: personalized mutation network analysis of putative cancer genes from next-generation sequencing data.PLoS Computational Biology
10:e1003460DOI 10.1371/journal.pcbi.1003460.
Kanehisa M, Goto S, Sato Y, Furumichi M, Tanabe M. 2012.KEGG for integration and interpretation of large-scale molecular data sets.Nucleic Acids Research
40(D1):D109–D114DOI 10.1093/nar/gkr988.
2.5 of the HUPO-PSI format for molecular interactions.BMC Biology5:44 DOI 10.1186/1741-7007-5-44.
Keshava Prasad TS, Goel R, Kandasamy K, Keerthikumar S, Kumar S, Mathivanan S, Telikicherla D, Raju R, Shafreen B, Venugopal A, Balakrishnan L, Marimuthu A, Banerjee S, Somanathan DS, Sebastian A, Rani S, Ray S, Harrys Kishore CJ, Kanth S, Ahmed M, Kashyap MK, Mohmood R, Ramachandra YL, Krishna V, Rahiman BA, Mohan S, Ranganathan P, Ramabadran S, Chaerkady R, Pandey A. 2009. Human protein reference database–2009 update.Nucleic Acids Research37(Suppl 1):D767–D772DOI 10.1093/nar/gkn892.
Khatri P, Sirota M, Butte AJ. 2012.Ten years of pathway analysis: current ap-proaches and outstanding challenges.PLoS Computational Biology8:e1002375 DOI 10.1371/journal.pcbi.1002375.
Kumar G, Ranganathan S. 2013. Biological data integration using network models. In: Elloumi M, Zomaya AY, eds.Biological knowledge discovery handbook: preprocessing, mining, and postprocessing of biological data. Hoboken: Wiley, 155–174.
Maglott D, Ostell J, Pruitt KD, Tatusova T. 2011.Entrez gene: gene-centered informa-tion at NCBI.Nucleic Acids Research39(Suppl 1):D52–D57
DOI 10.1093/nar/gkq1237.
Mathivanan S, Periaswamy B, Gandhi TK, Kandasamy K, Suresh S, Mohmood R, Ramachandra YL, Pandey A. 2006.An evaluation of human protein–protein interaction data in the public domain.BMC Bioinformatics7(Suppl 5):S19 DOI 10.1186/1471-2105-7-S5-S19.
Page L, Brin S, Motwani R, Winograd T. 1999.The PageRank citation ranking: bringing order to the Web. Technical Report. Stanford InfoLab, Stanford.
Schaefer CF, Anthony K, Krupa S, Buchoff J, Day M, Hannay T, Buetow KH. 2009.PID: the pathway interaction database.Nucleic Acids Research37(Suppl 1):D674–D679 DOI 10.1093/nar/gkn653.
Tamborero D, Gonzalez-Perez A, Perez-Llamas C, Deu-Pons J, Kandoth C, Reimand J, Lawrence MS, Getz G, Bader GD, Ding L, Lopez-Bigas N. 2013.Comprehensive identification of mutational cancer driver genes across 12 tumor types.Scientific Reports3:2650 DOI 10.1038/srep02650.
UniProt C. 2010.The universal protein resource (UniProt) in 2010.Nucleic Acids Research38(Suppl 1):D142–D148DOI 10.1093/nar/gkp846.
Vogelstein B, Papadopoulos N, Velculescu VE, Zhou S, Diaz Jr LA, Kinzler KW. 2013. Cancer genome landscapes.Science339(6127):1546–1558
DOI 10.1126/science.1235122.
Wu G, Feng X, Stein L. 2010.A human functional protein interaction network and its application to cancer data analysis.Genome Biology11:R53
DOI 10.1186/gb-2010-11-5-r53.