BioOne sees sustainable scholarly publishing as an inherently collaborative enterprise connecting authors, nonprofit publishers, academic institutions, research libraries, and research funders in the common goal of maximizing access to critical research.
Mitochondrial DNA Polymorphism and Heteroplasmy in
Populations of Aedes aegypti in Brazil
Author(s): Karina Dos Santos Paduan and Paulo Eduardo Martins Ribolla
Source: Journal of Medical Entomology, 45(1):59-67. 2008.
Published By: Entomological Society of America
DOI:
http://dx.doi.org/10.1603/0022-2585(2008)45[59:MDPAHI]2.0.CO;2
URL:
http://www.bioone.org/doi/
full/10.1603/0022-2585%282008%2945%5B59%3AMDPAHI%5D2.0.CO%3B2
BioOne (
www.bioone.org
) is a nonprofit, online aggregation of core research in the
biological, ecological, and environmental sciences. BioOne provides a sustainable online
platform for over 170 journals and books published by nonprofit societies, associations,
museums, institutions, and presses.
Your use of this PDF, the BioOne Web site, and all posted and associated content
indicates your acceptance of BioOne’s Terms of Use, available at
www.bioone.org/page/
terms_of_use
.
Mitochondrial DNA Polymorphism and Heteroplasmy in Populations
of
Aedes aegypti
in Brazil
KARINA DOS SANTOS PADUANANDPAULO EDUARDO MARTINS RIBOLLA1
UNESP, Universidade Estadual Paulista, Instituto de Biocieˆncias, Departamento de Parasitologia, Caixa Postal 510, 18618-000 Botucatu, Sa˜o Paulo, Brazil
J. Med. Entomol. 45(1): 59Ð67 (2008)
ABSTRACT The tropical mosquitoAedes aegypti(Diptera: Culicidae) is the most important do-mestic vector of urban yellow fever and dengue viruses.Ae. aegyptioriginated from Africa and was probably introduced into Brazil during the colonial period through embarkations, and dengue epi-demics soon followed. Genetic analysis of 12Ae. aegyptipopulations from Þve states in Brazil was conducted based on two mitochondrial DNA fragments: cytochrome oxidase I and NADH dehydro-genase subunit 4. Analyses comparing individual haplotypes indicated the existence of two well-deÞned clades, probably representing two mitochondrial lineages. Analysis of molecular variance showed signiÞcant variability in genetic structure among collections within groups. Mantel regression analysis showed a correlation between genetic and geographic distances, mainly because of northern and northeastern populations, in comparison with those in the southeast. The population from Santos, the largest port in Brazil, showed the greatest diversity, with 10 unique haplotypes, an indication of recent introductions that have not yet spread to other Brazilian cities. Different mitochondrial DNA sequences were found in three specimens, indicating the presence of heteroplasmy.
KEY WORDS Aedes aegypti,population genetics, mitochondrial DNA, genetic variability, hetero-plasmy
Aedes (Stegomyia) aegypti(L.) is a geographically widely distributed mosquito of great epidemiological importance, because it is the major vector involved in the transmission of several debilitating or lethal hu-man arboviruses, including yellow fever and dengue viruses (Chow et al. 1998). Dengue is a mosquito-borne endemoepidemic viral disease, caused by any one of the four dengue serotypes. It is a major health problem in many tropical regions of the world. More than 50 million cases of dengue fever and dengue hemorrhagic fever are reported annually worldwide, although the majority of infections may be asymp-tomatic (Holmes and Twiddy 2003).
Efforts to controlAe. aegyptiin the Americas began before the 1940s, when the Pan American Health Or-ganization (PAHO) initiated an eradication program to prevent urban epidemics of yellow fever. The vec-tor was eliminated from 19 countries, including Brazil (Schleissman and Calheiros 1974). Unfortunately, eradication was difÞcult to sustain, and the reintro-duction of this vector insect in Brazil occurred in 1967, with frequent reinvasions since (Monath 1994, Gubler 1997). The direct causes of the present dengue emer-gency are social and demographic. Population growth and unplanned urbanization have increased the den-sities of both vector and host (Gubler 1997). Its wide
distribution nowadays, infesting up to 3,592 munici-palities nationwide (Hono´rio and Lourenc¸ o-de-Oliveira 2001), has made dengue infection a major public health problem, with ⬃40 million cases of dengue fever and several hundred thousand cases of dengue hemorrhagic fever each year. Dengue cases in Brazil represent 80% of those occurring in the Americas (Schatzmayr 2000).
There are many components associated with the epidemiological and transmission cycles of this and other arboviruses transmitted by Ae. aegypti, and genetic factors are responsible for most of the characteristics. Studies have shown variation in vec-tor competence between different populations, and consequently, a signiÞcant amount of research has focused on genetic diversity within the species (Bennett et al. 2002, Lourenc¸o-de-Oliveira et al. 2002, 2004). Studies of the genetic structure of Bra-zilianAe. aegyptipopulations may lead to novel ways of understanding and control of disease transmis-sion.
Mitochondrial DNA (mtDNA) is commonly used for molecular evolution studies in insects (Kambham-pati 1995, Tang et al. 1996) and in population genetics studies (Conn et al. 1993, Besansky et al. 1997, Fonseca et al. 2000), because, as a molecular marker, mtDNA has many advantages (Avise 1994, Howell et al. 1996, Jenuth et al. 1996). TheCOIgene is the largest of the 1Corresponding author, e-mail: pribolla@ibb.unesp.br.
three mitochondrial-encoded cytochrome oxidase subunits and the most conserved among the three cytochrome oxidase coding genes in mtDNA (Clary and Wolstenholme 1985, Beard et al. 1993). The NADH dehydrogenase complex (or mitochondrial re-spiratory complex I) is composed of a large number of subunits, several of which are encoded by mtDNA. Genetic analysis ofAedesandAnophelesspecies has been conducted in particular with ND4 (NADH de-hydrogenase subunit 4) and ND5 (NADH dehydro-genase subunit 5) mtDNA loci, and these loci have been shown to be highly polymorphic (de Merida et al. 1999, Gorrochoteghi-Escalante et al. 2000, 2002).
mtDNA does not recombine (Hayashi et al. 1985), although some evidence of recombination events has recently been reported (Eyre-Walker et al. 1999, Hagelberg et al. 1999). Individuals are usually ho-moplasmic for one mitochondrial haplotype, although heteroplasmic conditions have been reported in many species (bats, Wilkinson and Chapman 1991; Drosoph-ila,Volz-Lingenho¨hl et al. 1992; perch, Nesbøet al. 1998). InDrosophila,a small (0.1% or less) but fre-quent inheritance of sperm mtDNA has been found (Kondo et al. 1992). Studies using sequence analysis of two types of mtDNA inD. simulansrevealed that two sequences differed by⬇2%, which clearly rules out heteroplasmy produced by a single mutation event and strongly suggests paternal transmission of mtDNA inDrosophila(Solignac et al. 1986, Satta and Chigusa 1991).
In Brazil, an early population genetic study using random ampliÞed polymorphic DNA (RAPD) (Paduan et al. 2006) investigatedAe. aegypti popu-lations representing certain important commercial routes in Þve demographic regions spanning six states. The results indicated that the populations were clustered by geographic region and showed isolation by distance. However, this molecular marker showed few genetic variations between cit-ies within the regions. In this study, mtDNA COI and ND4 sequences were used to characterize vari-ation among these samples in Brazil.
Materials and Methods
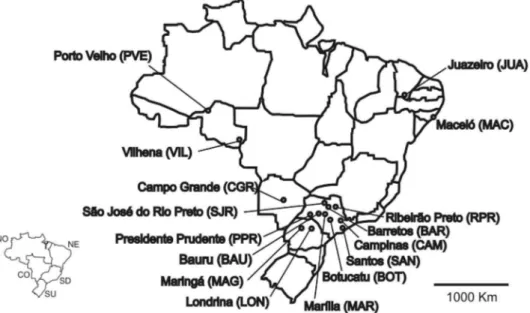
Mosquito Collection and DNA Extraction. Popula-tions were obtained from 12 cities in the Brazilian states of Alagoas, Ceara´, Mato Grosso do Sul, Parana´, Rondoˆnia, and Sa˜o Paulo from January to March 2002 as part of work for the BrazilianAedessurvey Agencies (SUCEN and FNS). A total of 125 individuals were analyzed. The collection sites are listed in Table 1, and the geographic locations of all sampling sites are shown in Fig. 1. Specimens were collected as eggs by ovitraps (usually 500 Ð1,000 ovitraps/city) and were reared to adult stage in insectaries under standardized conditions (25⫾1⬚C, 80⫾10% RH, and 12-h light/ dark cycle). The pupae were isolated, and emerging female adult mosquitoes were frozen and stored at
⫺20⬚C.
Individual female mosquitoes were placed in 1.5-ml microcentrifuge tubes and homogenized with 100l lysis buffer (10 mM Tris-HCl, pH 8.0, containing 0.2 M NaCl, 25 mM EDTA, and 0.5% [vol:vol] sodium do-decyl sulfate). DNA was extracted by ethanol precip-itation following a modiÞcation of the procedure de-scribed by Bender et al. (1983). The Þnal DNA pellet was reconstituted in 100 l of TE buffer (10 mM Tris-HCl, 1 mM EDTA, pH 8.0). DNA concentration was estimated by comparison with known amounts of electrophoretic standards (HindIII digested). DNA working solutions were prepared at a concentration of 10 ng/l in TE buffer and stored at⫺70⬚C.
Polymerase Chain Reaction and Sequencing.DNA samples were used as templates for the ampliÞcation of speciÞc fragments of mtDNA: a 450-bp fragment for COI and a 390-bp fragment for ND4. Two sets of primers were used: for COI, Fly5IP (5⬘ -GGATTATT-AGGATTTATTGT-3⬘) and Fly10IP (5⬘ -GCAAATA-ATGAAATTGTTCT-3⬘) (Sallum et al. 2002); and for ND4, ND4 F (5⬘-TGATTGCCTAAGGCTCATGT-3⬘) and ND4R (5⬘-TTCGGCTTCCTAGTCGTTCAT-3⬘), modiÞed by Gorrochoteghi-Escalante et al. (2000). TheCOIgene was ampliÞed with Fly5 primer (rep-resenting nucleotides 842Ð 861 in Anopheles quadri-maculatus[NC 000875]) and Fly10 primer
(repre-Table 1. Locations, coordinates, sample sizes, and mitochondrial haplotypes ofAe. aegypticollections in Brazil
State Cities Latitude/longitude N Haplotype frequencies
Alagoas Maceio 09⬚39⬘57⬙S/35⬚44⬘07⬙W 10 H1(10)
Ceara´ Juazeiro do Norte 07⬚12⬘47⬙S/39⬚18⬘55⬙W 10 H1(5), H2(1),aH5(3),aH6(1)a Mato Grosso Sul Campo Grande 09⬚57⬘28⬙S/36⬚47⬘30⬙W 10 H1(10)
Parana´ Londrina 23⬚18⬘37⬙S/51⬚09⬘46⬙W 10 H21(1), H22(1),aH27(8) Rondoˆnia Vilhena 12⬚44⬘26⬙S/60⬚08⬘45⬙W 10 H1(2), H25(1),H27(7)
Rondoˆnia Porto Velho 15⬚38⬘42⬙S/56⬚05⬘52⬙W 15 H26(4), H27(2), H28(8),aH29(1)a Sa˜o Paulo Barretos 20⬚33⬘26⬙S/48⬚34⬘04⬙W 10 H1(1), H19(1),aH20(1),aH21(1),aH24(6)a Sa˜o Paulo Bauru 22⬚18⬘53⬙S/49⬚39⬘38⬙W 10 H7(2), H10(1),aH27(7)
Sa˜o Paulo Botucatu 22⬚53⬘09⬙S/48⬚26⬘42⬙W 10 H1(10)
Sa˜o Paulo Campinas 28⬚57⬘39⬙S/51⬚31⬘55⬙W 10 H1(7), H3(1), H7(1),H27(1) Sa˜o Paulo Marlia 22⬚12⬘50⬙S/49⬚56⬘45⬙W 10 H1(4), H5(3), H7(1),aH8(1),aH9(1)a Sa˜o Paulo Santos 23⬚57⬘39⬙S/46⬚20⬘01⬙W 10 H4(1),aH11(1),aH12(1),aH13(1),aH14(1),a
H15(1),aH16(1),aH17(1),aH18(1),aH23(1)a
Haplotypes in bold represent clade 2 and the others represent clade 1. aRare haplotypes.
N,sample size used for the COI and ND4 analysis; Hx (N), no. of individuals in each haplotype.
senting positions 1,371Ð1,392 inDrosophila yakuba). For theND4gene, the ampliÞed region corresponds to nucleotides 8,519 Ð 8,880 inAe. albopictus(GenBank no. AY072044).
Each reaction was performed in a Biometra thermal cycler, in a Þnal volume of 25l. For the COI and ND4, the polymerase chain reaction (PCR) mixture con-tained ⬇100 ng genomic DNA, 1⫻ buffer, 2 mM MgCl2, 2.5 mM dNTP (GE Healthcare, Bucks, United
Kingdom), 20M of each primer, and 1.5 UTaq poly-merase (GE Healthcare). The PCR program involved three cycles of 94⬚C for 2 min, 37⬚C for 2 min, 72⬚C for 1 min, and 35 cycles of 94⬚C for 30 s, 50⬚C for 30 s, 72⬚C for 1 min, and a Þnal extension step of 72⬚C for 5 min. PCR products were separated by agarose-gel electro-phoresis and puriÞed using an Eppendorf DNA Kit. PuriÞed DNA fragments were directly sequenced in an automated DNA sequencer (ABI Prism 377), using the Big Dye Terminator Cycle Sequencing Ready Re-action Kit (PE Applied Biosystems, Foster City, CA). Consensus sequences were obtained through the analysis of the sense and antisense sequences using the MERGER program (http://bioweb.pasteur.fr/ seqanal/alignment/intro-uk.html). The CLUSTAL W program (Thompson et al. 1994) with default param-eters was used to align.
Statistical Analysis of Mitochondrial Haplotype Fre-quencies.Variations in haplotype frequencies within and among cities were examined by analysis of mo-lecular variance (AMOVA) (ExcofÞer et al. 1992) using Arlequin 2.0 (Scheneider et al. 2000). The sig-niÞcance of the variance components associated with each level of genetic structure was computed using a nonparametric permutation test with 1,000 permuta-tions.
For each collection, the nucleotide sequence and the frequency of haplotypes for each collection were
entered into DnaSP software, version 3.5 (Rozas and Rozas 1999). The number of polymorphic sites, the average number of nucleotide differences (), the nucleotide diversity (1), the nucleotide diversity
with Jukes and Cantor correction (2), the
synony-mous and nonsynonysynony-mous sites, and haplotype diver-sity (Hd) were estimated. The neutrality tests TajimaÕs D (Tajima 1989) and F*and D*(Fu and Li 1993) were applied to study forces that may be involved in alter-ations of DNA sequences such as mutalter-ations, natural selection, and the combination of both, because the polymorphism pattern in populations is affected by selection (Tajima 1989, Fernandes-Matioli 2001).
Pairwise genetic differences among populations were estimated as NST, which is similar to FST but
incorporates sequence divergence among haplotypes into the distance estimate. This is equivalent to the inÞnite-sites model of FSTbased on DNA sequence
data with the Jukes and Cantor correction applied. Pairwise effective migration rates (Nm, expressed as the number of reproductive migrants per generation) were calculated from NST. Pairwise NSTvalues were
transformed to NST/(1⫺NST) and regressed on
pair-wise geographic distances. Geographic coordinates were obtained with a GPS. The geographic distance matrices were constructed using the GenALEx pack-age (Peakall and Smouse 2006) and transformed (log10) geographic distances (km) among populations
to compute the Mantel statistics (Mantel and Valand 1970) and to test for isolation by distance. Regression analysis and the Mantel test were performed using Mantel (Rousset 1997).
The relationships between A. aegyptihaplotypes were inferred in Network Software version 4.2.0.1 (Fluxus Technology, Suffolk, England) to create an unrooted haplotype network, using star contraction.
Results
Sequence Variation. Mitochondrial fragments of theCOIand ND4genes from 125 specimens ofAe. aegyptiwere sequenced. The COI fragment contained 450 nucleotides; however, a sequence made up of 417 sites was used. Five sites were polymorphic, and all were phylogenetically informative. The analyses re-vealed the existence of seven different haplotypes (GenBank accession numbers AY851649 ÐAY851654), resulting from Þve transitions. The haplotypes were distinguished by single CNT transitions at positions 003, 225, 246, and 390 and by a single GNA transition at position 405. The collections showed an average number of nucleotide differences among individu-als (k⫽2.042) with the nucleotide diversity (⫽
0.00485) and haplotype (gene) diversity (Hd ⫽
0.596).
The ND4 fragment contained 390 nucleotides; how-ever, a sequence made up of 376 sites was used. The alignment of 125 sequences showed that 15 sites were polymorphic, and all were informative. The analyses of gene fragments revealed the existence of 24 different haplotypes (GenBank accession numbers AY906835ÐAY906853). Fifteen synonymous polymor-phic sites were recognized. Haplotypes were distin-guished by 14 single CNT or GNA transitions and by 1 single A N T transversion at position 282. The collections showed an average number of nucle-otide differences among individuals (k⫽6.542) with
the nucleotide diversity (⫽0.01740) and haplotype (gene) diversity (Hd⫽0.787).
Combined Data and Genetic Analysis.When the combined analysis for the two genes was performed, 20 informative characters were found in 793 bp, and 29 distinct haplotypes were identiÞed among theAe. ae-gyptipopulations. The predominance of two haplo-types (H1 and H27) was observed in almost all of the populations in the different geographical areas. Beside these, we found rare or exclusive haplotypes in pop-ulations such as Barretos, Juazeiro do Norte, Marõ´lia, and Santos. All haplotypes of the Santos population were exclusive. The distributions of haplotypes in pop-ulations are listed in Table 1. The genetic parameters obtained for the populations of this species indicate good levels of genetic variability. The collections showed an average number of nucleotide differences among individuals (k⫽8.553), with moderate nucle-otide diversity ( ⫽ 0.0107) and high haplotype (gene) diversity (Hd⫽0.800). The number of vari-able loci and the observed frequencies for each col-lection and for all mosquitoes are shown in Table 2.
Neutrality tests were applied in all Brazilian popu-lations. The results were statistically signiÞcant, Taji-maÕs D (3.692;P⬍0.001), Fu and LiÕs D*(1.745;P⬍
0.02), and Fu and LiÕs F*(2.980;P⬍0.02), indicating that the populations are in balance in relation to the haplotypes of mtDNA. However, when the tests were repeated only in populations with polymorphic
se-Table 2. The no. of polymorphic sites and mutation positions of each haplotype in theCOIandND4genes
0 2 2 3 4 4 4 5 5 5 5 5 6 6 6 6 6 7 7 7
0 2 4 9 0 4 5 0 4 6 7 7 1 4 6 9 9 0 1 4 Na
3 5 6 0 5 4 0 1 0 1 0 9 8 5 3 6 9 5 1 1
H01 C C C T G C T C A T C G C G C G A T G T 49
H02 . . . A . 1
H03 . T T C A T . T G C T A T A T A T . A C 1
H04 T . . . C . . . . A . . . C A . 1
H05 . . . T . . . A . 6
H06 . . . T . . . 1
H07 . . T C A . . T . C T A T . T A . . A . 4
H08 . T T C A T . T G C T A T . T A T . A C 1
H09 . T T C A . C T . C T A T A T A T . A C 1
H10 . T T C A T . T . C T A T . T A T . A C 1
H11 T . . . . T . T . . . A . . . A . 1
H12 . . . C . . C . . . 1
H13 . . . C . . . . A . . . 1
H14 T . . . A . . . A . 1
H15 . . . C . . . A C 1
H16 T . . . C . . . . A . . . A . 1
H17 . . . C . . . 1
H18 . . . C . . . . A . . . C A . 1
H19 . T T C A T . T G C T A T . T A . . A C 1
H20 . . T C A T . T G C T A T . T A . . A C 1
H21 . T T C A T C . . C . A T A T A T . A C 2
H22 . T T C A . C . . . . A . . . A . 1
H23 . . . C . . . C 1
H24 . T T C A . . T G C T A T . T A T . A C 6
H25 . T T C A . C T G C T A T . T A T . A C 1
H26 . T T C A T . T . C T A T . T A . . A C 4
H27 . . . . A . C . . . 25
H28 . T T C A T . T . C T A T . T A T . A . 8
H29 . T T C A T . T . C T A T A T A T . A C 1
The Þrst Þve polymorphic sites (003, 225, 246, 390, and 405) are for theCOIgene, and all others are for theND4gene. aNo. of individuals in each haplotype.
quences, they deviated from neutrality, which as a whole was caused by the heterogeneity of sequences. The analysis using a haplotype network based on statistical parsimony resulted in an unrooted cla-dogram where each mutational step is represented (Fig. 2). Twenty-seven different haplotypes were represented in two main groups, which also sup-ported two clades. These showed high levels of variation: within the Þrst clade, there were 38 poly-morphic sites, and within the second clade, there were 33 polymorphic sites. There were eight poly-morphic sites between the two clades. The two clades represent two main maternal lineages in Bra-zil. The Þrst clade accounted for⬇57% of the sam-ples; the most prevalent haplotype was H1, with
⬇39% of the individuals. Although high, the level of variation of the clades was much lower than the level of variation of all of the samples. This is re-ßected in , 1, and 2 values for the individual
clades (Table 3). The Santos population showed the most mutations among individuals: this can be seen in Fig. 2, where the haplotypes are the most distant of the main haplotypes (e.g., H16, H11, H17, and H18) in each respective clade. When the Santos population was removed from the analyses, the in-dexes decreased mainly in clade 1 compared with those of the entire data set (Table 3).
Gene ßow estimates varied widely among popula-tions. Pairwise NST values ranged from 0 to 0.686,
corresponding to an Nm of inÞnity (identical haplo-type frequencies) to 0.23 reprodutive migrants per generation. All of the highest NST values (⬎0.900)
were contributed by the Londrina and Porto Velho populations. The dendogram based on linearized NST
values identiÞed two distinct, very well-deÞned clades
among the 29 haplotypes detected in Brazilian Ae. aegyptipopulations, with indication of a paraphyletic origin (data not shown).
Pairwise linearized NST values were regressed
against the natural logarithm of the pairwise geo-graphic distances among populations to test for isola-tion by distance. This analysis indicated a nonsigniÞ-cant correlation between genetic and geographic distances amongAe. aegyptiin Brazil (r2
⫽0.018,P⫽
0.17). However, when the Mantel test was performed excluding the cities of Botucatu and Londrina, where winter temperatures are lower, there was a positive correlation between geographic localities and genetic diversity (r2
⫽0.069, MantelP⫽0.03).
Variation in mtDNA sequences was partitioned by AMOVA. When grouped by cities at or near where the groups originated, most (53.09%) of the variation was found among populations within groups (P ⬍ 0.0001). Within groups, a smaller (25.26%), but highly signiÞcant proportion of the variation was found (P⬍0.0001). This indicates that substantial population structuring occurs within populations at this geographic scale. Among groups, 21.64% of the variation was found, showing signif-icant genetic structuring at this level. The high Þx-ation indices (FST⫽0.74738) also showed the
sig-niÞcance of genetic structuring when different urban populations were compared.
Analysis of the 125 chromatograms revealed the existence of at least three individuals containing two different ND4 sequences. Sequences in both direc-tions showed the existence of a polymorphism at the same site. All three cases of heteroplasmy occurred at the polymorphic sites described in this study.
Discussion
Different studies of Ae. aegypti populations throughout the world have shown that breeding structure varies geographically. The goal of this study was to use two mitochondrial loci to charac-terize the pattern of genetic differentiation and population structure of this species in Brazil. The results reported here suggest several hypotheses regarding the colonization history and current pop-ulation dynamics ofAe. aegyptiin Brazil.
Nucleotide diversity () in theND4mitochondrial gene inAe. aegyptiwas signiÞcantly greater thanin the mitochondrialCOIgene. This difference may arise because of higher constraints on the mutation rate (i.e., balancing selection) in theCOIgene. Alterna-tively, the higher diversity rate in theND4gene may be caused by the existence of two well-supported clades inAe. aegypti,which were detected in Mexican populations (Gorrochotegui-Escalante et al. 2002). Compared with studies of ND4 from Mexico, the nu-cleotide diversity was similar to the Brazilian north-eastern region (0.01434) (Gorrochotegui-Escalante et al. 2000), the Yucatan Peninsula (0.2161), and the Mexican northeastern region (0.1636) (Gorrochote-gui-Escalante et al. 2002).
Analysis of ND4 sequences fromAe. aegyptiin Brazil revealed the presence of 24 different haplotypes, whereas 25 haplotypes were detected in Mexico (Gor-rochotegui-Escalante et al. 2002). There was a similar number of polymorphic sites (16 Ð24), although with two well-supported clades, differing from the struc-ture observed in Mexico. Members of clade 1 were present in the basal lineage identiÞed in the Mexico study, and clade 2 members were grouped into the derived lineage. The presence of two major clades may support the hypothesis presented by the Mexico
and Thailand studies, in that two lineages present in both regions evolved before the introduction of this mosquito from its ancestral source, presumably in North Africa (Tabachnick 1991). However, combined analysis of the COI and ND4 genes indicated two distinct lineages without a common origin. In our case, the combined analysis provided a larger number of informative sites and explanatory power for the se-quences. The existence of these distinct mitochondrial lineages inAe. aegyptimay support the existence of distinct, historic, matriarchal lineages within the Bra-zilian population. This suggests that different mito-chondrial lineages were introduced into Brazil or rep-resent a recent introgression of a new maternal lineage. These results are also consistent with the analysis of the collections from Mexico (Gorrochote-gui-Escalante et al. 2000).
Northeastern Brazil is more arid than other regions, with extended periods of drought. In this study, these populations did not seem to be strongly genetically isolated by distance from any other. However, a pre-vious study by our group using RAPD markers showed thatAe. aegyptipopulations from northeastern Brazil seem to be strongly genetically isolated by distance from all the others, but are genetically homogeneous within the region. Similar results were obtained in northeastern Mexico, when analyses were performed using RAPD and mitochondrial markers (Gorrocho-tegui-Escalante et al. 2002). The patterns of diversity identiÞed in this study suggest that haplotypes among
Ae. aegypti in Brazil vary by region. Mosquitoes in northeastern Brazil contained only 4 of the 29 haplo-types that have been detected thus far. Furthermore, in this study, genetic diversity was low among north-eastern populations.
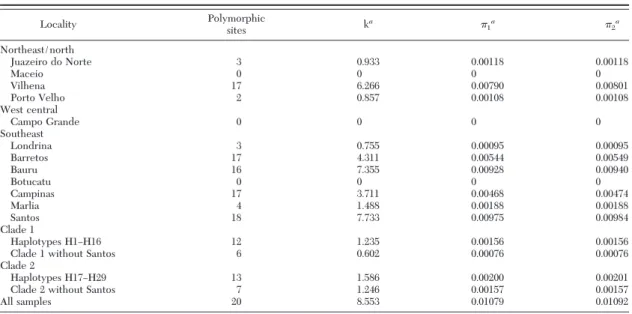
Table 3. Variability estimates in the COI and NADH mitochondrial fragments amongAe. aegyptipopulations in Brazil
Locality Polymorphic
sites ka 1a 2a
Northeast/north
Juazeiro do Norte 3 0.933 0.00118 0.00118
Maceio 0 0 0 0
Vilhena 17 6.266 0.00790 0.00801
Porto Velho 2 0.857 0.00108 0.00108
West central
Campo Grande 0 0 0 0
Southeast
Londrina 3 0.755 0.00095 0.00095
Barretos 17 4.311 0.00544 0.00549
Bauru 16 7.355 0.00928 0.00940
Botucatu 0 0 0 0
Campinas 17 3.711 0.00468 0.00474
Marlia 4 1.488 0.00188 0.00188
Santos 18 7.733 0.00975 0.00984
Clade 1
Haplotypes H1ÐH16 12 1.235 0.00156 0.00156
Clade 1 without Santos 6 0.602 0.00076 0.00076
Clade 2
Haplotypes H17ÐH29 13 1.586 0.00200 0.00201
Clade 2 without Santos 7 1.246 0.00157 0.00157
All samples 20 8.553 0.01079 0.01092
a, avg. no. of differences;
1, nucleotide diversity;2, nucleotide diversity with Jukes and Cantor correction.
Data from RAPDs of the same samples (Paduan et al. 2006) showed no indication of recent introductions of Ae. aegypti, because there was good correlation between geographic and genetic data. Populations from the northeast seem to be partially isolated from the rest of the country. In contrast to what was ob-served with RAPD analysis, this study showed indi-cations of different introductions in Santos, which contains 10 exclusive haplotypes (H07, H12ÐH19, and H22), suggesting multiple introductions that have not yet spread to the rest of the Brazilian territory.
When the haplotype diagram was analyzed, two major haplotypes (H1 and H27) were observed. Most of the variations from these two haplotypes, apart from H11ÐH18, were seen principally in Santos, where cer-tain haplotypes showed four or Þve mutation steps from the two main groups (H1 and H27), indicating different introductions. Because Santos is the largest port in Latin America, these variants may represent recent introductions that have not yet spread to the rest of the country.
Unique haplotypes were also found in Barretos (H19, H20, H21, H24), Marilia (H08, H09), Bauru (H10), Campinas (H03), Londrina (H22), Porto Velho (H26, H28, H29), and Vilhena (H25). Haplo-type H01 was the most common haploHaplo-type, found in eight populations, and was most frequent in south-eastern, northsouth-eastern, and central-western popula-tions. Haplotype H27 was the second most common haplotype, found in four populations, and was most frequent in southeastern, southern, and northern pop-ulations.
Genetic diversity among southeasternAe. aegypti
populations also varied greatly, showing high diversity between cities. Gene ßow was low among southeast-ern populations (Nm⫽0.96), and some populations situated ⬍250 km apart shared no common haplo-types. The results showed signiÞcant population struc-turing within these populations; however, the Mantel analysis showed no isolation by distance in popula-tions in the state of Sa˜o Paulo. Human movements can transport mosquitoes between cities, thus increasing genetic similarity among geographically distant pop-ulations in Sa˜o Paulo state. In Mexico, over distances of 100 Ð300 km, the populations remained genetically uniform, and at distances⬎300 km, the populations seemed to be isolated. In that case, collections within 130 km of each other in northeastern Mexico and within 180 km in the Yucatan showed no barrier to gene ßow (Gorrochotegui-Escalante et al. 2002). This pattern suggests that gene ßow among populations decreases with increasing geographic distance.
Analysis of populations also revealed the existence of several genetically distinct populations. These in-cluded CGR, BTU, and MAC, all of which showed low genetic variability, with the presence of a unique hap-lotype (H1). This is consistent with the hypothesis that these populations were established by few mos-quitoes and that a substantial bottleneck occurred during or after the founding of these populations. Genetic bottlenecks in local populations could be gen-erated by vector-control efforts, thus affecting their
genetic similarity with other populations. Mantel anal-ysis only showed signiÞcant correlation between ge-netic and geographic distances when the Botucatu and Londrina populations were excluded. These two cities have the coldest winters of all the localities analyzed, with temperatures as low as 0⬚C, which may also lead to bottlenecks inAe. aegyptipopulations. No correla-tion between southeastern populacorrela-tions occurred. This result is consistent with results for the Ae. aegypti
populations in Mexico, where populations from the Yucatan and the PaciÞc coastal region showed genetic isolation by distance. The present AMOVA results were highly consistent, with 53% of the variation found among populations within groups. More impor-tantly, variation among populations within cities showed a high degree of genetic differentiation at this spatial scale. Genetic structure at this level was highly signiÞcant (P⬍0.001).
Taken together, the analysis of mtDNA in Brazilian populations ofAe. aegyptishowed that dispersion of the vector seems not to be correlated with human activity, and the island model could be used to explain population structure. New mosquito introductions are not signiÞcant in the cities analyzed, except for Santos, where the only exclusive haplotypes were found. These introductions in Santos have not penetrated Brazil by land, another indication of low rates of mos-quito dispersal.
In some specimens (3 of 125), the presence of more than one sequence of mtDNA was found within cells, a phenomenon called heteroplasmy. Most of the het-eroplasmy observed in insects consist of length vari-ation of the AT-rich control region of the mtDNA (Solignac et al. 1986, Satta and Chigusa 1991). This region is characterized to be rich in tandem repeats that can vary in length by slipped-strand mispairing during replication (Solignac et al. 1986, Buroker et al. 1990, Hayasaka et al. 1991, Lewis et al. 1994). In this case, the occurrence of mutation within the individual could be the mechanism for the heteroplasmy.
The occurrence of two distinct mitochondrial gene sequences in one individual could be explained by three factors: sequencing of a nuclear pseudo-gene, mutation within the mtDNA within the cells, or pa-ternal leakage of mitochondria. The sequence of a pseudo-gene would produce polymorphism in differ-ent sites that we observed in mtDNA gene. Because the polymorphism that we found occurs at the same point where we observed polymorphism in Brazilian populations, we believe that paternal leakage is the most parsimonious explanation for the observed het-eroplasmy. It is possible that this event was underes-timated, because sequencing is not the best way to reveal this kind of heteroplasmy in the mitochondrial genome.
Acknowledgments
M.d.L.G. Mac¸oris (from SUCEN) and Prof. N. G. Madeira (from UNESP) for providing mosquito samples and N. G. Madeira for helpful comments and suggestions.
References Cited
Avise, J. C. 1994. Molecular markers, natural history and evolution. Chapman & Hall, New York.
Beard, C. B., D. M. Hamm, and F. H. Collins. 1993. The mitochondrial genome of the mosquitoAnopheles gam-biae:DNA sequence, genome organization, and compar-isons with mitochondrial sequences of other insects. Insect Mol. Biol. 2: 103Ð124.
Bender, W., P. Spierer, and D. S. Hogness. 1983. Chromo-somal walking and jumping to isolate DNA from the Ace and rosy loci and the bithorax complex inDrosophila melanogaster.J. Mol. Biol. 168: 17Ð33.
Bennett, K. E., K. E. Olson, M. L. Mun˜oz, I. Ferna´ndez-Salas, J. A. Farfa´n-Ale´, S. Higgs, W. C. Black, and B. J. Beaty. 2002. Variation in vector competence for dengue 2 virus among 24 collections ofAedes aegyptifrom Mexico and the United States. Am. J. Trop. Med. Hyg. 67: 85Ð92.
Besansky, N. J., T. Lehmann, G. T. Fahey, D. Fontelli, L. E. Braack, W. A. Hawley, and F. H. Collins. 1997. Patterns of mitochondrial variation within and between African malaria vectorsAnopheles gambiae andAnopheles ara-biensis,suggest extensive gene ßow. Genetics 147: 1817Ð 1828.
Buroker, N. E., J. R. Brown, T. A. Gilbert, P. J. O’Hara, A. T. Beckenbach, W. K. Thomas, and M. J. Smith. 1990.
Length heteroplasmy of sturgeon mitochondrial DNA: an illegitimate elongation model. Genetics 124: 157Ð163.
Chow, V.T.K., Y. C. Chan, R. Yong, K. M. Lee, L. K. Lim, Y. K. Chung, S. G. Lam-Phua, and B. T. Tan. 1998. Monitoring of dengue viruses in Þeld-caughtAedes aegyptiandAedes albopictus mosquitoes by a type-speciÞc polymerase chain reaction and cycle sequencing. Am. J. Trop. Med. Hyg. 58: 578 Ð586.
Clary, D. O., and D. R. Wolstenholme. 1985. The mitochon-drial DNA molecule ofDrosophila yakuba:nucleotide sequence, gene organization, and genetic code. J. Mol. Evol. 22: 252Ð271.
Conn, J., A. F. Cockburn, and S. E. Mitchell. 1993. Popula-tion differentiaPopula-tion of the malaria vectorAnopheles aqua-salisusing mitochondrial DNA. J. Heredity 84: 248 Ð253.
de Merida, A.M.P., M. Palmieri, M. M. Yurrita, A. Molina, E. Molina, and W. C. Black. 1999. Mitochondrial DNA variation amongAnopheles albimanuspopulations. Am. J. Trop. Med. Hyg. 61: 230 Ð239.
Excoffier, L., P. E. Smouse, and J. M. Quatro. 1992. Analysis of molecular variance inferred from metric distances among DNA haplotypes: application to human mitochon-drial DNA restriction data. Genetics 131: 479 Ð 491.
Eyre-Walker, A., N. H. Smith, and M. J. Smith. 1999. How clonal are human mitochondria? Proc. R. Soc. Lond. Ser. B. 266: 477Ð 483.
Fernandes-Matioli, F.M.C. 2001. Genealogias e o processo de coalesceˆncia, pp. 162Ð171.InS. R. Matioli (ed.), Bio-logia molecular e evoluc¸a˜o. Holos, Ribeira˜o Preto, Brazil.
Fonseca, D. M., D. A. Lapointe, and R. C. Fleischer. 2000.
Bottlenecks and multiple introductions: population ge-netics of the vector of avian malaria in Hawaii. Mol. Ecol. 9: 1803Ð1814.
Fu, Y. K., and W. H. Li. 1993. Statistical tests of neutrality mutations. Genetics 133: 609 Ð709.
Gorrochotegui-Escalante, N., M. L. Munoz, I. Fernandez-Salas, B. J. Beaty, and W. C. Black. 2000. Genetic isola-tion by distance amongAedes aegyptipopulations along
the northeastern coast of Mexico. Am. J. Trop. Med. Hyg. 62: 200 Ð209.
Gorrochotegui-Escalante, N., C. Gomes-Machorro, S. Lozano-Fuentes, I. Fernandez-Salas, M. L. Munoz, J. A. Farfan-Ale, J. Garcia-Rejon, B. J. Beaty, and W. C. Black. 2002. Breeding structure ofAedes aegyptipopulations in Mexico varies by region. Am. J. Trop. Med. Hyg. 66: 213Ð222.
Gubler, D. J. 1997. Dengue and dengue hemorrhagic fever; its history and resurgence as a global public health prob-lem, pp. 1Ð22.InD. J. Gubler and G. Kuno (eds.), Dengue and dengue hemorrhagic fever. CAB International, New York.
Hagelberg, E., N. Goldman, P. Lio´, S. Whelan, W. Sciefen-ho¨vel, J. B. Clegg, and D. K. Bowden. 1999. Evidence for mitochondrial recombination in a human population of island Melanesia. Proc. R. Soc. Lond. Ser. B. 266: 485Ð 492.
Hayasaka, K., T. Ishida, and S. Horai. 1991. Heteroplasmy polymorphism in the major noncoding region of mito-chondrial DNA in Japanese monkeys: association with tandemly repeated sequences. Mol. Biol. Evol. 8: 399 Ð 415.
Hayashi, J. I., Y. Tagashira, and M. C. Yoshida. 1985. Ab-sence of extensive recombination between inter and in-traspecies mitochondrial DNA in mammalian cells. Exp. Cell Res. 160: 387Ð395.
Holmes, E. C., and S. S. Twiddy. 2003. The origin, emer-gence and evolutionary genetics of dengue virus. Infect. Genet. Evol. 78: 1Ð10.
Hono´rio, N. A., and R. Lourenc¸o-de-Oliveira. 2001. Fre-qu¨eˆncia de larvas e pupas deAedes aegyptieAedes al-bopictusem armadilhas, Brasil. Rev. Saude Publica 35: 385Ð391.
Howell, N., I. Kubacka, and D. A. Mackey. 1996. How rap-idly does the human mitochondrial genome evolve? Am. J. Hum. Genet. 59: 501Ð509.
Jenuth, J. P., A. C. Peterson, K. Fu, and E. A. Shoubridge. 1996. Random genetic drift in the female germline ex-plains the rapid segregation of mammalian mitochondrial DNA. Nat. Genet. 14: 146 Ð151.
Kambhampati, S. 1995. A phylogeny of cockroaches and related insects based on DNA sequence of mitochondrial ribosomal RNA genes. Proc. Natl. Acad. Sci. U.S.A. 92: 2017Ð2020.
Kondo, R., E. T. Matsuura, and S. I. Chigusa. 1992. Further observation of paternal transmission ofDrosophila mito-chondrial DNA by PCR selective ampliÞcation method. Genet. Res. 59: 81Ð 84.
Lewis, D. L., C. L. Farr, A. L. Farquhar, and L. S. Kaguni. 1994. Sequence organization, evolution of the A⫹T re-gion of Drosophila melanogaster mitochondrial DNA. Mol. Biol. Evol. 11: 523Ð538.
Lourenc¸o-de-Oliveira, R., M. Vazeille, A.M.B. Filippis, and A. B. Failloux. 2002. Oral susceptibility to yellow fever virus ofAedes aegyptifrom Brazil. Mem. Inst. Oswaldo Cruz. 97: 437Ð 439.
Lourenc¸o-de-Oliveira, R., M. Vazeille, A.M.B. Filippis, and A. B. Failloux. 2004.Aedes aegyptiin Brazil: genetically differentiated populations with high susceptibility to den-gue and yellow fever viruses. Trans. R. Soc. Trop. Med. Hyg. 98: 43Ð54.
Mantel, N., and R. S. Valand. 1970. A technique of a non-parametric multivariate analysis. Biometrics 26: 547Ð558.
Monath, T. P. 1994. Yellow fever and dengueÑthe interac-tions of virus, vector and host in the re-emergence of epidemic disease. Semin. Virol. 5: 133Ð145.
Nesbø, C. L., M. O. Arab, and K. J. Jakobsen. 1998. Hetero-plasmy, length and sequence variation in the mtDNA
control regions of three Percid Þsh species (Perca fluvia-tilis, Acerina cernua, Stizostedion lucioperca). Genetics 148: 1907Ð1919.
Paduan, K. S., J. P. Arau´jo-Ju´nior, and P.E.M. Ribolla. 2006.
Genetic and variability in geographical populations of
Aedes aegyptiin Brazil elucidated by molecular markers. Genet. Mol. Biol. 29: 391Ð395.
Peakall, R., and P. E. Smouse. 2006. GENALEX 6: genetic analysis in Excel. Population genetic software for teach-ing and research. Mol. Ecol. Notes 6: 288 Ð295.
Rousset, F. 1997. Genetic differentiation and estimation of gene ßow from F-statistics under isolation by distance. Genetics 145: 1219 Ð1228.
Rozas, J., and R. Rozas. 1999.DnaSP version 3: an integrated program for molecular population genetics and molecular evolution analysis. Bioinformatics 15: 174 Ð175.
Sallum, M.A.M., T. R. Schultz, P. G. Foster, K. Aronstein, R. A. Wirtz, and R. C. Wilkerson. 2002. Phylogeny of Anophelinae (Diptera: Culicidae) based on nuclear ri-bosomal and mitochondrial DNA sequences. Syst. Ento-mol. 27: 361Ð382.
Satta, Y., and S. I. Chigusa. 1991. Mitochondrial DNA in
Drosophila:the genetics and evolution, pp. 117Ð134.InM. Kimura and N. Takahata (eds.), New aspects of the ge-netics of molecular evolution. Japan ScientiÞc Societies Press, Tokyo, Japan.
Schatzmayr, H. G. 2000. Dengue situation in Brazil by year 2000. Mem. Inst. Oswaldo. Cruz. 95: 179 Ð181.
Scheneider, S., D. Roessli, and L. Excoffier. 2000. Arlequin version 2000: a software for population genetic data anal-ysis. Genetics and Biometry Laboratory, University of Geneva, Geneva, Switzerland.
Schleissman, D. J., and L. B. Calheiros. 1974. A review of the status of yellow fever andAedes aegyptieradication pro-grams in the Americas. Mosq. News 34: 1Ð9.
Solignac, M., M. Monnerot, and J. C. Mounoloc. 1986.
Concerted evolution of sequence repeats inDrosophila
mitochondrial DNA. J. Mol. Evol. 24: 53Ð 60.
Tabachnick, W. J. 1991. The yellow fever mosquito: evolu-tionary genetics and arthropod-borne disease. Am. En-tomol. 37: 14 Ð24.
Tajima, F. 1989. Statistical method for testing the neutral mutation hypotesis by DNA polymorphism. Genetics 123: 585Ð595.
Tang, J., K. Pruess, E. W. Cupp, and T. R. Unnasch. 1996.
Molecular phylogeny and typing of blackßies (Diptera: Simuliidae) that serves as vectors of human or bovine onchocerciasis. Med. Vet. Entomol. 10: 228 Ð234.
Thompson, J. D., D. G. Higgins, and T. J. Gibson. 1994.
CLUSTAL W: improving the sensitivity of progressive multiple sequence alignment through sequence weight-ing, position-speciÞc gap penalties and weight matrix choice. Nucl. Acids Res. 11: 4673Ð 4680.
Volz-Lingenho¨hl, A., M. Solinac, and D. Sperlich. 1992. Sta-ble heteroplasmy for a large-scale deletion in the coding region of Drosophila subobscura mitochondrial DNA. Proc. Natl. Acad. Sci. U.S.A. 89: 11528 Ð11532.
Wilkinson, G. S., and A. M. Chapman. 1991. Length and sequence variation in evening bat D-loop mtDNA. Ge-netics 128: 607Ð 617.