RESEARCH ARTICLE
Technical Study of a Standalone
Photovoltaic
–
Wind Energy Based Hybrid
Power Supply Systems for Island
Electrification in Malaysia
Nahidul Hoque Samrat1, Norhafizan Ahmad1*, Imtiaz Ahmed Choudhury1, Zahari Taha2
1Centre for Product Design and Manufacturing (CPDM), Department of Mechanical Engineering, Faculty of Engineering, University of Malaya, 50603, Kuala Lumpur, Malaysia,2Innovative Manufacturing,
Mechatronics and Sports Laboratory (iMAMS), Faculty of Manufacturing Engineering, University Malaysia Pahang, 26600, Pekan, Pahang, Malaysia
*norhafizan@um.edu.my
Abstract
Energy is one of the most important factors in the socioeconomic development of a country. In a developing country like Malaysia, the development of islands is mostly related to the availability of electric power. Power generated by renewable energy sources has recently become one of the most promising solutions for the electrification of islands and remote rural areas. But high dependency on weather conditions and the unpredictable nature of these renewable energy sources are the main drawbacks. To overcome this weakness, dif-ferent green energy sources and power electronic converters need to be integrated with each other. This study presents a battery storage hybrid standalone photovoltaic-wind energy power supply system. In the proposed standalone hybrid system, a DC-DC buck-boost bidirectional converter controller is used to accumulates the surplus hybrid power in the battery bank and supplies this power to the load during the hybrid power shortage by maintaining the constant dc-link voltage. A three-phase voltage source inverter complex vector control scheme is used to control the load side voltage in terms of the voltage ampli-tude and frequency. Based on the simulation results obtained from MATLAB/Simulink, it has been found that the overall hybrid framework is capable of working under variable weather and load conditions.
Introduction
Energy was, is and will remain one of the fundamental economic development foundations of any nation. The majority of the island development problems all over Malaysia are mostly related to energy production. Most of the offshore islands in Malaysia use fossil fuels to gener-ate electricity even though Malaysia has a good mix of renewable energy sources such as solar, wind, wave, biomass and hydro. The energy produced by the traditional sources increase
OPEN ACCESS
Citation:Samrat NH, Ahmad N, Choudhury IA, Taha Z (2015) Technical Study of a Standalone Photovoltaic–Wind Energy Based Hybrid Power Supply Systems for Island Electrification in Malaysia. PLoS ONE 10(6): e0130678. doi:10.1371/journal. pone.0130678
Editor:Xiaosong Hu, University of California Berkeley, UNITED STATES
Received:February 4, 2015
Accepted:May 24, 2015
Published:June 29, 2015
Copyright:© 2015 Samrat et al. This is an open access article distributed under the terms of the Creative Commons Attribution License, which permits unrestricted use, distribution, and reproduction in any medium, provided the original author and source are credited.
Data Availability Statement:All relevant data are within the paper.
Funding:This research is supported by the KeTTHA, Ministry of Energy, Green Technology and Water (53-02-03-1102), Malaysia, and the University of Malaya High Impact Research (HIR) Grant (UM.C/ 625/1/HIR/MOHE/ENG/41) sponsored by the Ministry of Higher Education (MOHE).
greenhouse gas emissions, which may be the key source of global warming. Furthermore, the cost of fossil fuel increases significantly with remoteness. By 2020, it is expected that Malaysia will discharge 285.73 million tons of CO2. This means that CO2 emission will increase by 68.86% compared to the amount of CO2 emitted in 2000. Electric power generation alone con-tributes 43.40% of the total CO2 released by Malaysia, which is the largest among all sectors [1]. In the previous Kyoto protocol, the Malaysian government signed for a reduction in CO2. For this reason, the government is very concerned about the related environmental issue and wants to reduce the overall CO2 emission. Therefore, island electrification using renewable energy sources in Malaysia is an important way to meet the challenge.
Among them, Delfino et al. [15] presented a grid integrated wind turbine- fuel cell system. Khan et al. [16–17] described a small wind-fuel cell hybrid model and analyzed its life cycle. Onar et al. [18] investigated detailed dynamic modeling, design, control and simulations of wind/solar/fuel cell/ultra-capacitor hybrid system. A wind, PV and wave based large-scale hybrid system integration and grid connection has been reported in Lund [19]. Bhende et al. [20] presented a stand-alone wind- fuel cell based supply system. In De Battista et al. [21] power conditioning for a wind-hydrogen storage based system was analyzed and discussed. Besides these, some others works related with the renewable integration and related energy storage are briefly discussed in references [22–25]. In all the references [6–9,15–21],some authors discussed energy storage devices for a hybrid system, some discussed grid integration of a hybrid system, sizing and cost optimization. But they are silent about the PV-Wind energy based hybrid system design for island communities.
This study focuses on developing a complete dynamic simulation model to design, control and analyze the overall system performance of a feasible PV-wind hybrid renewable power generation system for residential use. This simulation model can be used not only for investi-gating the PV-Wind hybrid system performance, but also for sizing and designing the HRES to meet the system load demands under any available meteorological condition. Using a DBBC, a control algorithm is developed between the dc-link and battery bank to maintain the constant dc-link voltage, and a switch mode inverter with complex vector control scheme is placed at the load side end to control the load side voltage. In addition, a simple passive L-C filter is placed after the inverter at the load side end to eliminate the unwanted high frequency har-monics, which are generated by the VSI based on the inverter switching frequency. The pro-posed battery storage PV-Wind stand-alone hybrid system in this paper has been modeled, controlled and simulated using Matlab, Simulink and Simpower system software packages. In addition, results obtained from simulation are described to verify the effectiveness of the pro-posed HRES under variable meteorological conditions.
The sequential workflow hints of this paper are as follows: the complete mathematical modeling of PV-Wind HRES has been presented with the necessary equations shown in Sec-tion 2. In addiSec-tion, SecSec-tions 2 describes the dc-link voltage control algorithm and complex vec-tor control scheme for load side VSI. In Section 3, the Perhentian Islands is considered as a potential area for generating electric power from PV and wind energy sources based on the meteorological data. Section 4 presents all the necessary simulation results and discussions to check the feasibility of the HRES. Finally, in Section 5, a conclusion is drawn by combining all the key points of the study.
System Description
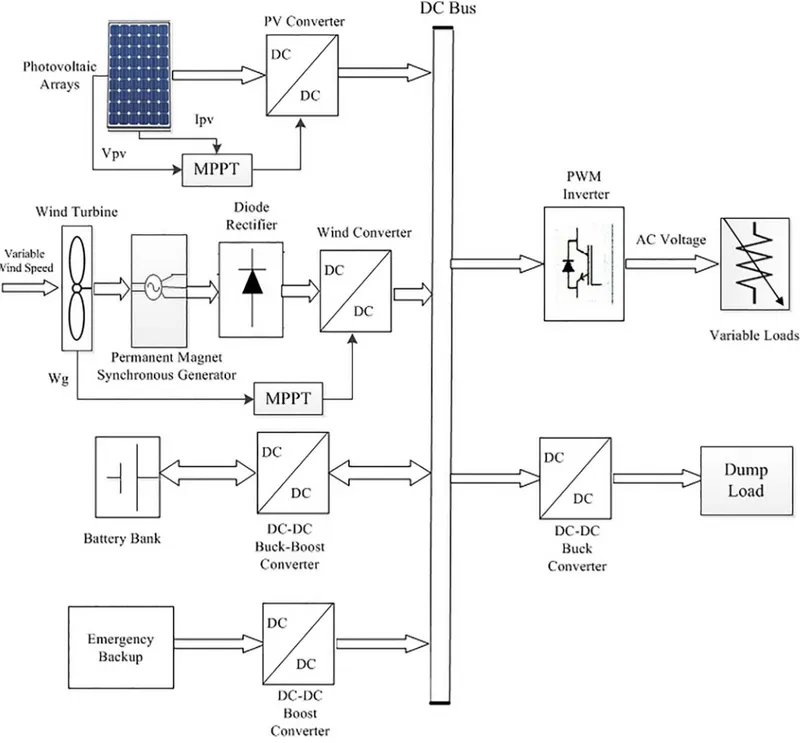
In this section, the detailed dynamic simulation model is briefly described for a PV-Wind hybrid renewable power generation system. The proposed hybrid system consists of a PV system, a wind energy system, a battery bank, a DBBC with proportional integral (PI) control duty cycle and a pulse width modulation (PWM) VSI located at the load side end. The solar PV system consists of a PV array and a DC-DC converter with a maximum power point tracking (MPPT) algorithm. The wind energy system is configured by a wind turbine with a permanent magnet synchronous generator (PMSG), a DC-DC converter with MPPT and an AC-DC three-phase uncontrolled rec-tifier.Fig 1shows the complete block diagram of the stand-alone PV-Wind HRES.
PV system modeling and characteristics
The solar PV system is a method of generating electrical energy by converting solar photon energy into direct current electricity using a solar cell or PV cell. The PV cell is the smallest
unit of the solar PV system and each PV cell produces around 0.5V. Cells are further connected in series or/and parallel combination to form a PV array. Different PV cell configurations can be used to illustrate the different V-I characteristic curves such as single diode model, two diode model, and Rs-Rp model. But due to the degree of accuracy and simplicity, the single diode model has been used in some previous works. For this reason, the PV cell single diode configuration has been selected for this study.Fig 2presents the widely used one-diode equiva-lent circuit model of PV cell [26]. PV model V-I characteristics can be expressed using some Fig 1. Block diagram of the proposed PV-Wind hybrid system.
nonlinear mathematical exponential equations. The ideal relationship between PV voltage and current can be expressed as follows [26–27]:
IPV¼Iph ID Ish¼Iph I0½exp
q ðVPVþIPVRsÞ AqKbT
1 VPVþIPVRs Rsh
ð1Þ
whereIPVis the output current of the PV cell (A),Iphthe photocurrent,IDthe diode current,
Ishthe current through the shunt resistance,I0the reverse saturation current, K the Boltzmann constant = 1.38×10⁻²³(J/K), q the charge of electron = 1.6×10⁻¹⁹(C), T the cell temperature (K),VPVthe output terminal voltage of the PV cell (V), A the quality factor (lies between 1.2– 1.6 for crystalline silicon),Rsthe series resistance (Ω) andRshthe shunt resistance (Ω).
The output power from the PV array is given by
PPV ¼VPVIPVZconv ð2Þ
whereηconvis the efficiency of the DC-DC converter (typically 90–95%). In this paper, for a 400W power generation, totalfive KOYCERA KC85T-87W PV model is used and all the mod-els are connected in series in combination with one another. The KOYCERA KC85T-87W PV model P-V and I-V characteristics are obtained according to the value of the variablesIph,I0,
RshandRs. The value of the variables can be obtained from [26]; they usually provide values for open circuitVPVandIPV, short circuit and maximum power point andfinally the number of PV cells. The I-V and P-V characteristics of a PV module operating at 25°C standard tempera-ture and different solar irradiance are shown in Figs3and4.
The maximum output power of the PV module varies according to load current or solar irradiation. Therefore, a proper control strategy is needed to use the PV model more efficiently as an electric power source by developing a MPPT. There are many different types of MPPT Fig 2. Equivalent circuit diagram of a single-diode PV model.
doi:10.1371/journal.pone.0130678.g002
algorithm discussed in [26–28].Due to the simplicity and the smaller number of measured vari-ables, the perturbation and observation technique (P&O) is the most widely used among them. In P&O algorithm, the last perturbation sign and the last increment sign in the power of the solar module are used to select what should be the next perturbation. A slight (ΔD = 0.01)
per-turbation is introduced in the system. If there is an increment in the power, then the perturba-tion is continued (D +ΔD) in that direction and if the power decreases, the perturbation
should be reverses (D−ΔD). The flow chart of the P&O MPPT algorithm is shown inFig 5
[22]. According to Hasan and Natarajan [26–27], Eqs (1) and Eqs (2); the PV model with MPPT is developed using MATLAB/Simulink, which is depicted inFig 6 (A), 6(B) and 6 (C).
Wind turbine modeling
Wind turbine extracts the kinetic energy from wind and then converts it into mechanical energy that is fed into the electrical generator through a shaft to generate electricity. The Fig 3. I-V characteristics of KOYCERA KC85T-87W PV model with varying irradiation.
mechanical power developed by a wind turbine [29–32] can be formulated as
Pm¼
1
2rAtCpðl;bÞ Vw
3
¼12rAtCp ð
omR
l Þ
3
ð3Þ
wherePmis the mechanical power (W),Cpis the power coefficient,λthe tip speed ratio, A is the wind turbine swept area (m2), Vwis the wind speed (ms−1),ρis the density of airkg/m3, ωmis the turbine rotor angular speed inrads−1and R the wind turbine rotor radius (m). The
output power is determined by the Cp of the wind turbine if the swept area and wind speed are assumed to be constant.
The relationship between the tip speed ratio and the angular rotor speed can be expressed as
l¼omR Vw
ð4Þ
Maximum power from the wind turbine can be extracted if the turbine operates at maxi-mum Cp (Cp-opt). Therefore, it is essential to keep the turbine rotor speed at the optimaxi-mum Fig 4. P-V characteristics of KOYCERA KC85T-87W PV model with varying irradiation.
doi:10.1371/journal.pone.0130678.g004
Fig 5. The flowchart of the P&O Algorithm.
Fig 6. The PV model Simulink diagram with MPPT.(A) Simulink model of PV. (B) MPPT model. (C) Complete Simulink model of PV with MPPT. doi:10.1371/journal.pone.0130678.g006
value of tip-speed ratio (λopt) with variation of wind speed. Using Eqs (3) and (4), the target
optimum power of the wind turbine can be expressed as [31–32]:
Pm¼
1
2rACp opt ð
om optR
lopt Þ
3
¼Kopt ðom optÞ
3
ð5Þ
Where
Kopt¼
1
2rACp optð
R
loptÞ
3
ð6Þ
om opt¼lopt
R Vw¼KwVw ð7Þ
Therefore, the optimum torque can be given by [29–32]
Tm opt¼Koptðom optÞ
2
ð8Þ
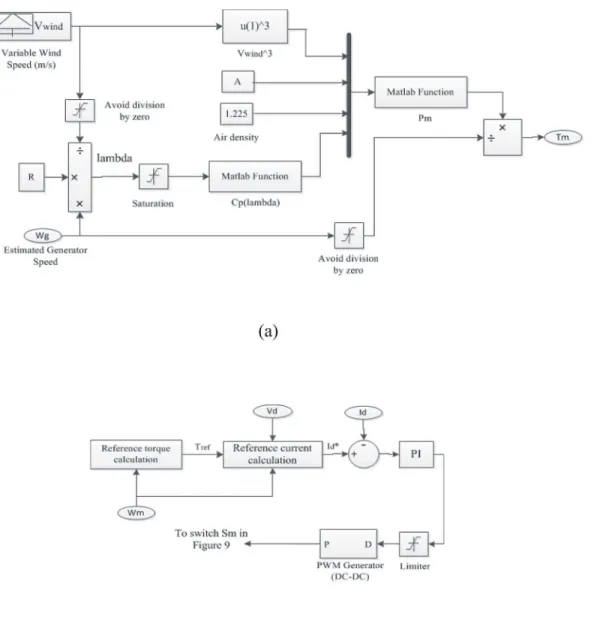
From the above equation and related literature [31–32], it can be observed that the maxi-mum power extraction from a wind turbine is a function of the turbine rotor speed at different wind speeds. In this paper, according to the Eqs (3)–(8) a maximum power extraction algo-rithm is developed [31–32]; a wind turbine model with MPPT is developed using MATLAB/ Simulink, which is illustrated inFig 7(A) and 7(B).
Modeling of battery
The electric utility system reliability and efficiency improved by the energy storage devices. Among the various energy storage devices, battery is the most common storage device used for the electrical energy storing. Recently there are many battery models are developed in refer-ences [33–36]. In this paper, a typical battery model [36] is implemented. This model uses only the state of charge (SOC) of the battery as a state variable to avoid the algebraic loop problem. In addition, the model developed [36] can precisely characterize four types of battery chemistry including lead-acid battery.
In this paper, the battery is modeled using a controlled series connected voltage source with a constant resistive value, shown inFig 8, where the controlled voltage source is expressed by the following equation [36]:
E¼E0 K
Q Q R
idtþAexpð B Z
idtÞ ð9Þ
VBattery¼E RinIBattery ð10Þ
where E0is the no load voltage of the battery (V), Q is the battery capacity (Ah), K is the
polari-zation voltage (V), A is the exponential zone amplitude (V), VBatteryis the battery voltage (V),
B is the exponential zone time constant inverse (Ah)-1, Rinis the internal battery resistance
(Ω),R
idt is the charge drawn and supplied by the battery (Ah) and IBatteryis the battery current
(A)
DC-link voltage control
The proposed stand-alone PV-wind hybrid power generation system circuit topology with dump load and emergency backup is depicted inFig 10. In this proposed system, a neutral wire is inserted between the dc-link capacitors which are connected before the VSI for feeding the single phase load as well as the three phase loads, shown inFig 10.
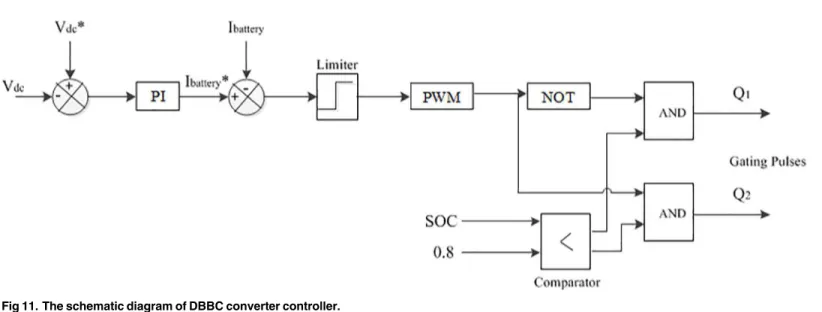
In this paper, the dc-link side is connected to a battery bank through DBBC; the main objec-tive of the DBBC control is to maintain a constant dc-link voltage as a reference value and dis-charge/charge current from/to the battery bank according to the required load power. The battery bank DBBC controller schematic diagram shown isFig 11. The battery bank voltage can be kept lower as compared to the dc-link reference voltage (Vdc) by using DBBC and so a
smaller number of battery are required to be connected in series. In the proposed system, the Fig 7. Wind turbine Simulink diagram with MPPT.(A) Wind turbine simulink model; (B) MPPT model.
doi:10.1371/journal.pone.0130678.g007
battery bank voltage is kept at around 300 V whereas Vdc= 650 V. In this study, the depth of
discharge of the battery bank is considered to be 60% [20].In addition, it is assumed that it should provide electric power to the 2.5 kW load for approximately an hour when the gener-ated hybrid power is zero. The detailed calculation of the battery bank rating is discussed inS1 Appendix.
InFig 10, the value of the switching frequency, inductor and capacitors used in DBBC is important for its conduction mode operation of it. The inductor used in the battery bank side to show the lower ripple current results, which increases the lifetime and efficiency of the bat-tery bank. Conduction mode operation of DBBC also depends on input and output current. Fig 8. Non-linear typical battery model [36].
The value of the inductor and capacitors are as follows [20]:
InductanceL2¼
VBattery ðVdclink VBatteryÞ
IBatteryfsVdclink
ð11Þ
Buck mode capacitanceC2¼
kLIBattery
8f
sVBatteryðrippleÞ
ð12Þ
and
Boost mode capacitanceC3¼
DBoostIdclink
fsVdclinkðrippleÞ
ð13Þ
where VBatteryis the voltage of the battery bank, Idclinkis the dc-link current, Vdclinkis the
dc-link voltage, D is the duty cycle. Vdclink(ripple)is the boost side output desired ripple voltage,
VBattery(ripple)is the buck side output desired ripple voltage, fsis the switching frequency, kLis
Fig 9. The battery model Simulink diagram.
doi:10.1371/journal.pone.0130678.g009
the estimated coefficient of indicator ripple current at buck side and IBatteryis the battery bank
current.
The battery bank in this paper can act either as a sink or as a power supply. As a result, due to the weather conditions, it should charge or discharge within specified limits when there is Fig 10. The proposed stand-alone PV-Wind hybrid system circuit topology with dump load and emergency backup.
doi:10.1371/journal.pone.0130678.g010
Fig 11. The schematic diagram of DBBC converter controller.
surplus or a lack of hybrid power. In this study, the surplus power due to the high solar and wind power condition at first supply power to the battery bank until it reaches its upper limit charge carrying capacity and after that the dump load absorbs the additional power. The dump load controlled via the chopper control is shown inFig 12. In this case, the controller switching decision is made by comparing the present status and upper limit of SOC.
The battery bank may not able to meet the system load demand at each instance in case of long term no or lower PV and/or wind power condition. For this reason, an emergency backup is integrated with the proposed hybrid system in this paper. The control algorithm of the emer-gency backup is shown inFig 13. A flow chart is depicted inFig 14based on the above control coordination among the different sources, battery, emergency backup and dump load, where the lower and upper limit SOC the of the battery bank is kept at 0.2 and 0.8, respectively [20]. Fig 12. The schematic diagram of dump load controller.
doi:10.1371/journal.pone.0130678.g012
Fig 13. The schematic diagram of emergency backup controller.
doi:10.1371/journal.pone.0130678.g013
Load side VSI control
A three phase space vector control VSI is used at the load end as an interface element between the dc-link voltage and the system load. It is used to control the voltage and frequency at the system load end. In this study, the system load voltages should be controlled in terms of voltage amplitude and frequency because there is no power grid connection. The space vector control method is used to control the system output voltage during the variation in required hybrid power or load power.
Based on the synchronously rotating frame described in [31–32], the space vector control technique is used in this proposed system. The three-phase Ia,, Ib, Iccurrents and Va, Vb, Vc
voltages should be measured and transformed from the stationary reference a-b-c frame to the rotating reference d-q frame using the preferred output load voltage frequency. In this paper, the specified output phase voltage root-mean-square (RMS) value and the frequency are 220 V and 50 HZ, respectively.
The equations of voltage using reference rotating d-q frame transformation are taken from the [32]:
vd ¼vdi Lf did
dt þLfoiq ð14Þ
vq¼vqi Lf diq
dt Lfoid ð15Þ
Fig 14. Dc-link voltage control algorithm.
By using the d-q reference rotating frame transformation, the active and reactive power is given by:
Active powerP¼32ðvdidþvqiqÞ ð16Þ
Reactive PowerQ¼32ðvdiqþvqidÞ ð17Þ
The active and reactive power equations will be as follows if the reference rotating frame is as vq= 0 and vd=jVj:
P¼32vdid ¼
3
2jVjid ð18Þ
Q¼32vdiq¼
3
2jVjiq ð19Þ
Therefore, the active and reactive power can be controlled by controlling direct and quad-reature current elements, respectively. And for the resistive load case Vdcan be expressed as:
Vd¼ ffiffiffi
2
p
VRMS ð20Þ
where VRMSis the RMS reference value of the output phase voltage. In this control technique,
internal control loops output current and external control loops output voltage are regulated by PI controllers. In this paper, the Ziegler-Nichols tuning method is used for regulating all the PI controllers [37]. The control technique of the load side VSI is depicted inFig 15.
Based on the switching frequency of the inverter, the unwanted high frequency harmonics will generate in output ac voltage by the VSI, which ultimately creates power quality problem in the consumer end. Space vector PWM (SV-PWM) technique is used in this controller, because it of slightly reduces the harmonics contents in the output voltage. And also, it increase the fundamental output voltage. To reduce the unwanted high frequency harmonics for avoid-ing the power quality problem in the customer end, a simple passive L-C filter is used in the load side end. The passive L-C filter design [38] is given inS2 Appendixand the values are:
Lf ¼0:052H Cf ¼2mF
Site Selection
Malaysia is surrounded by sea and its latitude and longitude is 20−300N and 1120–300E.It has a
total of 878 islands[39–40]. In Malaysia, Perhentian Island (shown inFig 16) is one of the most popular islands resort. It is approximately 20 km off the northeastern coast of West Malaysia in the state of Terengganu. It is a resort island and there is only one village inhabited by the locals. Diesel generators are the main source of electric power. On this island, the National Energy Policies (NEP) and University Kebangsaan Malaysia (UKM) installed a solar-wind hybrid energy system in 2007 [10]. It was not connected to the electrical network because of its weak hybrid power management strategy during periods of lower wind and solar irradiation conditions.
Geographically, Perhentian Island or PulauPerhentian is a hot and humid island with rain all year round. It is a sunny island the equatorial belt. However, a completely clear or cloudless
sky is rare on this tropical island. On average, Perhentian Island receives daily 5.5 hours of sun-shine daily. The solar data for this island is shown inFig 17below.
With reference toFig 16above, it is clear that solar energy alone cannot meet the customer load demand in every instance because of the limited hours of sunshine. In order to install HRES on this island, wind energy can be considered as it is one of the efficient renewable power generation sources. The wind data for the Perhentain Island is illustrated inFig 18. Solar and wind data are obtained from references [10] and [42], respectively.
Simulation Results and Discussion
The simulation model of the proposed standalone solar plus wind energy hybrid system with energy storage has been modelled using a Matlab/Simulink environment under different weather and load conditions. In this study, PMSG is modelled in Matlab/Simulink based on the literature described in [43–44]. The parameters of the PMSG, PV array and wind turbine are taken from the [45], [3,27] and [46] respectively and are also mentioned inS3 Appendix. In this section, the average solar irradiation for January, February and March; and the average Fig 15. The three-phase load side VSI controller.
wind speed for January, April, May and June from the section 3 is used to test the performance of the proposed hybrid system under the following conditions.
Figs19,20and21show the proposed hybrid system power distribution curves under the various conditions: variation in hybrid power with fixed load, variation in load with fixed hybrid power and variation in hybrid power with variable load conditions. From Figs19,20 and21, it is seen that the performance of the DBBC controller is quite satisfactory because the power from the battery bank changes (charges/discharges) in order to maintain system power stability under varying solar, wind and load conditions. So it is evident clear that the DBBC controller is able to discharge the battery bank into the load when the load power is more than the generated hybrid power and also the controller is able to charge the battery bank when the load power is less than the generated hybrid power.
Furthermore, it can also maintained the constant dc-link voltage at 650 V during the change in hybrid and load power, as shown in Figs22,23and24. The dc-link voltage shown in Figs 22,23and24are approximately constant but there some insignificant deviation appeared because of the appreciable delay between hybrid and load power changes In Figs19–21, absence of solar power after 12-second indicate that cloudy and night period. Also in this case, wind and battery bank power satisfactorily meets the system load demand. Therefore, it can be established that the controller performance is quite acceptable in steady state as well as tran-sient hybrid and load power condition.
The output line current response of the mentioned above three conditions during the long time simulation is shown in Figs25,26and27.Fig 25(A), 25(B) and 25(C)shows the output line current without variation because load is fixed in this case. The output line current varying in Figs26and27because load is varying in this case.Fig 26(B) and 26(C)shows the output line current when the load power increase at simulation time 3.96 s to 4.06 s and when the load power decrease at simulation time 11.97 s to 12.07 s, respectively. Similar phenomenon occurred inFig 27(A), 27(B) and 27(C). For above three conditions, output line voltage for whole simulation time has shown in Figs28,29and30, respectively. From Figs28,29and30, it is seen that VSI controller shows satisfactory performance because it maintain voltage Fig 16. Target site (Perhentian Island) location [41].
doi:10.1371/journal.pone.0130678.g016
stability in load side during the solar, wind and load power variation. The total harmonics dis-tortion in the output voltage and current at load side is about 1.7% and 1.55%, respectively, which illustrates the good quality of voltage and current generated at the load side end.
Based on above simulation results, it can conclude that proposed hybrid system can be able to deliver a suitable quality of voltage and current to the load with the help of inverter switching and a passive L-C filter. Finally, it established that the proposed hybrid system can successfully accommodate solar irradiation, wind speed and load changes, and the power management algorithm can efficiently track the hybrid power and load changes.
Conclusion
A novel hybrid PV-wind renewable power generation system with appropriate power manage-ment algorithm has been designed and modeled in this paper for standalone island uses in the Fig 17. Average monthly solar irradiation of Perhentian Island.
absence of electric power grid. The power available from green energy sources is highly depen-dent on weather conditions such as solar irradiations and wind speed. In this paper, a PV sys-tem integrated with a wind turbine and battery bank using a novel topology to overcome this Fig 18. Average monthly wind data for Perhentian Island (2003).
doi:10.1371/journal.pone.0130678.g018
Fig 19. Powers distribution curve of the PV-wind hybrid system during the variation in hybrid power with fixed load.
deficiency. This standalone hybrid topology shows excellent performance under varying load power requirement, solar irradiation and wind speeds where solar irradiation and wind speed Fig 20. Powers distribution curve of the PV-wind hybrid system during the variation in load with fixed hybrid power.
doi:10.1371/journal.pone.0130678.g020
data are based on real world records. Based on the simulation results and analysis, it could be concluded that the proposed hybrid system can be satisfactorily used in the Pehentian Islands. Fig 21. Powers distribution curve of the PV-wind hybrid system during the variation in hybrid power with variable load.
Future work should aim at setting up the proposed hybrid standalone PV-wind system in the University of Malaya laboratory to verify the simulation results.
Fig 22. Dc-link voltage of the PV-wind hybrid system during the variation in hybrid power with fixed load.
doi:10.1371/journal.pone.0130678.g022
Fig 23. Dc-link voltage of the PV-wind hybrid system during the variation in load with fixed hybrid power.
doi:10.1371/journal.pone.0130678.g023
Fig 24. Dc-link voltage of the PV-wind hybrid system during the variation in hybrid power with variable load.
Fig 25. Output line current response with fixed load power.(A) Output line currents throughout the full simulation time. (B) Output line current when the hybrid power decreases at simulation time 3.95 s to 4.05 s. (C) Output line current when the hybrid power increases at simulation time 7.96 s to 8.06 s.
doi:10.1371/journal.pone.0130678.g025
Fig 27. Output line current response with change in required load power.(A) Output line currents throughout the full simulation time. (B) Output line current when the load increases at simulation time 7.95 s to 8.05 s. (C) Output line current when the load decreases at simulation time 11.96 s to 12.06 s.
doi:10.1371/journal.pone.0130678.g027
Fig 29. Output line voltage response with change in required load power.(A) Output line voltage throughout the full simulation time. (B) Output line voltage when the load increases at simulation time 3.96 s to 4.06 s;. (C) Output line voltage when the load decreases at simulation time 11.97 s to 12.07 s.
Supporting Information
S1 Appendix. (DOCX) S2 Appendix. (DOCX) S3 Appendix. (DOCX)Author Contributions
Conceived and designed the experiments: NHS NA IAC ZT. Performed the experiments: NHS NA. Analyzed the data: NHS NA IAC ZT. Wrote the paper: NHS NA.
References
1. Samrat NH, Ahmad NB, Choudhury IA, Taha ZB, Prospect of Wave Energy in Malaysia, in Proceedings of the IEEE 8th International Power Engineering and Optimization Conference, 2014.
2. Clifton J, Boruff BJ. (2010). Assessing the potential for concentrated solar power development in rural Australia. Energy Policy, 38(9), 5272–5280.
3. Ong HC, Mahlia TMI, Masjuki HH. (2011). A review on energy scenario and sustainable energy in Malaysia. Renewable and Sustainable Energy Reviews, 15(1), 639–647.
4. Shafie SM, Mahlia TMI, Masjuki HH, Andriyana A. (2011). Current energy usage and sustainable energy in Malaysia: a review. Renewable and Sustainable Energy Reviews, 15(9), 4370–4377.
5. Almaktar M, Rahman HA, Hassan MY, Omar WZW. (2013). Photovoltaic technology in Malaysia: past, present, and future plan. International Journal of Sustainable Energy, (ahead-of-print), 1–13.
6. Cetin E, Yilanci A, Ozturk HK, Colak M, Kasikci I, Iplikci S. (2010). A micro-DC power distribution sys-tem for a residential application energized by photovoltaic–wind/fuel cell hybrid energy systems. Energy and Buildings, 42(8), 1344–1352.
7. Valenciaga F, Puleston PF. (2005). Supervisor control for a stand-alone hybrid generation system using wind and photovoltaic energy. Energy Conversion, IEEE Transactions on, 20(2), 398–405.
8. Onar OC, Uzunoglu M, Alam MS. (2006). Dynamic modeling, design and simulation of a wind/fuel cell/ ultra-capacitor-based hybrid power generation system. Journal of Power Sources, 161(1), 707–722.
9. Uzunoglu M, Onar OC, Alam MS. (2009). Modeling, control and simulation of a PV/FC/UC based hybrid power generation system for stand-alone applications. Renewable Energy, 34(3), 509–520.
10. Darus ZM, Hashim NA, Manan SNA, Rahman MAA, Maulud KNA, Karim OA. (2008, October). Potential of wind energy in sustainable development of resort island in Malaysia: a case study of PulauPerhen-tian (PerhenPulauPerhen-tian island). In Proceedings of the 10th WSEAS international conference on Mathematical methods, computational techniques and intelligent systems (pp. 431–435). World Scientific and Engi-neering Academy and Society (WSEAS).
11. Ding F, Li P, Huang B, Gao F, Ding C, Wang C. (2010, September). Modeling and simulation of grid-connected hybrid photovoltaic/battery distributed generation system. In Electricity Distribution (CICED), 2010 China International Conference on (pp. 1–10). IEEE.
12. Rao Z, Wang S. (2011). A review of power battery thermal energy management. Renewable and Sus-tainable Energy Reviews, 15(9), 4554–4571.
13. Hu X, Li SE, Jia Z, Egardt B. (2014). Enhanced sample entropy-based health management of Li-ion bat-tery for electrified vehicles. Energy, 64, 953–960.
14. Hu X, Sun F, Zou Y. (2013). Comparison between two model-based algorithms for Li-ion battery SOC estimation in electric vehicles. Simulation Modelling Practice and Theory, 34, 1–11.
15. Delfino B, Fornari F. (2003, June). Modeling and control of an integrated fuel cell-wind turbine system. In Power Tech Conference Proceedings, 2003 IEEE Bologna (Vol. 2, pp. 6-pp). IEEE.
16. Khan MJ, Iqbal MT. (2005). Dynamic modeling and simulation of a small wind–fuel cell hybrid energy system. Renewable Energy, 30(3), 421–439.
17. Khan FI, Hawboldt K, Iqbal MT. (2005). Life cycle analysis of wind–fuel cell integrated system. Renew-able energy, 30(2), 157–177.
18. Onar OC, Uzunoglu M, Alam MS. (2008). Modeling, control and simulation of an autonomous wind tur-bine/photovoltaic/fuel cell/ultra-capacitor hybrid power system. Journal of Power Sources, 185(2), 1273–1283.
19. Lund H. Large-scale integration of optimal combinations of PV, wind and wave power into the electricity supply.Renewable Energy, 31 (4) (2006), pp. 503–515.
20. Bhende CN, Mishra S, Malla SG. (2011). Permanent magnet synchronous generator-based standalone wind energy supply system. Sustainable Energy, IEEE Transactions on, 2(4), 361–373.
21. De Battista H, Mantz RJ, Garelli F, Power conditioning for a wind-hydrogen energy system J. Power Sources, 155 (2) (2006), pp. 478–486.
22. Hu X, Murgovski N, Johannesson LM, Egardt B. (2014). Comparison of three electrochemical energy buffers applied to a hybrid bus powertrain with simultaneous optimal sizing and energy management. Intelligent Transportation Systems, IEEE Transactions on, 15(3), 1193–1205.
23. Hu X, Li S, Peng H, Sun F. (2013). Charging time and loss optimization for LiNMC and LiFePO 4 batter-ies based on equivalent circuit models. Journal of Power Sources, 239, 449–457.
24. Zhang L, Wang Z, Hu X, Sun F, Dorrell DG. (2015). A comparative study of equivalent circuit models of ultracapacitors for electric vehicles. Journal of Power Sources, 274, 899–906.
25. Zhang L, Wang Z, Sun F, Dorrell DG. (2014). Online Parameter Identification of Ultracapacitor Models Using the Extended Kalman Filter. Energies, 7(5), 3204–3217.
26. Mahamudul H, MekhilefSaad, Henk MI,“Photovoltaic System Modeling with Fuzzy Logic Based Maxi-mum Power Point Tracking Algorithm,”International Journal of Photoenergy, vol. 2013, Article ID 762946, 10 pages, 2013. doi:10.1155/2013/762946
27. Pandiarajan N, Ramaprabha R, Muthu R,“Application of Circuit Model for Photovoltaic Energy Conver-sion System,”International Journal of Photoenergy, vol. 2012, Article ID 410401, 14 pages, 2012. doi: 10.1155/2012/410401
28. Salas V, Olias E, Barrado A, Lazaro A. (2006). Review of the maximum power point tracking algorithms for stand-alone photovoltaic systems. Solar Energy Materials and Solar Cells, 90(11), 1555–1578.
29. Bhave AG. (1999). Hybrid solar–wind domestic power generating system—a case study. Renewable energy, 17(3), 355–358.
30. Muljadi E, Drouilhet S, Holz R, Gevorgian V. (1996, October). Analysis of permanent magnet generator for wind power battery charging. In Industry Applications Conference, 1996. Thirty-First IAS Annual Meeting, IAS'96., Conference Record of the 1996 IEEE (Vol. 1, pp. 541–548). IEEE.
31. Haque ME, Negnevitsky M, Muttaqi KM. (2008, October). A novel control strategy for a variable speed wind turbine with a permanent magnet synchronous generator. In Industry Applications Society Annual Meeting, 2008. IAS'08. IEEE (pp. 1–8). IEEE.
32. Haque ME, Muttaqi KM, Negnevitsky M.“Control of a standalone variable speed wind turbine with a permanent magnet synchronous generator,”in the Proceedings of the IEEE Power and Energy Society General Meeting—Conversion and Delivery of Electrical Energy in the 21st Century, 2008.
33. Hu X, Xiong R, Egardt B. (2014). Model-based dynamic power assessment of lithium-ion batteries con-sidering different operating conditions. Industrial Informatics, IEEE Transactions on, 10(3), 1948–
1959.
34. Hu X, Li S, Peng H. (2012). A comparative study of equivalent circuit models for Li-ion batteries. Journal of Power Sources, 198, 359–367.
35. Li S, Ke B. (2011, July). Study of battery modeling using mathematical and circuit oriented approaches. In Power and Energy Society General Meeting, 2011 IEEE (pp. 1–8). IEEE.
36. Tremblay O, Dessaint LA, Dekkiche AI. (2007, September). A generic battery model for the dynamic simulation of hybrid electric vehicles. In Vehicle Power and Propulsion Conference, 2007. VPPC 2007. IEEE (pp. 284–289). IEEE.
37. Astrom KJ. (1995). PID controllers: theory, design and tuning. Instrument Society of America.
38. Dahono PA, Purwadi A. (1995, February). An LC filter design method for single-phase PWM inverters. In Power Electronics and Drive Systems, 1995., Proceedings of 1995 International Conference on (pp. 571–576). IEEE.
39. Geography of Malaysia, 2013 [Online]. Available:http://en.wikipedia.org/wiki/Geography_of_Malaysia.
40. List of islands of Malaysia, 2013 [Online]. Available:http://en.wikipedia.org/wiki/List_of_islands_of_ Malaysia.
42. Aghaei M, Thayoob M, Hanum Y, Imamzai M, Piyous P, Amin N. (2013, June). Design of a cost-efficient solar energy based electrical power generation system for a remote Island-PulauPerhentianBesar in Malaysia. In Power Engineering and Optimization Conference (PEOCO), 2013 IEEE 7th International (pp. 203–208). IEEE.
43. Grenier D, Dessaint L-A, Akhrif O, Bonnassieux Y, LePioufle B,“Experimental nonlinear torque control of a permanent magnet synchronous motor using saliency,”IEEE Transaction on Industrial Electronics, vol. 44, no. 5, pp. 680–687, 1997.
44. Krause PC, Wasynczuk O, Sudhoff SD, Analysis of Electrical Machinery and Drive System. Piscat-away, NJ: IEEE Press, 2002.
45. Barote L, Weissbach R, Teodorescu R, Marinescu C, Cirstea M. (2008, May). Stand-alone wind system with vanadium redox battery energy storage. In Optimization of Electrical and Electronic Equipment, 2008. OPTIM 2008. 11th International Conference on (pp. 407–412). IEEE.
46. 3kW Wind Turbine, 2014 [Online]. Available:http://www.exmork.com/3kw-wind-turbine.htm


![Fig 8. Non-linear typical battery model [36].](https://thumb-eu.123doks.com/thumbv2/123dok_br/16293746.185567/12.918.59.795.120.746/fig-non-linear-typical-battery-model.webp)