TECHNICAL ANALYSIS OF PHOTOVOLTAIC/WIND SYSTEMS
WITH HYDROGEN STORAGE
by
Vukman V. BAKIĆ *, Milada L. PEZO, Marina P. JOVANOVIĆ, Valentina M. TURANJANIN, Biljana S. VUČIĆEVIĆ, and Nikola S. MIRKOV
Laboratory for Thermal Engineering and Energy, Vin~a Institute of Nuclear Sciences, University of Belgrade, Belgrade, Serbia
Original scientific paper DOI: 10.2298/TSCI120306132B
The technical analysis of a hybrid wind-photovoltaic energy system with hydro-gen gas storage was studied. The market for the distributed power hydro-generation based on renewable energy is increasing, particularly for the standalone mini-grid applications. The main design components of photovoltaic/wind hybrid sys-tem are the photovoltaic panels, the wind turbine and an alkaline electrolyzer with tank. The technical analysis is based on the transient system simulation pro-gram TRNSYS 16. The study is realized using the meteorological data for a Typi-cal MetrologiTypi-cal Year for region of Novi Sad, Belgrade cities, and Kopaonik na-tional park in Serbia. The purpose of the study is to design a realistic energy sys-tem that maximizes the use of renewable energy and minimizes the use of fossil fuels. The reduction in the CO2 emissions is also analyzed in the paper.
Key words: photovoltaic/wind hybrid system, hydrogen storage, dynamical simulation
Introduction
Nowadays, energy systems show forms of unsustainable development due to increased use of fossil fuels, growing demand of energy, and increasing emissions of pollutions in the atmosphere. Also, the prices of energy are higher in recent years. In order to preserve the balance of ecosystems and encourage economic development, mitigation and changes of these unsuitable trends that affect to the sustainability of the energy system becomes a real challenge. Energy efficiency and energy saving, increasing usage of renewable energy sources should become an imperative in all sectors of energy production and consumption. Scenarios with a significantly increased of energy efficiency have become part of every vision of world energy development. Modern energy systems have to adapt to new requirements that regard to fulfill the demands of energy need, environmental protection, and assessment of the reliability and sufficiency of energy resources as well as the impact of the economic effects on the population.
These problems can be effectively solved using by renewable energy sources, especially solar, and wind energy. The application of wind and solar energy to generate
electrical power has certain advantages: it is free and available, does not pollute the environment (reducing emissions of greenhouse gases), belongs to renewable energy sources and contributes to sustainable development as well as greater balance in energy supply.
Hybrid power systems consist of two or more sources, controllers and equipment for the storage of energy, used together to provide increased system efficiency. Using the hybrid power system the overall efficiency, the reliability and improve the quality and availability is significantly increased when compared with individual systems. Also, these systems produce lower emissions that traditional fossil-fuelled technologies. Benefit of hybrid power systems is maximizing the use of renewable at the lowest acceptable cost. These systems can be used in commercial power parks, industrial plants, renewable energy integrated buildings, remote (off-grid) power sites, and etc. They can also provide electricity grid support and stabilization. Hybrid power system which include solar thermal with solar photovoltaic (PV) may provide overall energy requirements for a home and office buildings. For example, a hybrid energy system might include a solar electric array with wind turbine and often greater economic and environmental returns than wind and solar stand alone system by themselves.
This paper analyzes hybrid power system (solar, wind, and hydrogen storage) for generating electricity for households based on a dynamical simulation. The analysis was performed using the simulation tool TRNSYS. It is energy systems simulation program for transition process with a modular structure. This program has a library with models of components that are usually contained in renewable energy systems.
[8] develop a simulation tool for evaluating energy and economic performance of renewable energy islands, including various electricity generation technologies (PV modules, wind turbines, and micro-hydroelectric plants), integrated with a hydrogen storage system, comprising an electrolyzer, a hydrogen storage tank, and a fuel cell. It is based on a hybrid genetic-simulated annealing algorithm and aims to minimize the unit cost of electricity. Ekren et al. [9] perform simulated annealing (SA) algorithm for optimizing size of a PV/wind integrated hybrid energy system with battery storage. The proposed methodology is a heuristic approach which uses a stochastic gradient search for the global optimization.
Material and methods
The most comprehensive estimations of the wind and solar potential in Serbia as well as in whole region of the Western Balkans are presented in paper [10]. For further analysis, the data obtained from a nearby meteorological station is used for more precise estimation of the local potential of both solar and wind energy.
Solar and wind energy resources in the regions of Novi Sad city, Belgrade city, and Kopaonik national park
Solar energy
The critical data required during planning and design of a solar energy conversion (transformation) system is the amount of solar energy available on the surface area. From the practical point of view, instead of the instantaneous values, we are interested in the total amount of solar energy that reaches a specific unit surface area (irradiation, radiation energy) in a certain time interval (hour, day, month, and year). This amount of energy depends on geographic latitude, season, orientation, surface inclination, and meteorological conditions. Since solar radiation is subject to numerous influences, the radiation energy estimations based only on theoretical empirical equations are not sufficient. These influences have to be determined by analyzing the data obtained from the long-term measurements.
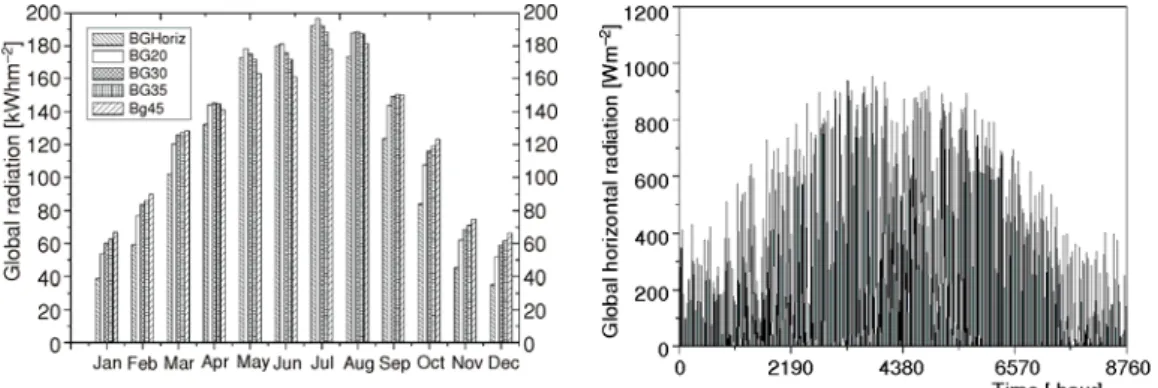
The position of a surface exposed to the sunrays is important for the application of solar energy. A more precise assessment of theavailable solar energy in Novi Sad, Belgrade, and Kopaonik and the possibility of its utilization are obtained by using the software package Meteonorm. This software uses data on hourly measurements of weather conditions in given meteorological stations to calculate all the required data for further analysis, as well as the influence of inclination and orientation change of a given surface. The variation of the received solar energy of global radiation throughout a year for surfaces with inclination 0o-45o in Belgrade is shown on fig.1.
consistent with the long-term averages for the location in question. The results of the intensity variation of global solar radiation are available also for Novi Sad and Kopaonik regions.
Computer software TRNSYS version 16 was used for the project. TRNSYS has several models for estimation of solar energy on sloped surfaces. The 5-parameter model was selected for this analysis [11, 12]. An optimal total annual solar radiation is usually at an orientation due south and at a tilt from horizontal approximately equal to the latitude of the site minus 20o. Thus, taking into consideration that Belgrade city, Novi Sad city, and national park Kopaonik have a different latitudes. We accepted the same slope of PV module of 20o degrees for all three regions. During the summer months (May, June, July) the optimal angle of the slope of the surface is above 20o, fig. 1, and since these months are most important for the considered system, the dynamical simulation for PV panels was done for this angle. The solar energy available on the sloped surface was used for estimating the amount of electrical energy that can be generated using a PV module.
There is a large selection of PV panels from different ma-nufacturers at the market. In this paper, PV module BP SX3200 (200W) was selected. This PV module is a 50-cell module designed specifically for small and large PV systems and it provides cost-effective power for DC loads or, with an inverter, for AC loads. The electrical characteristics of this PV module are shown in tab. 1. The estimated monthly generated electrical energy from the one BP SX3200 PV module (total area of 1.406 m2) in Novi Sad, Belgrade, and Kopaonik is given in tab. 2.
Figure 1. The intensity variation of global radiation during a TMY for various surface inclinations in Belgrade city
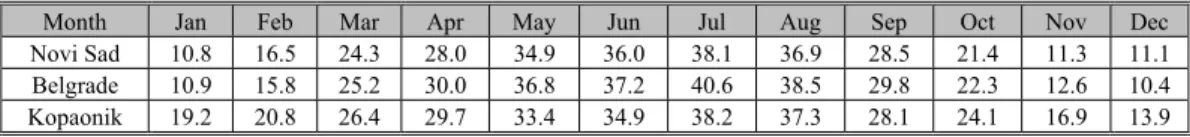
Figure 2. The hourly intensity variation of solar radiation for slope of tilted surface of 20 degrees for TMY in Belgrade city
Table 1. Specifications of the computational domain
Electrical characteristics SX3200 Maximum (nominal) power, Pmax [W] 200
Voltage at, Pmax [V] 24.5
Current at, Pmax [A] 8.16
Short-circuit current, Isc [A] 8.7
Open-circuit voltage, Voc [V] 30.8
Temperature coefficient of, Isc [%· oC–1] (0.065 ± 0.015)
Temperature coefficient of, Voc [mV· oC–1] –(111 ± 10)
Temperature coefficient of power, [%· oC–1] – (0.5 ± 0.05)
Nominal operating cell temperature, NOCT, [oC] 47 ± 2
Nominal voltage, [V] 16
Table 2. Electrical energy output (in kWhe) of the BP SX3200 PV module
Month Jan Feb Mar Apr May Jun Jul Aug Sep Oct Nov Dec Novi Sad 10.8 16.5 24.3 28.0 34.9 36.0 38.1 36.9 28.5 21.4 11.3 11.1 Belgrade 10.9 15.8 25.2 30.0 36.8 37.2 40.6 38.5 29.8 22.3 12.6 10.4 Kopaonik 19.2 20.8 26.4 29.7 33.4 34.9 38.2 37.3 28.1 24.1 16.9 13.9
Wind energy
The modeling of vertical wind shear (the change in wind velocity per change in height above the ground) is based on boundary layer theory applied to the atmosphere. Based on the theoretical eq. (1) the average wind velocities obtained for different months in Novi Sad, Belgrade, and Kopaonik national park at different heights are shown in tabs. 3, 4, and 5, respectively.
α ⎟⎟ ⎠ ⎞ ⎜⎜ ⎝ ⎛ =
2 1
2 1
z z U U
(1)
Table 3. The average wind velocities [ms–1], in Novi Sad at different heights
Jan Feb Mar Apr May Jun Jul Aug Sep Oct Nov Dec 10 m 2.79 2.89 3.40 3.19 2.59 2.40 2.31 2.10 2.42 2.59 2.80 2.60 15 m 3.00 3.11 3.65 3.43 2.79 2.58 2.49 2.26 2.60 2.79 3.02 2.80 20 m 3.16 3.28 3.85 3.61 2.94 2.72 2.62 2.38 2.74 2.94 3.18 2.95
Table 4. The average wind velocities [ms–1], in Belgrade at different heights
Jan Feb Mar Apr May Jun Jul Aug Sep Oct Nov Dec
10 m 3.20 3.44 3.96 3.78 3.02 2.93 2.55 2.48 2.85 3.06 3.14 3.15
15 m 3.45 3.70 4.26 4.06 3.24 3.15 2.75 2.67 3.06 3.30 3.37 3.39
20 m 3.63 3.89 4.48 4.28 3.42 3.32 2.89 2.81 3.22 3.47 3.55 3.57
Table 5. The average wind velocities [ms–1], in Kopaonik at different heights
Jan Feb Mar Apr May Jun Jul Aug Sep Oct Nov Dec
10 m 4.00 4.10 4.39 4.60 4.00 3.49 3.59 3.20 3.70 3.80 4.20 4.00
15 m 4.30 4.42 4.72 4.95 4.30 3.75 3.86 3.44 3.98 4.09 4.52 4.30
20 m 4.53 4.65 4.98 5.21 4.53 3.95 4.06 3.62 4.19 4.31 4.76 4.53
The wind data sets are given for three different metrological stations and they are based on data obtained from a database of meteorological conditions in certain locations of Serbia. It can be assumed that the theoretical model is sufficiently accurate and that there is no significant differences between theoretical and experimental models.
Under ideal boundary layer conditions, the value of α is approximately 0.14. However, under the actual conditions the value of α is signifi-cantly higher than 0.14 and depends on a variety of factors. In this work the average wind
intensity variation of wind velocity in Belgrade for TMY is shown in fig. 3. Similar results can be presented for Novi Sad and Kopaonik.
The value of a cut in wind velocity below which useful electrical power output of wind energy conversion system (WECS) are considered less economic is approx-imately 3.1 m/s [13]. The power curves for different wind turbines are shown in fig. 4. These curves are obtained from manufac-tures of wind turbines and present the amount of power that can be achieved for different wind velocities. According to the manufacturers recommendations, the wind turbines tower has to be higher than 18 m [14]. In tab. 6 are shown the obtained electrical energy from various wind turbines at hub height of 20 m for TMY in Belgrade city.
Model of dynamical simulation
The illustration of a hybrid PV/wind energy system with hydrogen storage for production of electrical energy is shown in fig. 5. All the components of the combined system are modeled with appropriate mathematical models expressed by differential and algebraic equations. The results of the simultaneous solution of these equations are the hourly change of all physical properties that characterize the hybrid energy system. The Type 94, 5-parameter model for PV arrays, Type 90 model of wind energy conversion system for the wind turbine and Type 160 a mathematical model for a high pressure alkaline water electrolyzer [11] were selected for this analysis.
Figure 5. An illustration of a hybrid PV/wind systems with hydrogen storage used for production of electrical energy
Figure 4. Power curves for different wind turbines
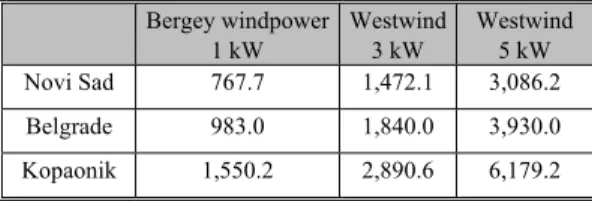
Table 6. Electrical energy output (in kWhe) from
various wind turbines (hub height = 20 m)
Bergey windpower 1 kW
Westwind 3 kW
Westwind 5 kW Novi Sad 767.7 1,472.1 3,086.2
Belgrade 983.0 1,840.0 3,930.0
Results of dynamical simulation
The dynamical simulations of a PV/wind energy system having 20 PV modules (about 28 m2) and for 1 kW, 3 kW, and 5 kW wind turbines have been done. Figure 6 shows the load (demand) pattern for a typical day and a typical household for all three locations. This is obtained based on average values of electricity consumption, which was measured hourly every day. It is assumed that this load pattern remains the same throughout the year and that no additional loads as parasitic loads are present in the system. Based on fig. 6 it can be calculated that the total electrical consumption for the assumed household is thus about 10,512 kWhe annually.
The power output throughout the year separately for the PV arrays and 5 kW wind turbine for Belgrade city is shown in fig. 7 and fig. 8. Similar results can be obtained for Novi Sad and Kopaonik. The dynamical simulation of the PV/wind energy system for 20 PV modules (each module with nominal power of 200 W) has been done.
Figure 6. The daily load profile Figure 7. Power output of the PV arrays
From fig. 7 it may be seen that at some instances the electrical power output is greater than 4 kW (nominal power of all PV modules). There are several reasons for this. The manufacturers of PV panels typically provide electrical parameters at only one operating condition. PV panels operate over a large range of conditions so the manufacturer's information is not sufficient to determine their overall performance. Also, the manufacturers typically provide only limited operational data for PV panels, such as the open circuit voltage (Voc), the
short circuit current (Isc), the maximum power current (Imp) and voltage (Vmp), the temperature
coefficients at open circuit voltage and short circuit current (βVoc and αIsc, respectively), and the nominal operating cell temperature (NOCT). These data are available only at standard rating conditions (SRC), for which the irradiance is 1000 W/m2 and the cell temperature (Tc)
is 25 oC (except for the NOCT which is determined at 800 W/m2 and an ambient temperature of 20 oC).This is a reason why it is still necessary to work on improvement and validation of
5-parameters model for PV arrays for each generic conditions of operative temperature and solar irradiance [15, 16].
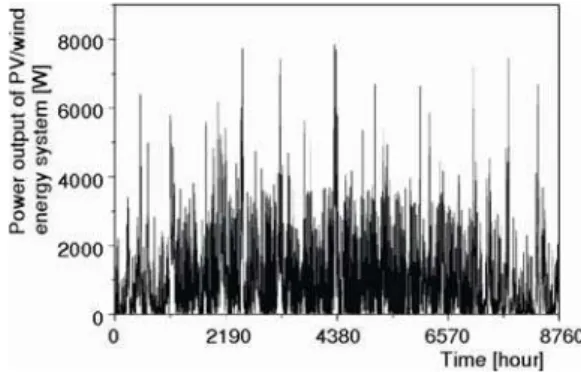
Adding special devices for electrical energy storage such as batteries, or systems based on hydrogen, can be achieved constant electrical power over a whole year. The overall power output of considered PV/Wind hybrid energy systems for regions of Belgrade city is shown in fig. 9.
Sizing of a storage system depends upon many different factors, such as the reliability of the system, the cost of the system and demand of load. A commercial alkaline electrolyzer HySTAT from Hydrogenics was selected [17]. This is an alkaline elektrolyzer with hydrogen max-imal production rate of 1.0 Nm3/h (at atmospheric pressure and 0 oC) with hydrogen gas storage tank volume of 100 l. The performance data of the electrolyzer HySTAT are given in tab. 7.
The difference between the generated power and loads per hour for Belgrade city is presented in fig. 10. Total electrical consumption for household is about 10,512 kWhe
annually. Hydrogen production during the year that can be used for energy supply is shown in fig. 11. Unbalance in the electricity production can be resolved by using new energy sources such as fuel cells and I-C engine, which uses hydrogen as fuel.
Figure 10. The difference between the generated
power and load for region of Belgrade city Figure 11. Hydrogen production during the year Figure 9. Power output of the PV/wind hybrid
energy system
Table 7. Performance data of the electrolyzer HySTAT
Ohmic resistance, r1 [Ωm2] 0.0015
Ohmic resistance, r2 [Ωm2·oC–1] –6.019·10–6
Overvoltage on electrodes, s1 [V] 2.427
Overvoltage on electrodes, t1 [m2A–1] 0.214
Overvoltage on electrodes, t2 [m2·oCA–1] –9.870
Overvoltage on electrodes, t3 [m2·oC2A–1] 119.1
Faraday efficiency, a1 [mAcm–1] 100.0
Faraday efficiency, a2 0.96
Convection heat transfer coefficient, h1[W·oC–1] 3.106
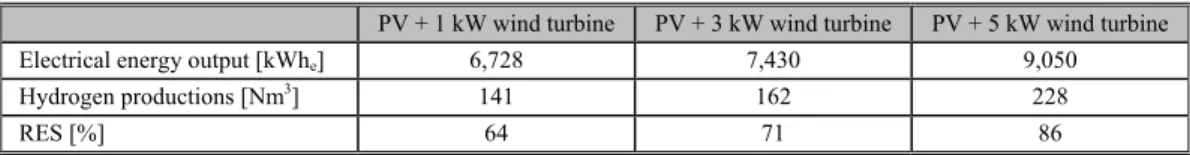
The obtained electrical energy and hydrogen productions from various configurations of PV/wind energy for regions of Novi Sad, Belgrade cities, and national park Kopaonik are shown in the tabs. 8, 9, and 10.
Table 8. Electrical energy output and hydrogen productions for region of Novi Sad city
PV + 1 kW wind turbine PV + 3 kW wind turbine PV + 5 kW wind turbine
Electrical energy output [kWhe] 6,728 7,430 9,050
Hydrogen productions [Nm3] 141 162 228
RES [%] 64 71 86
Table 9. Electrical energy output and hydrogen productions for region of Belgrade city
PV + 1 kW wind turbine PV + 3 kW wind turbine PV + 5 kW wind turbine
Electrical energy output [kWhe] 7,185 8,040 10,130
Hydrogen productions [Nm3]
156 182 264
RES [%] 68 76 96
Table 10. Electrical energy output and hydrogen productions for region of national park Kopaonik
PV + 1 kW wind turbine PV + 3 kW wind turbine PV + 5 kW wind turbine
Electrical energy output [kWhe] 7,950 9,290 12,500
Hydrogen productions [Nm3] 172 219 361
RES [%] 75 88 119
In tabs. 8, 9, and 10 is also presented the share of total energy obtained from renewable energy annually (RES%).
Estimation of CO2 reduction
Solar and wind energy are cleanest and most environmental friendly power source available. Fossil fuel burning causes a significant pollution of CO2, SO2, NOx, and other
gases. They have very bad influence on environment such as acid rain, air pollution, destruction of ozone layer and land and global earth warming. The effects of air pollutants on the human and natural environment and their impact on the public health, agriculture and ecosystems are directly related to the climate change and green house effects. There is a growing trend towards the use of renewable energy resources due the harmful impact on environmental pollution.
Based on the results of the proximate and ultimate analysis of coal samples from the “Kolubara” basin, the average net calorific values of lignite in Serbia is about 7.850 MJ/kg and the carbon emission factor is 29.78 tC/TJ [18]. According to the revised IPCC Guidelines for National Greenhouse Gas Inventories (1996), Tier 1. methodology, the reduction of CO2
emissions for the considered systems for the Belgrade city region is shown in tab. 11. The energy saving benefit from the reduction of consumption of the fossil fuels is closely related to the trading scheme of CO2. The European market price is currently 21.19 EUR/t CO2 and
changes during the year.
Table 11. The reduction of CO2 emissions for considered systems
PV +1 kW wind turbine [tCO2]
PV + 3 kW wind turbine [tCO2]
PV + 5 kW wind turbine [tCO2]
Novi Sad 7.77 8.58 10.46
Belgrade 8.30 9.30 11.35
Kopaonik 9.18 10.74 14.45
Conclusions
Hybrid energy system presented in this paper consists of different wind turbines, PV arrays, and an electrolyzer with tank. Technical analysis of a hybrid PV/wind system with hydrogen gas storage was performed. The case study is conducted by using meteorological data for (TMY) for Novi Sad city, Belgrade city, and Kopaonik national park, Serbia. It can be concluded that the PV/wind system is attractive for application in household in this area of Serbia. Hydrogen storage is good choice in terms of easy handling and cost efficiency and can be used for obtaining constant electricity regardless of the weather conditions. Simulation software TRNSYS version 16 was used for this project. TRNSYS has several models for estimation of solar energy on sloped surfaces. The 5-parameter model for PV arrays was selected for this analysis. According to the results of dynamical simulation of considered system the total electricity is obtained for various configuration of considered system. Adding special devices for electricity storage such as batteries, or systems based on hydrogen can be achieved constant electricity over a whole year. CO2 emissions reduction is also estimated in
this paper. There are small number of technical analysis of hybrid system in Serbia and other countries in the region. This paper can give realistic opinion on the role of such systems in present energy and environmental conditions.
Acknowledgment
This paper is the result of the investigations carried out within the scientific project TR33036 supported by the Ministry of Education and Science of the Republic of Serbia.
Nomenclature
a1 – Faraday efficiency, [mAcm –1
]
a2 – Faraday efficiency, [–] h1 – convection heat transfer coefficient, [W°C–1]
h2 – convection heat transfer coefficient, [W°C–1 per A]
Imp – current at maximum power point, [A] Isc – short circuit current, [A]
Pmax. – maximal nominal power, [W] r1 – ohmic resistance, [Ωm
2 ]
r2 – ohmic resistance, [Ωm2·oC–1] s1 – overvoltage on electrodes, [V] t1 – overvoltage on electrodes, [m
2 A–1]
t2 – overvoltage on electrodes, [m2°C2A–1] t3 – overvoltage on electrodes, [m
2 °C2A–1]
Tc – cell temperature, [K] U – wind velocity, [ms–1]
Vmp – voltage at maximum power point, [V] Voc – open circuit voltage, [V]
z – height from ground, [m]
Greek symbols
α – power-law exponent for vertical wind profile αIsc – temperature coefficient for short
circuit current, [AK–1]
βVoc – open voltage temperature coefficient, [VK–1] Acronyms
References
[1] Pragya Nema, R. K., Nema, S. R. A Current and Future State of Art Development of Hybrid Energy System Using Wind and PV-Solar: A Review, Renewable and Sustainable Energy Reviews, 13 (2009), 8, pp. 2096-2103
[2] Arribas, L., et al., PV–wind Hybrid System Performance: A New Approach and a Case Study,
Renewable Energy, 35 (2010), 1, pp. 128-137
[3] Celik, A. N., Techno-economic Analysis of Autonomous PV-wind Hybrid Energy Systems Using Different Sizing Methods, Energy Conversion and Management, 44 (2003), 12, pp. 1951-1968
[4] Salwan, S. D., Sopian, K., Electricity Generation of Hybrid PV/wind Systems in Iraq, Renewable Energy, 35 (2010), 6, pp. 1303-1307
[5] Barsoum, N. N., Goh, W. C., Modeling the Feasibility of an Integrated Hydrogen Hybrid Energy System for Stand Alone Power System, Proceeding, Australian Universities in Power and Energy Conference AUPEC 06, 2006, Melbourne, Australia
[6] Shakya, B. D. et al., Technical Feasibility and Financial Analysis of Hybrid Wind-Photovoltaic System with Hydrogen Storage for Cooma, International Journal of Hydrogen Energy, 30 (2005), 1, pp. 9-20 [7] Panahandeh, B. et al., Simulation of PV/Wind-hybrid Systems Combined with Hydrogen Storage for
Rural Electrification, International Journal of Hydrogen Energy, 36 (2011), 6, pp. 4185-4197
[8] Carapellucci, R., Giordano, L., Modeling and Optimization of an Energy Generation Island Based on Renewable Technologies and Hydrogen Storage Systems, International Journal of Hydrogen Energy, 37
(2012), 3, pp. 2081-2093
[9] Ekren, O., Ekren, B., Size Optimization of a PV/wind Hybrid Energy Conversion System with Battery Storage Using Simulated Annealing, Applied Energy, 87 (2010), 2, pp. 592–598
[10] Schneider, D., et al., Mapping the Potential for Decentralized Energy Generation Based on RES in Western Balkans, Thermal Science, 11 (2007), 3, pp. 7-26
[11] ***, TRNSYS Transient System Simulation Program, Reference Manual Vol. 5. Mathematical References, Solar energy Laboratory University of Wisconsin, Madison; 2003, http://web.mit.edu/pa-rmstr/Public/Documentation/05-MathematicalReference.pdf
[12] Duffie, J. A., Beckman, W. A., Solar Engineering of Thermal Processes, 3rd ed., John Wiley and Sons, New York, USA, 2006
[13] Ojosu, J. O., Salawu, R. I., An Evaluation of Wind Energy Potential as a Power Generation Source in Nigeria, Solar Wind Technology, 7 (1990), 6, pp. 663-673
[14] ***, http://www.bergey.com
[15] Lo Brano, V. et al., An Improved Five-Parameter Model for Photovoltaic Modules, Solar Energy Materials & Solar Cells, 94 (2010), 8, pp. 1358-1370
[16] De Soto, W., Klein, S. A., Beckman, W. A., Improvement and Validation of a Model for Photovoltaic Array Performance, Solar Energy, 80 (2006), 1, pp. 78-88
[17] Dieguez, P. M. et al., Thermal Performance of a Commercial Alkaline Water Electrolyzer: Experimental Study and Mathematical Modelling, InternationalJournal of Hydrogen Energy, 33 (2008), 24, pp. 7338-7354
[18] Stefanović, P. et al., Kolubara Mine Lignite Emmision Factor Evaluation (in Serbian), Termotehnika, 37
(2011), 2, pp. 241-251

![Table 11. The reduction of CO 2 emissions for considered systems PV +1 kW wind turbine [tCO 2 ] PV + 3 kW wind turbine [tCO2] PV + 5 kW wind turbine [tCO2] Novi Sad 7.77 8.58 10.46 Belgrade 8.30 9.30 11.35 Kopaonik 9.18 10.74 14.45 Conclusi](https://thumb-eu.123doks.com/thumbv2/123dok_br/18169274.329750/10.892.147.749.241.329/reduction-emissions-considered-systems-turbine-belgrade-kopaonik-conclusi.webp)
