Plasma Lysosphingomyelin Demonstrates
Great Potential as a Diagnostic Biomarker
for Niemann-Pick Disease Type C in a
Retrospective Study
Richard W. D. Welford1*, Marco Garzotti1, Charles Marques Lourenc¸o2, Eugen Mengel3, Thorsten Marquardt4, Janine Reunert4, Yasmina Amraoui3, Stefan A. Kolb1, Olivier Morand1, Peter Groenen1
1.Actelion Pharmaceuticals Ltd, Allschwil, Switzerland,2.Hospital das Clı´nicas de Ribeira˜o Preto, Sa˜o Paulo, Brazil,3.Department of Lysosomal Storage Disorder, Villa Metabolica, Center for Paediatric and Adolescent Medicine, University Medical Center of the Johannes Gutenberg University Mainz, Mainz, Germany,4.Klinik fu¨r Kinder- und Jugendmedizin, Mu¨nster, Germany
*richard.welford@actelion.com
Abstract
Niemann-Pick disease type C (NP-C) is a devastating, neurovisceral lysosomal storage disorder which is characterised by variable manifestation of visceral signs, progressive neuropsychiatric deterioration and premature death, caused by
mutations in the NPC1andNPC2genes. Due to the complexity of diagnosis and
the availability of an approved therapy in the EU, improved detection of NP-C may have a huge impact on future disease management. At the cellular level
dysfunction or deficiency of either the NPC1 or NPC2 protein leads to a complex intracellular endosomal/lysosomal trafficking defect, and organ specific patterns of sphingolipid accumulation. Lysosphingolipids have been shown to be excellent biomarkers of sphingolipidosis in several enzyme deficient lysosomal storage disorders. Additionally, in a recent study the lysosphingolipids, lysosphingomyelin (SPC) and glucosylsphingosine (GlcSph), appeared to be elevated in the plasma of three adult NP-C patients. In order to investigate the clinical utility of SPC and GlcSph as diagnostic markers, an in-depth fit for purpose biomarker assay validation for measurement of these biomarkers in plasma by liquid
chromatography-tandem mass spectrometry was performed. Plasma SPC and GlcSph are stable and can be measured accurately, precisely and reproducibly. In a retrospective analysis of 57 NP-C patients and 70 control subjects, median plasma SPC and GlcSph were significantly elevated in NP-C by 2.8-fold and 1.4-fold respectively. For miglustat-na¨ve NP-C patients, aged 2–50 years, the area underl
the ROC curve was 0.999 for SPC and 0.776 for GlcSph. Plasma GlcSph did not
OPEN ACCESS
Citation:Welford RWD, Garzotti M, Marques Lourenc¸o C, Mengel E, Marquardt T, et al. (2014) Plasma Lysosphingomyelin Demonstrates Great Potential as a Diagnostic Biomarker for Niemann-Pick Disease Type C in a Retrospective Study. PLoS ONE 9(12): e114669. doi:10.1371/journal.pone.0114669
Editor:Ashley Cowart, Medical University of South Carolina, United States of America
Received:July 3, 2014
Accepted:November 12, 2014
Published:December 5, 2014
Copyright:ß2014 Welford et al. This is an open-access article distributed under the terms of the
Creative Commons Attribution License, which permits unrestricted use, distribution, and repro-duction in any medium, provided the original author and source are credited.
Data Availability:The authors confirm that all data underlying the findings are fully available without restriction. All relevant data are within the paper and its Supporting Information files.
Funding:The study was funded by Actelion Pharmaceuticals. The funders (senior management and board) had no role in study design, data collection and analysis, decision to publish, or preparation of the manuscript.
correlate with SPC levels in NP-C patients. The data indicate excellent potential for the use of lysosphingomyelin in NP-C diagnosis, where it could be used to identify NP-C patients for confirmatory genetic testing.
Introduction
Niemann-Pick disease type C (NP-C) is caused by mutations in either the NPC1
or the NPC2 gene, it is a rare neurovisceral lysosomal storage disorder (LSD)
which leads to progressive neuropsychiatric deterioration and in the majority of cases, premature death [1]. The visceral, neurological and psychiatric manifesta-tions observed in NP-C patients are heterogeneous in their presentation and are shared with other disorders complicating diagnosis [2]. The most recent analysis found a significant discrepancy between average on-set of neurological symptoms (10.9¡9.8 years) and diagnosis (15.0¡12.2 years) [3]. Additionally, there is increasing evidence from epidemiological studies that there may be a pool of patients who only become symptomatic later in-life and consequently remain undiagnosed [2,4].
Recent efforts have aimed to score the symptomatology of NP-C using a disease-specific Suspicion Index [5], as well as disease scales [6,7]. Tools like the NP-C Suspicion Index should help channel symptomatic patients towards expert medical centers for appropriate clinical evaluation, and genetic and biochemical diagnostic tests. The existence of an approved therapy for NP-C in around 40 countries (with the notable exception of the United States) and current efforts by the National Institutes of Health to explore new therapies serve to underline the need for improved methods of diagnosing this devastating disease.
It has recently become apparent that plasma levels of the N-deacetylated, lyso forms of sphingolipids are increased in patients with LSDs in which the activity of enzymes involved in complex sphingolipid degradation is deficient such as Fabry [11], Gaucher [12], GM2 gangliosidoses [13], Krabbe [14] and Niemann-Pick disease type B [15]. The increase in plasma lysosphingolipids can be more than an order of magnitude greater than that for the equivalent sphingolipid, making the lysosphingolipids potentially powerful biomarkers for both diagnosis and
monitoring of treatment effects in their respective LSDs.
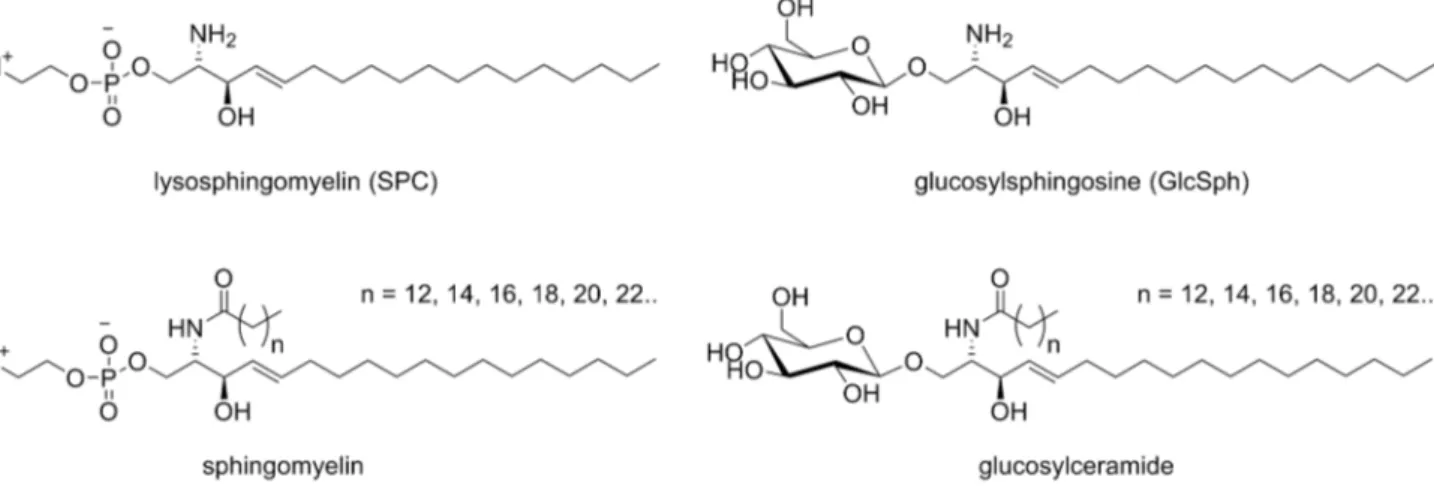
NP-C differs from the sphingolipid LSDs in that the aberrant protein is not an enzyme involved in breakdown of sphingolipids, but in 95% of cases a membrane protein (NPC1) whose disruption leads to a complex intracellular endosomal/ lysosomal trafficking defect [1]. As a consequence of this defect along with unesterified cholesterol, a large number of different complex sphingolipids accumulate with differing organ specificity in both NP-C patients and animal models [1,16,17,18]. This led to the hypothesis that a panel of lysosphingolipids may be useful as biomarkers in NP-C. This hypothesis was previously tested in the ZOOM study, a multicentre genetic screening study of adult patients with neurological and psychiatric symptoms [4]. The three adult NP-C patients identified in the ZOOM study appeared to have elevated plasma levels of both lysosphingomyelin (SPC) and hexosylsphingosine (GlcSph) (Figure 1) when compared to NP-C negative patients.
Data from an in-depth technical assay validation for measurement of plasma SPC and GlcSph are reported here. The two lysosphingolipids were measured in the plasma of 57 NP-C patients in a retrospective study and SPC is shown to have potential diagnostic utility.
Materials and Methods
Materials
Assay validation
Before commencing assay validation a full assay validation plan was written according to FDA and EMA guidelines for bioanalytical methods to aid the experimental design [19,20] and a set of acceptance criteria was designed. To determine the accuracy of the method with the quality control (QC) samples an adaption of the method for LC-MS/MS biomarker validation described by Houghton et al was used [21]. The nominal concentration of QC2 was defined as the average measured value for the three validation batches. The nominal concentrations of QC3 and QC4 were the nominal concentration of QC2 plus the respective spiking concentrations. The standard validation batch used for
determination of precision and accuracy consisted of duplicate calibration curves, duplicate blank sample (unspiked surrogate matrix) and six replicates of each QC sample.
Preparation of calibration solutions and quality controls
Working solutions of GlcSph and SPC 100-fold above the final concentrations were prepared in CHCl3/MeOH 2:1. For preparation of the calibration (CAL) and quality control (QC) solutions, surrogate matrix (EDTA-plasma pool, 10-fold diluted with PBS buffer) and EDTA-plasma pool respectively were fortified with the working solutions using a ratio of 99/1 (v/v). Following preparation of the CAL and QC solutions 130 ml aliquots were frozen at 220
˚
C. The nine CALs covered the range of 5–500 nM and 0.5–50 nM for SPC and GlcSph respectively.Sample preparation
For each sample (CAL, QC or study sample), 100 mL of sample was added to 900 mL of solution A (25% MeOH +0.1% H3PO4) containing the internal standards (ISTDs) (1.5 nM of C17-SPC and 0.5 nM of D-GlcSph). The tubes were
Figure 1. Chemical structures of sphingolipids.The lysosphingolipids SPC and GlcSph measured in plasma for this study, along with their N-acetylated counterparts, sphingomyelin and the monohexosylceramide glucosylceramide which are known to accumulate in the organs of NP-C patients.
placed in a 96-well plate (96WP) format rack and mixed at 1000 rpm for 10 min at 37
˚
C. The samples were transferred (900 mL) into the wells of the solid phase extraction (SPE) 96-well plate (Waters OASIS HLB 96Well Plate 30 mg)previously primed with: 1 mL hexane, 1 ml methanol, 261 mL solution A). The
sample was loaded on the SPE matrix by vacuum, the SPE matrix was washed twice with 1 mL of solution A and 1 mL of solution B (25% MeOH). The lysosphingolipids were eluted with 1.2 mL of solution C (100% MeOH +0.01% v/v NH4OH) (three additions of 400mL). The solution eluted from the SPE matrix was dried under a stream of heated nitrogen (60
˚
C). For LC–MS/MS analysis, 60 mL of solution D (90% MeOH +0.1% v/v HCOOH) was added to each tube. The samples in the 96WP rack were vortexed for 10 min at room temperature, sonicated for 10 min in an ultrasound bath and then centrifuged for 5 min at 2000 g. The supernatant was transferred to a new 96WP and 5 mL were injected into the LC-MS/MS system.LC-MS/MS
Experiments were performed with a ABSciex QTRAP6500 equipped with a Dionex UltiMate 3000 HPLC unless otherwise noted. The instrument was run in positive ion electrospray mode with the following source parameters curtain gas (30); collision gas (high) Q1 and Q3 resolution (unit); ion spray voltage (5500); temperature (550); gas1 (55) and gas2 (50). The following transitions were used for quantification (Q1/Q3); SPC (465.3/184); C17-SPC (451.3/184); GlcSph (462.3/282.1) and D-GlcSph (460.3/280.1). For secondary qualitative assessment for interferences the following transitions were used SPC (465.3/125); C17-SPC (451.3/125); GlcSph (462.3/264.1) and D-GlcSph (460.3/262.1). The dwell times for individual quantitative and qualifier transitions were 40 and 10 ms
respectively. Other parameters (EP, DP, CE, and CXP) were optimized per transition using standard procedures.
The HPLC autosampler was maintained at 15.0
˚
C with an autosampler wash of water/methanol (25/75, v/v). The column oven temperature was 55.0˚
C. Buffer A was 100% water+0.1% v/v HCOOH. Buffer B was 50:50 acetone:acetonitrile with 0.1% v/v HCOOH. The HPLC column and conditions were similar to those described [22]. An ACE 3 C8, 5062.1 mm ID (ACE-112-0502) with aguard-column ACE 3 C8, 2.1 mm (ACE-112-0102GD) at a flow rate of 0.9 mL/min was used. A gradient was run from 10 to 66% buffer B over the first 4 min, followed by cleaning with 100% buffer B for 1minute and 0.5 min of re-equilibration with 10% buffer B.
Matrix effect
400 nM SPC, 40 nM GlcSph as high level) in four replicates. Matrix factors (MF) and ISTD normalized MFs were calculated using standard methods.
EDTA-blood stability experiment
Fresh EDTA-blood was collected and divided into 76600 mL aliquots. An aliquot
was immediately centrifuged for 10minutes at 20
˚
C and 2000 g in order to prepare EDTA-plasma and frozen on dry ice. The remaining 6 aliquots were stored at room temperature and plasma samples were prepared following the same procedure after 30 min, 1 h, 2 h, 3 h, 4 h and 5 h.Incurred sample reanalysis
Variability was calculated as defined in [23], using the equation. Variability
5100*(Repeat-original)/mean.
Acceptance criteria for sample-sets
All CALs were to be run in duplicate and QCs in duplicate or quadruplicate. A sample-set was to be considered valid if 66% of the QCs were within 15% of the validation defined concentration (20% for QC2), including at least 50% at each level. At least two-thirds of the CAL samples had to be within ¡15% of their respective nominal values. A tolerance of ¡20% was allowed for CAL1. If neither of the two CAL1 samples reached the tolerance of ¡20%, the batch was to be repeated. If one analyte failed to meet the acceptance criteria, the batch was to be repeated, but the data for the accepted analyte from the first run were to be used.
Glucosyl- and galactosylsphingosine separation
The samples were prepared as per the standard method except 200 mL plasma was loaded on the SPE cartridge. The chromatographic method consisted of an isocratic gradient of acetonitrile:water:methanol 86:7:7 containing 315 mg/L of ammonium formate and 0.1% v/v formic acid on an Atlantis HILIC Silica 5 mm, 15062.1 mm column (Waters Part No 186002016).
Cholestan-3
b
,5
a
,6
b
-triol measurement
Cholestan-3b,5a,6b-triol was measured using a GCMS method adapted from that in Porter et al. [10] (Reunert et al. manuscript in preparation).
LC-MS/MS data was processed with MultiQuant 2.1 (ABSciex) with some further statistical assessment in Excel (Microsoft). Column statistics, Kruksal-Wallis (with Dunn’s multiple comparison test), Mann Whitney, Pearson
NP-C patients and control subjects
All NP-C patients and controls had given written consent to the use of their sample for biomarker measurements. The consent form had been approved by the relevant local committees (Ethic Comitee from Hospital das Clinicas de Ribeirao Preto (HCRP), University of Sao Paulo and Landesa¨rztekammer Rheinland-Pfalz). NP-C patients had been previously diagnosed as NP-C based on gene sequencing (46%), filipin staining (7%), or both (47%). Age and sex
demographics on the cohorts are given in table 1. The control group comprised 70 samples from five different sources. Thirty five of the control samples were purchased from three different commercial suppliers of biosamples. The remaining samples came from the same centers as the NP-C patients and a number had similar symptoms.
Results
Plasma SPC and GlcSph were measured using LC-MS/MS and the elution profile of the analytes and internal standards (ISTD) can be seen in Figure S1in File S1.
Bioanalytical precision and accuracy
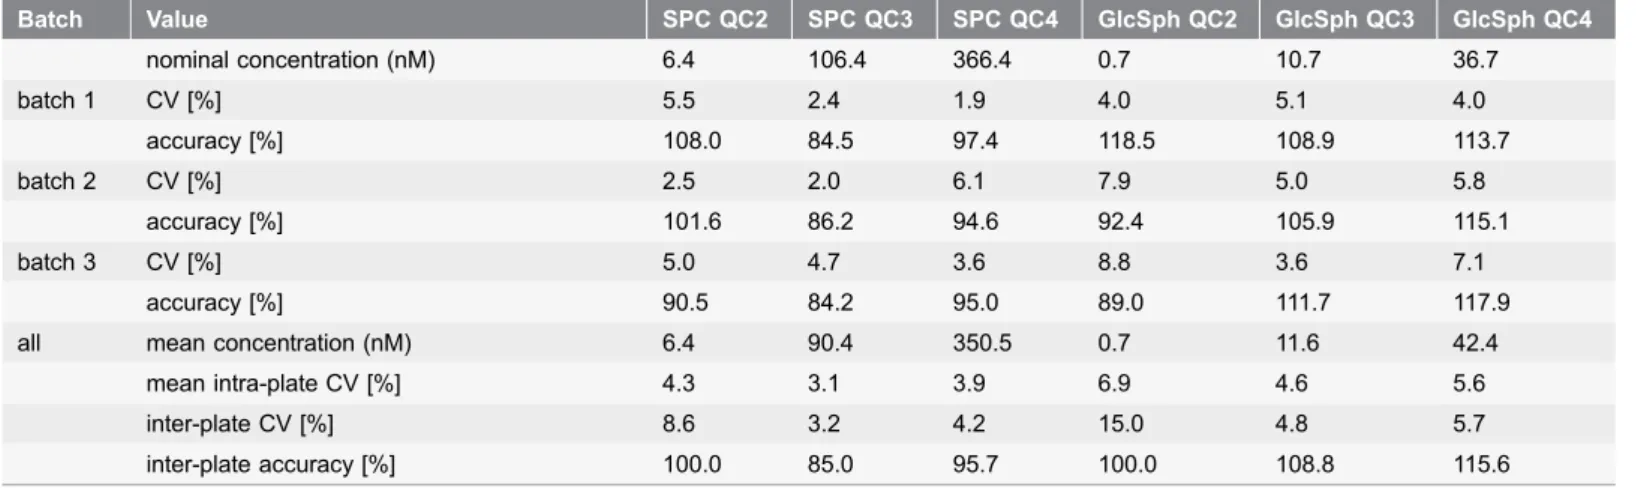
The descriptive statistics of the plasma quality control (QC) samples for the three main validation batches are presented in Table 2. The QCs gave good precision across the three validation batches. The accuracy of the assay for measurement of the spiked plasma samples QC3 and QC4 was also acceptable when the high precision and intended use of the method are taken into account [24].
Matrix effect
The matrix effect was assessed using EDTA-plasma from 6 different donors and 2 spiking concentrations of the analytes (Table S1 in File S1). In all cases the matrix factor was found to be close to 1 and the CV of the internal standard normalized matrix factor was,10%. This indicates that the matrix effects were negligible and that between the six different donors there is minimal variation in matrix effect.
Stability experiments
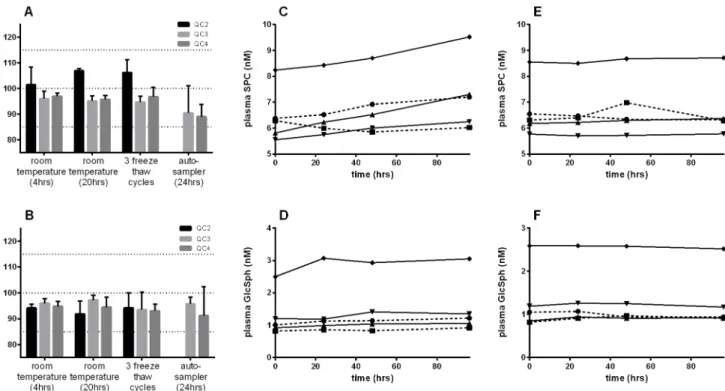
Both analytes were found to be stable in the plasma QC samples when stored at room temperature or 4
˚
C for 24 h, after three freeze-thaw cycles and after 24 h in the autosampler post extraction (Figure 2A and 2B).investigate the analyte stability, de-risk assay performance and, importantly, to examine conditions that may realistically occur in a clinical setting.
Plasma stability was tested in samples from five donors for up to 96 h at both room temperature and 4
˚
C (Figures 2C-F). Both analytes showed good stability after 96 h at room temperature, the levels of SPC and GlcSph had increased by only 13% (p50.058) and 17% (p50.048) respectively (2-tailed paired t-test). When the plasma was maintained at 4˚
C after 96 h the analytes were completely stable, with only a negligible increase of 0.76% and 0.25% for SPC and GlcSph respectively. The stability in fresh EDTA-blood at room temperature was also tested in samples from three different donors (Figure S3inFile S1), both analytes were completely stable within the limits of the experiment showing an average increase of only ,4% during 5 h.Table 1.Demographics of the cohorts.
Group Control NP-C
Number of values 70 57
Male (%) 44.3 42.1
Female (%) 55.7 57.9
Age (yrs) minimum 1 2
Age (yrs) 25% percentile 9 11
Median age (yrs) 16 15
Age (yrs) 75% percentile 25 22
Age (yrs) maximum 69 72
doi:10.1371/journal.pone.0114669.t001
Table 2.Precision and accuracy of the QC plasma samples.
Batch Value SPC QC2 SPC QC3 SPC QC4 GlcSph QC2 GlcSph QC3 GlcSph QC4
nominal concentration (nM) 6.4 106.4 366.4 0.7 10.7 36.7
batch 1 CV [%] 5.5 2.4 1.9 4.0 5.1 4.0
accuracy [%] 108.0 84.5 97.4 118.5 108.9 113.7
batch 2 CV [%] 2.5 2.0 6.1 7.9 5.0 5.8
accuracy [%] 101.6 86.2 94.6 92.4 105.9 115.1
batch 3 CV [%] 5.0 4.7 3.6 8.8 3.6 7.1
accuracy [%] 90.5 84.2 95.0 89.0 111.7 117.9
all mean concentration (nM) 6.4 90.4 350.5 0.7 11.6 42.4
mean intra-plate CV [%] 4.3 3.1 3.9 6.9 4.6 5.6
inter-plate CV [%] 8.6 3.2 4.2 15.0 4.8 5.7
inter-plate accuracy [%] 100.0 85.0 95.7 100.0 108.8 115.6
Shown are the precision and accuracy for each analyte at 3 levels in 3 batches (N56 per batch) and the inter batch statistics. The nominal concentration of QC2 was defined as the average measured value for the three validation batches. The nominal concentrations of QC3 and QC4 were the nominal concentration of QC2+the respective spiking concentrations. The precision (coefficient of variation CV) and accuracy (%, where 100% is the actual value) are given for each of the individual batches and for the data-set as a whole.
EDTA-plasma and heparin-plasma
The SPC and GlcSph levels were assessed in plasma samples taken from blood with either heparin or EDTA anticoagulant from 10 donors. A paired t-test indicated there was no difference in going from EDTA- to heparin-plasma with differences of 20.6% (p50.77) for SPC and 25.2% (p50.26) for GlcSph.
Robustness
A set of CALs and QCs was run on two different LC-MS/MS systems that were not used during the assay validation. In both cases the acceptance criteria were met for the calibration curves and the concentration of the QC samples (Table S2inFile S1).
Incurred sample reanalysis
A group of 58 samples coming from four different sites was analyzed twice. The variability was ,20% for 74% of samples for both SPC and GlcSph and was
,30% for 91% and 84% of samples for SPC and GlcSph respectively. A similar experiment performed with 10 control samples stored at 280
˚
C and 3 months apart gave variability of ,20% for 90% (SPC) and 100% (GlcSph) of samples.Figure 2. Stability of GlcSph and SPC in plasma.A and B show the stability of the plasma QC samples under different conditions for SPC and GlcSph respectively. Percentage measured compared to the average concentration of the samples determined in the three validation batches is shown. Data are reported+/2standard deviation for 3 replicate measurements. Note the observation of all data being a little under 100% represents a systematic bias from this particular batch; Stability of SPC and GlcSph in EDTA-plasma from five donors incubated at room temperature (C and D) and 4˚C (E and F) for up to 96 hours. Each trace represents an individual donor.
Measurement in NP-C patients
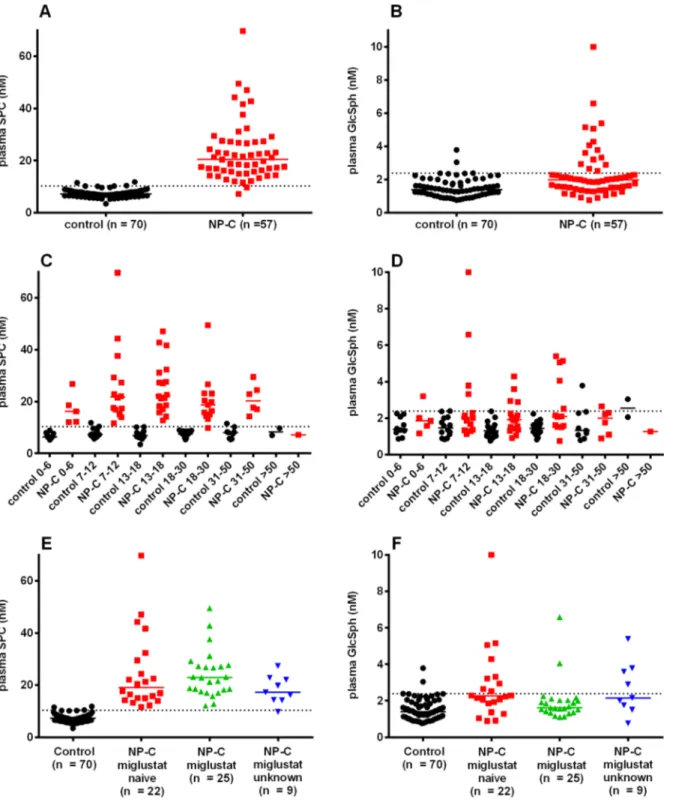
Plasma SPC and GlcSph were measured retrospectively in a cohort of 57 NP-C patients and was compared to a control group comprising of 70 samples.
Median plasma SPC was 2.8-fold higher in NP-C patients than controls, with almost no overlap between the two groups (Figure 3A andTable S3 inFile S1). Median plasma GlcSph was 1.4-fold significantly elevated in the NP-C group compared to the control group (Mann-Whitney), although there were a significant number of NP-C patients with GlcSph within the normal range (Figure 3B). When the groups were split based on age, SPC was seen to be elevated independently (Figure 3C), with the exception of the single patient in the
.50 years age sub-group. There was also no obvious influence of age on the GlcSph elevation (Figure 3D). The NP-C group in the age range 0–50 years was subsequently split based on treatment with the glucosylceramide synthase inhibitor miglustat (Figure 3E and 3F). SPC was not significantly affected by miglustat treatment (Kruksal-Wallis test). The miglustat-treated NP-C sub-group had lower GlcSph than the miglustat-na¨ve sub-group (l Figure 3F). This
comparison in itself did not reach significance (Kruksal-Wallis test with Dunn’s multiple comparison test). However, only the miglustat-na¨ve sub-group hadl significantly more GlcSph than the controls.
A ROC analysis was performed to assess the ability of plasma SPC and GlcSph to separate miglustat-na¨ve NP-C patients in the age range 0–50 years froml controls (Figure 4). SPC and GlcSph gave areas under the curve of 0.9994 and 0.7764 respectively. A cut-off of 11 nM for SPC would provide a sensitivity of 100% and specificity of 97%. Notably the ROC analysis does not in this case determine the true diagnostic sensitivity and specificity because it is not run in a population suspected of having NP-C.
A correlation plot of SPC and GlcSph indicated that the two markers significantly correlated in controls, but not in NP-C patients (Figure 5A). The NP-C patients with high GlcSph, included 5 miglustat-na¨ve patients withl relatively low SPC (,17 nM).
For 19 controls and 18 NP-C patients the performance of SPC was compared to that of cholestan-3b,5a,6b-triol (Figure 5B). The 2 markers did not correlate for the NP-C patients (Spearman r50.156, p50.54) suggesting that a combination of the two markers could be the most powerful for diagnosis.
For 32 NP-C patients serial samples were available from follow-up visits (Figure S4 inFile S1). SPC in particular was found to be relatively stable with time in the majority of patients. No strong miglustat treatment effect on either biomarker could be deduced from the data.
Glucosylsphingosine
Figure 3. Plasma SPC and GlcSph in NP-C patients and controls.One sample per patient is shown, where multiple samples from one patient were available the first was used. The dotted horizontal line represents the 95% percentile of the entire control group for SPC (10.3 nM) and GlcSph (2.4 nM). The bar is the median. A and B, SPC and GlcSph in the entire cohort; C and D, SPC and GlcSph separated by age (years); E and F, SPC and GlcSph separated by miglustat status (0–50 years). The miglustat treated patients had been on treatment for 2.8¡1.4 years (average¡standard deviation), 0.7–6 years (Min-Max).
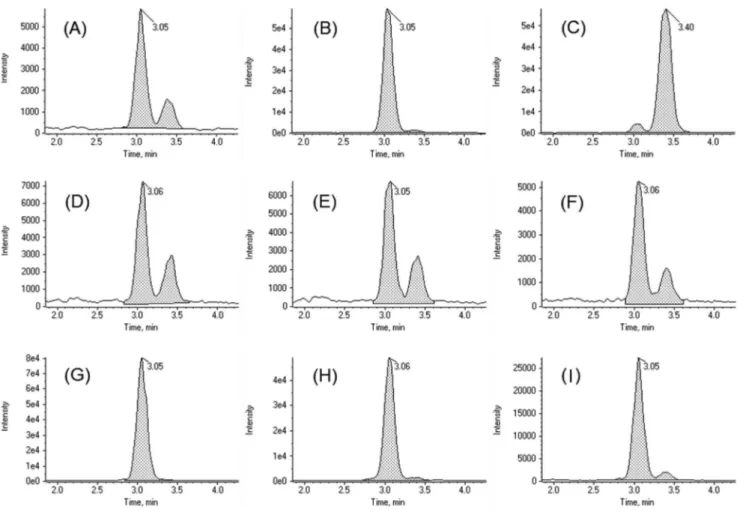
that interactions were dominated by the polar sugar moiety. GlcSph was found to elute before GalSph (Figure 6). In the control samples there was ,3-fold more GlcSph than GalSph. In the three NP-C patient samples, the increase above normal levels was dominated by GlcSph, leading to an increase in the GlcSph/ GalSph ratio (to .12) (Figure 6).
Figure 4. ROC analysis of plasma SPC and GlcSph.SPC (green) and GlcSph (blue) for the age range 0– 50 years with miglustat-nal¨ve NP-C patients compared to the control group. The area under the curve (95% CI) was 0.9994 (0.9972 to 1.002) and 0.7764 (0.6479 to 0.9048) for SPC and GlcSph respectively.
doi:10.1371/journal.pone.0114669.g004
Figure 5. Biomarker correlation plots A: SPC and GlcSph.The control subjects are black circles, the NP-C patients are colored by miglustat treatment status as forFigure 3E. A Spearman correlation analysis gave (r, p value) for control (0.48,,0.0001), NP-C miglustat nal¨ve (20.11, 0.63), NP-C miglustat treated (0.75, ,0.0001) and miglustat unknown (0.28, 0.46). The dotted horizontal and vertical lines are the 95% percentile of the entire control group for SPC (10.3 nM) and GlcSph (2.4 nM) respectively.B: SPC and cholestan-3b,5a,6b-triol.For controls (black circles) and C (red squares). The 2 markers did not correlate for the NP-C patients (Spearman r50.265, p50.273). The horizontal dotted line represents the 95 percentile of normal for cholestan-3b,5a,6b-triol (0.04 ng/mL). The vertical cut-off is 95 percentile of normal for SPC. Values below the assay LOQ were set at the LOQ for SPC (5 nM) and cholestan-3b,5a,6b-triol (0.001 ng/uL).
Discussion
NP-C is a devastating neurovisceral disease in which the time from neurological symptom onset to diagnosis is still too long and it must be feared that a number of cases remain undiagnosed. Biomarkers such as SPC described in this manuscript have the potential to facilitate diagnosis as they are reliable and easy to use with large numbers of samples.
For clinical qualification of biomarkers it is essential to validate the assay to establish overall bioanalytical precision, accuracy and robustness, as well as to identify potential pitfalls. The assay has excellent precision and good accuracy and it is easy to run in 96-well format, making it appropriate for moderate through-put screening. The markers showed good stability in the conditions tested including for 4 days in plasma at 4
˚
C and for 5 h in blood at room temperature. Additionally, the biomarker levels were unaffected by the anti-coagulant used in the blood draw. After a period of ,80 days storage at220˚
C an upward drift ofFigure 6. Glucosylsphingosine not galactosylsphingosine is increased in the plasma of NP-C patients.LC-MS/MS chromatograms showing separation of glucosyl- and galactosyl-sphingosine with HILIC chromatography. (A) QC2; (B) QC2 spiked with 5 nM glucosylsphingosine; (C) QC2 spiked with 5 nM galactosylsphingosine; (D) control sample 1; (E) control sample 2; (F) control sample 3; (G) NP-C sample 1; (H) NP-C sample 2; (I) NP-C sample 3.
SPC in the low QC sample was observed. This is at odds with the rest of the stability data, as levels in samples stored at 280
˚
C for similar lengths of time remained stable. Additionally, control samples stored at280˚
C for 2 years were in the same range as those taken 1–2 months before measurement.LC-MS/MS assays are usually developed in individual laboratories and there is a wide range of different instruments and configurations available. It was found that sample measurement could be transferred rapidly across three different
instrument platforms, with the same final measured concentrations, despite differences in machine response.
With the validated assay in hand plasma SPC and GlcSph were assessed in a cohort of NP-C patients. Plasma SPC was elevated in NP-C patients independent of age in the range 0–50 years, and of treatment with miglustat. Although limited by the sample set, the ROC clearly demonstrated the ability of SPC to sensitively identify NP-C patients as observed previously in the ZOOM study [4]. SPC was also seen to be elevated in NP-C patient plasma samples in a patent application by Rolfs and Mascher (PCT/EP2012/004756) which became public while completing the work described here.
For GlcSph the increase in plasma levels above normal was present in 41% of miglustat na¨ve NP-C patients. As miglustat is a glucosylceramide synthasel inhibitor it might be expected to lower GlcSph and the data seem to suggest this might be the case, as in the miglustat treated sub-group only 8% of patients had elevated GlcSph, although statistical significance is not reached. GlcSph and SPC did not correlate for miglustat-na¨ve NP-C patients, indicating that there may be al benefit to maintain the two-analyte assay for NP-C diagnosis.
Plasma lysosphingolipids most probably represent accumulated N-acetylated sphingolipids in the organs (sphingolipidosis), making them complementary to oxysterols as oxidative stress biomarkers for NP-C. The visceral NP-C symptoms of splenomegaly, hepatomegaly and cholestatic jaundice are all heterogeneous, and at least partially age dependent in their presentation [2]. The observation that plasma SPC and GlcSph increases are largely independent of age therefore implies that they are not linked to any one specific visceral symptom.
Although Niemann-Pick diseases type A (NP-A), B (NP-B) and C have different etiologies they exhibit certain clinical, morphological and biochemical similarities including the accumulation of sphingomyelin in the liver and spleen [1,25]. The recent observation that the 7-ketocholesterol oxysterol marker is also elevated in NP-A and NP-B, both characterized by acid sphingomyelinase deficiency, serves to support the link between the sphingomyelin/SPC and cholesterol/oxysterol axes [26]. In fact, there is a rich base of literature
demonstrating an interaction between sphingomyelin and cholesterol both on the physical chemical level within membranes and through regulating one another’s synthesis [27].
sphingolipids in the plasma of NP-C patients [16]. Increases in monohexosyl-ceramides were among the most marked changes, and were reportedly augmented by miglustat therapy. The latter observation is not confirmed by the GlcSph data reported here, suggesting that glucosylceramide and GlcSph are not necessarily correlated.
There is already strong evidence that GlcSph is markedly elevated in the plasma of Gaucher patients [12,29], with the increase being much larger than that seen here for NP-C. Similarly, SPC was recently observed to be elevated in blood spots from patients with NP-B [15]. The fact that the assay described here will likely be of use for several LSDs offers a potential cost saving benefit. The possibility to use dried blood spots could be particularly attractive for physicians far from tertiary centers. Additionally, due to the rarity of LSDs, physicians often find it difficult to diagnose patients and screening for multiple diseases offers the chance to serendipitously identify patients who might otherwise be missed.
The assay for SPC has appropriate through-put and sensitivity that it could both replace the filipin test in the NP-C diagnostic algorithm [30] and be used to identify NP-C patients in pre-specified populations with a prevalence of above 1%, providing confirmatory genetic testing is utilized. Pre-specified populations with sufficient suspicion of NP-C would include infants with neonatal cholestatic liver disease [2], patients with hepatosplenomegaly [31], the intellectually disabled [32] and adults with neurological and psychiatric symptoms [4]. Together with differential clinical diagnosis, the standard enzymatic tests for Gaucher and NP-A/ B could also be used as an alternative to sequencing to differentiate these disorders from NP-C in patients with elevated plasma SPC and GlcSph. However, based on the available data [12,29] it looks quite possible that future studies will establish that Gaucher and NP-A/B can be differentiated from NP-C based on plasma levels of GlcSph and SPC respectively.
The LC-MS/MS assay described here for the measurement of the
lyso-sphingolipids SPC and GlcSph in human plasma is precise, accurate, robust, stable to differences in sampling conditions and simple to run at moderate through-put. These factors should enable clinical implementation. As these markers are relevant to other LSDs, the assay validation data will be of more general use to clinical scientists and laboratories. SPC is confirmed as being elevated in the plasma of NP-C patients and the sensitivity/specificity of 100%/97% in the studied
Supporting Information
File S1. Supplemental tables and figures.
doi:10.1371/journal.pone.0114669.s001 (DOCX)
Acknowledgments
We would like to thank Miss A Tre´baul and Dr A Brecht (both Actelion) for assistance with logistics for samples. Dr M Reilly (InTouch Medical Ltd) provided editing support for an early version of this manuscript, paid for by Actelion Pharmaceuticals. Mr J V. Torres Martin (Syntax for Science SL) createdFigure S4.
Author Contributions
Conceived and designed the experiments: RW MG CML EM TM JR YA SK OM PG. Performed the experiments: MG. Analyzed the data: RW MG OM PG. Contributed reagents/materials/analysis tools: CML EM TM JR YA. Wrote the paper: RW MG CML EM TM SK OM PG.
References
1. Vanier MT(2010) Niemann-Pick disease type C. Orphanet J Rare Dis 5: 16.
2. Mengel E, Klunemann HH, Lourenco CM, Hendriksz CJ, Sedel F, et al.(2013) Niemann-Pick disease type C symptomatology: an expert-based clinical description. Orphanet J Rare Dis 8: 166.
3. Patterson MC, Mengel E, Wijburg FA, Muller A, Schwierin B, et al. (2013) Disease and patient characteristics in NP-C patients: findings from an international disease registry. Orphanet J Rare Dis 8: 12.
4. Bauer P, Balding DJ, Klunemann HH, Linden DE, Ory DS, et al. (2013) Genetic screening for Niemann-Pick disease type C in adults with neurological and psychiatric symptoms: findings from the ZOOM study. Hum Mol Genet 22: 4349–4356.
5. Wijburg FA, Sedel F, Pineda M, Hendriksz CJ, Fahey M, et al.(2012) Development of a suspicion index to aid diagnosis of Niemann-Pick disease type C. Neurology 78: 1560–1567.
6. Iturriaga C, Pineda M, Fernandez-Valero EM, Vanier MT, Coll MJ(2006) Niemann-Pick C disease in Spain: clinical spectrum and development of a disability scale. J Neurol Sci 249: 1–6.
7. Yanjanin NM, Velez JI, Gropman A, King K, Bianconi SE, et al.(2010) Linear clinical progression, independent of age of onset, in Niemann-Pick disease, type C. Am J Med Genet B Neuropsychiatr Genet 153B: 132–140.
8. Stampfer M, Theiss S, Amraoui Y, Jiang X, Keller S, et al.(2013) Niemann-Pick disease type C clinical database: cognitive and coordination deficits are early disease indicators. Orphanet J Rare Dis 8: 35.
9. Jiang X, Sidhu R, Porter FD, Yanjanin NM, Speak AO, et al.(2011) A sensitive and specific LC-MS/ MS method for rapid diagnosis of Niemann-Pick C1 disease from human plasma. J Lipid Res 52: 1435– 1445.
10. Porter FD, Scherrer DE, Lanier MH, Langmade SJ, Molugu V, et al.(2010) Cholesterol oxidation products are sensitive and specific blood-based biomarkers for Niemann-Pick C1 disease. Sci Transl Med 2: 56ra81.
12. Dekker N, van Dussen L, Hollak CE, Overkleeft H, Scheij S, et al. (2011) Elevated plasma glucosylsphingosine in Gaucher disease: relation to phenotype, storage cell markers, and therapeutic response. Blood 118: e118–127.
13. Kodama T, Togawa T, Tsukimura T, Kawashima I, Matsuoka K, et al.(2011) Lyso-GM2 ganglioside: a possible biomarker of Tay-Sachs disease and Sandhoff disease. PLoS One 6: e29074.
14. Chuang WL, Pacheco J, Zhang XK, Martin MM, Biski CK, et al.(2013) Determination of psychosine concentration in dried blood spots from newborns that were identified via newborn screening to be at risk for Krabbe disease. Clin Chim Acta 419: 73–76.
15. Chuang WL, Pacheco J, Cooper S, McGovern MM, Cox GF, et al. (2014) Lyso-sphingomyelin is elevated in dried blood spots of Niemann-Pick B patients. Mol Genet Metab 111: 209–211.
16. Fan M, Sidhu R, Fujiwara H, Tortelli B, Zhang J, et al. (2013) Identification of Niemann-Pick C1 (NPC1) disease biomarkers through sphingolipid profiling. J Lipid Res 54: 2800–2814.
17. Vanier MT (1983) Biochemical studies in Niemann-Pick disease. I. Major sphingolipids of liver and spleen. Biochim Biophys Acta 750: 178–184.
18. Vanier MT(1999) Lipid changes in Niemann-Pick disease type C brain: personal experience and review of the literature. Neurochem Res 24: 481–489.
19. EMA(2011) Guideline on bioanalytical method validation (EMEA/CHMP/EWP/192217/2009).
20. FDA(2001) Guidance for Industry: Bioanalytical Method Validation.
21. Houghton R, Horro Pita C, Ward I, Macarthur R (2009) Generic approach to validation of small-molecule LC-MS/MS biomarker assays. Bioanalysis 1: 1365–1374.
22. Johnson B, Mascher H, Mascher D, Legnini E, Hung CY, et al. (2013) Analysis of lyso-globotriaosylsphingosine in dried blood spots. Ann Lab Med 33: 274–278.
23. Fast DM, Kelley M, Viswanathan CT, O’Shaughnessy J, King SP, et al.(2009) Workshop report and follow-up–AAPS Workshop on current topics in GLP bioanalysis: Assay reproducibility for incurred samples—implications of Crystal City recommendations. AAPS J 11: 238–241.
24. Stevenson L, Garofolo F, Desilva B, Dumont I, Martinez S, et al.(2013) 2013 White Paper on recent issues in bioanalysis: ’hybrid’ - the best of LBA and LCMS. Bioanalysis 5: 2903–2918.
25. Crocker AC(1961) The cerebral defect in Tay-Sachs disease and Niemann-Pick disease. J Neurochem 7: 69–80.
26. Lin N, Zhang H, Qiu W, Ye J, Han L, et al.(2013) Determination of 7-ketocholesterol in plasma by liquid chromatography mass spectrometry for rapid diagnosis of acid sphingomyelinase deficient Niemann-Pick disease. J Lipid Res 55: 338–343.
27. Slotte JP(2013) Biological functions of sphingomyelins. Prog Lipid Res 52: 424–437.
28. Lloyd-Evans E, Platt FM(2010) Lipids on trial: the search for the offending metabolite in Niemann-Pick type C disease. Traffic 11: 419–428.
29. Rolfs A, Giese AK, Grittner U, Mascher D, Elstein D, et al.(2013) Glucosylsphingosine is a highly sensitive and specific biomarker for primary diagnostic and follow-up monitoring in Gaucher disease in a non-jewish, caucasian cohort of Gaucher disease patients. PLoS One 8: e79732.
30. Patterson MC, Hendriksz CJ, Walterfang M, Sedel F, Vanier MT, et al.(2012) Recommendations for the diagnosis and management of Niemann-Pick disease type C: an update. Mol Genet Metab 106: 330–344.
31. Zhang H, Wang Y, Lin N, Yang R, Qiu W, et al.(2014) Diagnosis of Niemann-Pick disease type C with 7-ketocholesterol screening followed by NPC1/NPC2 gene mutation confirmation in Chinese patients. Orphanet J Rare Dis 9: 82.