Submitted27 October 2015 Accepted 22 February 2016 Published14 March 2016
Corresponding author Yvelise T. Morato-Conceicao, yvelisemorato@gmail.com
Academic editor Branka Horvat
Additional Information and Declarations can be found on page 11
DOI10.7717/peerj.1799
Copyright
2016 Morato-Conceicao et al.
Distributed under
Creative Commons CC-BY 4.0
OPEN ACCESS
Serum uric acid levels during leprosy
reaction episodes
Yvelise T. Morato-Conceicao1, Eduardo R. Alves-Junior2, Talita A. Arruda1,
Jose C. Lopes3and Cor J.F. Fontes1
1Department of Internal Medicine, Faculty of Medicine, Julio Muller University Hospital, Universidade Federal de Mato Grosso, Cuiaba MT, Brazil
2Department of Biomedicine, Centro Universitário UNIVAG, Varzea Grande MT, Brazil 3Department of Internal Medicine, Julio Muller University Hospital, Universidade Federal de
Mato Grosso, Cuiaba MT, Brazil
ABSTRACT
Background.Leprosy reactions are acute inflammatory episodes that occur mainly in the multibacillary forms of the disease. The reactions are classified as type 1 (reverse reaction) or type 2 (erythema nodosum leprosum). Leprosy-associated oxidative stress has been widely demonstrated. Several recent studies have shown uric acid (UA) to have antioxidative effects under pathologic conditions. The objective of this study was to assess serum levels of UA in patients with leprosy reactions, with the aim of monitoring their levels before and after treatment, compared with levels in leprosy patients without reactions.
Methods.The study included patients aged 18–69 years assisted at a leprosy treatment reference center in the Central Region of Brazil. Patients who were pregnant; were using immunosuppressant drugs or immunobiologicals; or had an autoimmune disease, human immunodeficiency virus infection, acquired immune deficiency syndrome, or tuberculosis were excluded. Upon recruitment, all individuals were clinically assessed for skin lesions and neural or systemic impairment. Some patients had already completed treatment for leprosy, while others were still undergoing treatment or had initiated treatment after being admitted. The treatment of the reactional episode was started only after the initial evaluation. Laboratory assessments were performed upon admission (baseline) and at approximately 30 and 60 days (time points 1 and 2, respectively).
Results. A total of 123 leprosy patients were recruited between June 2012 and June 2015; among them, 56, 42, and 25 presented with type 1, type 2, and no reactions, respectively. Serum UA levels were significantly reduced in patients with type 2 leprosy reactions compared with patients in the control group and remained lower in the two subsequent assessments, after initiation of anti-reaction treatments, with similar values to those recorded before the treatment.
Discussion.The decreased serum UA levels in patients with type 2 leprosy reactions might be due to the consumption of UA to neutralize the enhanced production of oxygen- and nitrogen-reactive species that occurs during type 2 reactions. The maintenance of the reduced levels in the follow-up assessments may indicate persistence of oxidative stress in the initial post-treatment stages, despite improved clinical conditions. The results of this study suggest that serum UA may play an antioxidative role during type 2 leprosy reactions.
INTRODUCTION
Despite worldwide efforts to control leprosy through early detection and adequate multidrug therapy (MDT) treatment, this disease remains a significant health problem in countries such as India, Brazil, and Indonesia, which showed the highest disease incidence in 2013 (World Health Organization, 2014). With the aim of leprosy elimination, the World Health Organization (WHO) recently put forward actions intended to decrease disability or sequelae, specifically targeting leprosy reactions (World Health Organization, 2014). Leprosy reactions are acute inflammatory episodes resulting from exacerbated host immune responses, which may occur during the natural progression of the disease as well as during and after treatment. The reactions are related to the bacillary load and are classified as type 1 (reverse reaction) or type 2 (erythema nodosum leprosum) (Scollard et al., 2006). Between 30% and 50% of leprosy patients may experience leprosy reactions (Scollard et al., 2015).
Erythema nodosum leprosum involves acute inflammation of the organs and tissues invaded by the bacilli, and the dermal vasculature and subcutaneous tissue are severely compromised (Nogueira et al., 2000). The typical clinical sign of this reaction is the sudden appearance a large number of painful erythematous nodules throughout the body. In the most serious cases, they may evolve to form vesicles, blisters, or necrotic phenomena and the patients also present systemic symptoms (Kahawita & Lockwood, 2008). The recurrence of type 2 reactions is frequent and may persist for years (Scollard et al., 2006). Laboratory observations comprise increased acute-phase proteins including C-reactive protein (CRP),α1-antitrypsin (Foss, 2003;Kahawita & Lockwood, 2008),α1-acid glycoprotein (AGP) (Gupta, Shankernarayan & Dharmalingam, 2010), andγ-globulins (Foss, 2003). Treatment of type 2 reactions consists of administration of prednisone or thalidomide. Thalidomide is the drug of choice in Brazil (Brazilian Ministry of Health, 2014).
Type 1 reactions are caused by activation of the Th1 immune response to Mycobac-terium lepraeantigens. Clinically, increased inflammation of pre-existing skin lesions is observed and, different from type 2 reactions, intense neuritis occurs, which may lead to both sensory and motor neuron impairment; systemic symptoms are rare, and visceral impairment does not occur. Treatment of type 1 reactions in Brazil includes glucocorticoids (Nery et al., 2013).
antioxidant substances may be either enzymatic, such as glutathione peroxidase, catalase, and superoxide dismutase (SOD), or nonenzymatic, such as vitamin E (tocopherol), vitamin C (ascorbic acid), reduced glutathione, uric acid (UA),β-carotene, transferrin, and ceruloplasmin (Dröge, 2002;Kohen & Nyska, 2002).
Disequilibrium between the generation and neutralization of reactive species is called oxidative stress. Oxidative stress may occur in conditions that involve chronic inflammation such as systemic hypertension, type 2 diabetes mellitus, and heart failure (Kohen & Nyska, 2002); cancer (Gaman et al., 2014); degenerative neurologic diseases (Dröge, 2002); autoimmune diseases (Dröge, 2002;Pérez et al., 2012); or infectious diseases such as malaria (Clark & Hunt, 1983; Becker et al., 2004), human immunodeficiency virus infection (Aukrust et al., 2003), dengue (Olagnier et al., 2014), and Chagas disease (Zacks, 2005).
Oxidative stress has been described in type 1 reactions (Chhabra et al., 2015) and multibacillary (MB) forms of leprosy (Bhadwat & Borade, 2000;Reddy et al., 2003;Prasad, Admath & Admath, 2007;Jyothi et al., 2008;Abdel-Hafez, Mohamed & Abd-Elghany, 2010;
Schalcher et al., 2013; Swathi & Tagore, 2015) and may be worsened by the patient’s nutritional status and by the MDT itself (Schalcher et al., 2014).
UA is the final product of purine metabolism and is produced by the oxidation of hypoxanthine and xanthine by xanthine oxidase (Ames et al., 1981). UA belongs to a damage-associated molecular pattern group of molecules recognized by the immune system as a danger signal (Ghaemi-Oskouie & Shi, 2011;Crane & Mongiardo, 2014). In most countries, UA serum levels between 2.6 and 6.0 mg/dL in women before menopause, and between 3.5 and 7.2 mg/dL in women after menopause and men, are considered normal (Desideri et al., 2014).
In parallel with its inflammatory activity, UA itself has potent antioxidant properties, reacting with the peroxyl radical and nitrogen dioxide and chelating transition metals; it is responsible for up to 60% of the antioxidant capacity of human blood, and its plasma concentration is higher than that of other antioxidants, such as vitamins C and E (Ames et al., 1981). Both high and low UA serum levels are associated with increased cardiovascular mortality and loss of renal function (Bergamini et al., 2009;Meotti et al., 2011;Kanda et al., 2015). A review article byFang et al. (2013)reports studies in which low UA serum levels were observed in patients with neurodegenerative diseases, suggesting that the antioxidant action of UA may play a role in preventing neurodegeneration.
The objective of this study was to assess UA serum levels in patients with or without leprosy reactions and to monitor their levels before and after reaction treatment.
METHODS
tuberculosis, or another mycobacteriosis were excluded. The study was approved by the Julio Muller University Hospital Ethics Committee for Human Research (number 19502). All study participants signed informed consent forms.
All patients underwent clinical skin and neurologic examinations. Blood was collected by peripheral venous puncture on three occasions: upon admission (baseline) and approximately 30 and 60 days later (time points 1 and 2, respectively). Patients were classified according to the operational classification from the WHO adopted by the Brazilian Health Ministry in 2001 (Brasil, 2001), which rates cases with up to five skin lesions and/or a single compromised nerve trunk as PB and cases with more than five skin lesions and/or more than one compromised nerve trunk as MB. Each clinical diagnosis was complemented by a slit-skin smear examination and calculation of the bacillary index (four to five collection sites). Patients with up to five skin lesions but with positive microscopy findings were classified as MB. All patients were treated with MDT according to the WHO guidelines (World Health Organization, 2014). Upon admission, some patients had already completed the MDT, while others were still undergoing treatment or had not begun treatment for leprosy. The diagnosis of reactions and neuritis was made by physicians with experience in their diagnosis and treatment and was confirmed by a second specialist physician. The treatment of the reactional episode was started only after admission into the study and after the baseline blood collection. All patients with type 1 reactions were given prednisone orally, 40–80 mg/day, for 4 weeks and then prednisone was tapered off. Type 2 reactions were treated with thalidomide (100–400 mg/day, based on clinical status) except when contraindicated; prednisone was associated in the cases of concomitant neuritis and/or necrotizing erythema nodosum (Scollard et al., 2006;Brazilian Ministry of Health, 2014). Routine laboratory tests were performed, including hemograms and assessments of lipid profile, erythrocyte sedimentation rate, hepatic enzyme, blood glucose, UA, lactic dehydrogenase, urea, and creatinine levels. CRP and AGP, which constitute classical acute-phase markers, were quantified and used as an indirect measure of oxidative stress. Automated quantification of serum UA levels using an enzymatic method was performed using a CT600i (Thermo Fisher Scientific, Schwerte, Germany) according to the manufacturer’s instructions. The glomerular filtration rate (eGFR) was estimated by the CKD-EPI (Chronic Kidney Disease Epidemiology Collaboration equation) method (Matsushita et al., 2012).
Participants were divided into three groups: those without a reaction (controls), those with type 1 reactions, and those with type 2 reactions. For data analysis, data from patients with type 1 reactions and patients with neuritis only were pooled. Statistical analysis was performed using the statistics package StataR (version 12) and the freely available program
EpidataR Analysis (version 2.1.1). The Student’st-test was used to compare means of
hypertension, hyperlipidemia, and diabetes. The nonparametric paired Wilcoxon test was used to assess differences in serum levels of UA, CRP, and AGP in post-treatment evaluations. Anαerror of 0.05 was used for all statistical analyses.
RESULTS
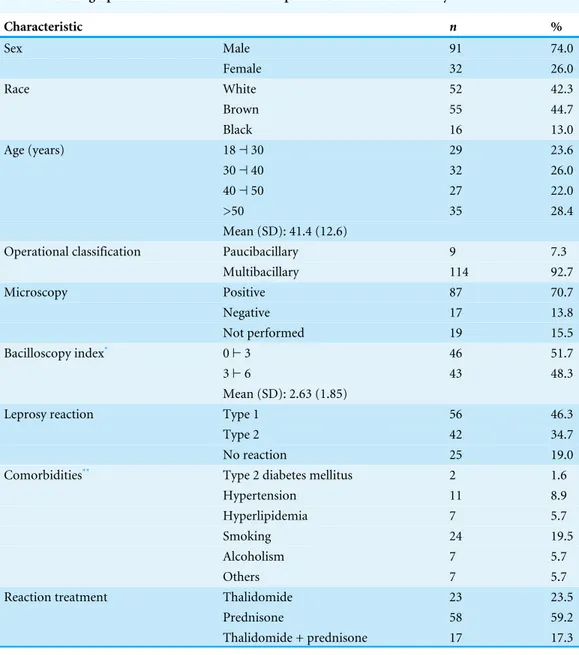
This study included 123 patients with leprosy who spontaneously sought treatment at the reference center (25.2%), who were referred for treatment of leprosy reactions (69,1%), or who were summoned for screening (5.7%) owing to being household contacts of patients with leprosy. Nine patients were classified as having PB and 114 as having MB leprosy. A slit-skin smear examination was performed for 84.6% of patients and was positive in 83.6% of cases. Most patients were men (74.0%) between 18 and 69 years of age (mean: 41.4 years). The most frequent comorbidities were systemic hypertension (8.9%) and smoking (19.5%). Seven patients presented hyperlipidemia: six in the group with type 1 reaction and one in the group with type 2 reaction. Sixty-two percent of the study participants did not present any comorbidity. Three patients had reduced eGFR (<60 mL/min/1.73m2) in the baseline, two of which had type 2 reaction and evolved with normalization of the eGFR in subsequent evaluations; the other patient had type 1 reaction and did not attend the follow-up visits.
In the initial assessment, 25 patients (20.3%) did not present leprosy reactions, 10 (8.1%) presented only neuritis, 46 (37.4%) presented type 1 reactions, and 42 (34.2%) presented type 2 reactions. Neuritis was possible, but not universal, among patients in the last two groups with leprosy reactions (Table 1). MDT was initiated upon study admission in 37 patients: 13 without reaction, 20 with type 1 reactions, and four with type 2 reactions. Forty-one patients (32.3%) had already completed leprosy treatment (28 with type 2 reactions and 13 with type 1 reactions), and 45 were still undergoing MDT: 12 without a reaction, 23 with type 1 reactions, and 10 with type 2 reactions. The disability assessment examination performed at the start of treatment showed some degree of functional impairment in 53 individuals (43.1%).
To treat the reactional episode, prednisone was used in all cases of type 1 reaction and in two young female patients with type 2 reaction. Thalidomide was the drug of choice in most of the type 2 reactions; prednisone was associated in the cases of concomitant neuritis and/or necrotizing erythema nodosum (Table 1).
The mean (SD) serum UA levels were compared between patients with and without known risk factors for oxidative stress. Significantly higher UA serum levels (p=0.006) were observed in patients with hyperlipidemia. No statistically significant associations were found for the remaining risk factors (Table 2).
Table 1 Demographic and clinical data of the 123 patients included in the study.
Characteristic n %
Sex Male 91 74.0
Female 32 26.0
Race White 52 42.3
Brown 55 44.7
Black 16 13.0
Age (years) 18⊣30 29 23.6
30⊣40 32 26.0
40⊣50 27 22.0
>50 35 28.4
Mean (SD): 41.4 (12.6)
Operational classification Paucibacillary 9 7.3
Multibacillary 114 92.7
Microscopy Positive 87 70.7
Negative 17 13.8
Not performed 19 15.5
Bacilloscopy index* 0⊢3 46 51.7
3⊢6 43 48.3
Mean (SD): 2.63 (1.85)
Leprosy reaction Type 1 56 46.3
Type 2 42 34.7
No reaction 25 19.0
Comorbidities** Type 2 diabetes mellitus 2 1.6
Hypertension 11 8.9
Hyperlipidemia 7 5.7
Smoking 24 19.5
Alcoholism 7 5.7
Others 7 5.7
Reaction treatment Thalidomide 23 23.5
Prednisone 58 59.2
Thalidomide + prednisone 17 17.3
Notes.
*Not available for 15 patients with positive microscopy. **Some patients presented more than one comorbidity.
Table 2 Univariate analysis of serum uric acid levels before treatment of 114 patients, according to risk factors for oxidative stress.
Risk factors Uric acid (mg/dL) p*
Mean SD
Age (years) 18⊣30 4.04 0.94 0.149**
30⊣40 4.63 1.16
40⊣50 4.95 1.63
>50 4.54 1.86
Smoking Yes 4.69 1.26 0.311
No 4.50 1.53
Alcoholism Yes 4.66 1.54 0.415
No 4.53 1.48
Hyperlipidemia Yes 6.88 2.48 0.006
No 4.43 1.33
Hypertension Yes 4.80 1.86 0.825
No 4.51 1.45
Type 2 diabetes mellitus Yes 4.15 1.20 0.658
No 4.54 1.48
Notes.
*Mann–Whitney test. **Kruskal–Wallis test.
Table 3 Serum levels of uric acid at initial assessment (before treatment) of patients with and without leprosy reactions.
Patient group n Uric acid (mg/dL) p*
Mean SD
Type 1 reaction 75 4.75 1.66 0.857
Control 4.82 1.43
Type 2 reaction 64 4.08 1.14 0.023a
Control 4.82 1.43
Type 2 reaction 89 4.08 1.14 0.033b
Type 1 reaction 4.75 1.66
Notes.
*Student’st-test.
ap=0.046 after Bonferroni correction.
bp=0.112 after exclusion of hyperlipidemic patients (n=84; the uric acid of one patient was not evaluated).
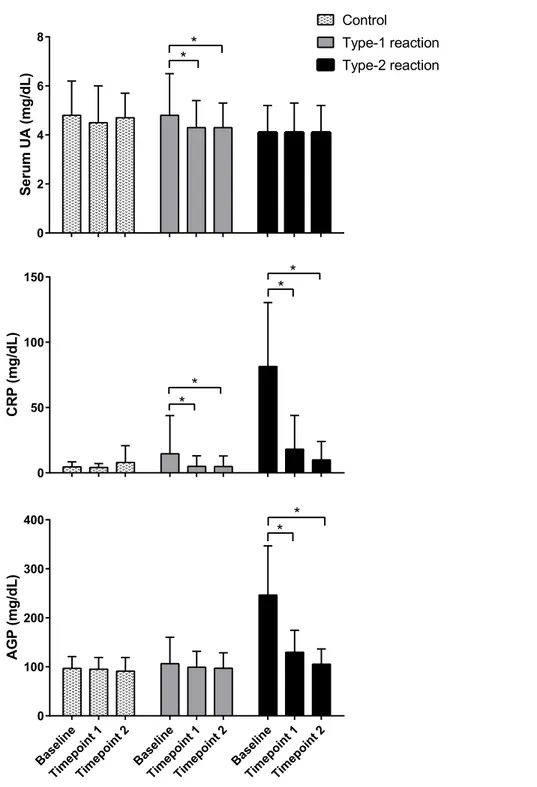
after 30–60 days (time point 1) and 60–90 days (time point 2) of prednisone treatment, respectively, compared with pre-treatment levels. Serum levels of AGP remained within the normal range and did not change significantly during post-treatment follow-up assessments (Fig. 1).
DISCUSSION
In the present study, the mean serum UA levels were lower in leprosy patients with type 2 reactions than in patients without reactions. However, no statistically significant differences were observed between patients with type 1 reactions and patients without reactions. To the best of our knowledge, this is the first report of changes in UA levels as a result of leprosy reactions. The significantly lower UA levels in patients with type 2 leprosy reactions suggest increased consumption of UA to neutralize the increased production of reactive species that occurs during type 2 reactions (Foss, 1997). Conversely, the lack of association between serum UA and type 1 reactions may be explained by a lower production of reactive species, which may be too low to distinguish patients with type 1 reactions from those without reactions. Another hypothesis would be the higher frequency of hyperlipidemic patients in the group with type 1 reaction, which may be associated with hyperuricemia (Desideri et al., 2014;Wei et al., 2015) and which could minimize the association between serum UA level and type 1 reaction.
The observation that the mean serum UA levels remained relatively consistent before and after treatment in patients with type 2 reactions may suggest the persistence of oxidative stress, despite clinical improvement, and decreased serum levels of acute-phase proteins such as CRP and AGP.Chhabra et al. (2015)andPrabhakar et al. (2013)also described the persistence of oxidative stress markers after clinical resolution in leprosy patients treated for type 1 reactions and after completing MDT, respectively.
A significant decrease in serum UA levels, attributed to its possible antioxidant effect, was described in patients with pemphigus vulgaris, particularly in those with mucosal impairment (Yousefi et al., 2011), lichen planus (Chakraborti et al., 2014), and neurodegenerative diseases (Keizman et al., 2009;Fang et al., 2013). The hypothesis that serum UA is consumed during type 2 reactions is consistent with previous findings regarding the profile of enzymatic antioxidants in patients with polar forms of leprosy; i.e., the antioxidant level decreases gradually from the tuberculoid to the virchowian pole. The authors suggested that a high bacillary load might lead to increased production of free radicals, which would lead to consumption of antioxidant molecules (Jyothi et al., 2008).
was the only drug used by three patients in this study, one in the control group and two in the group of patients with type 1 leprosy reactions.
In most cases, a correlation was observed between decreased serum UA levels after treatment in patients with type 1 reactions and the duration of the use of the maximum dose of prednisone (40–80 mg/day), when patients presented clinical improvement and apparent control of reaction-associated inflammation, as shown by decreased CRP serum levels. Based on these considerations, increased or stabilized UA levels would be expected. This observation could be explained by increased renal excretion of UA due to the action of the glucocorticoid. A significant decrease in serum UA levels was observed in patients with heart failure and hyperuricemia who received 30–60 mg/day prednisone for 5–28 days (Liu et al., 2013;Meng et al., 2015). This decrease was explained by the enhanced renal response to endogenous natriuretic peptides (NPs), through the upregulation of the expression of NP receptor A in the intramedullary renal collecting duct, with the consequent induction of potent diuresis, in rats with chronic excessive cardiac insufficiency (Liu et al., 2011). NPs are part of a family of hormones usually produced in the vasculature, myocardium, kidneys, adrenal glands, brain, and lungs. They play an important role in the maintenance of cardiovascular homeostasis (Simões e Silva, Pinheiro & Santos, 2008). Three genetically distinct but structurally related NPs are known: atrial NP, type B NP, and type C NP. ANP seems to be responsible for the control of normal cardiorenal activity, whereas increased secretion of the other two hormones occurs only under pathological conditions (Volpe, 2014).
Some limitations of this study should be highlighted, such as the low number of patients included and the short follow-up time of the patients, which is required to understand the actual dynamics of serum UA levels. A selection bias was possible, as the patients were recruited from a reference center where demands concerning leprosy reactions are more frequent and there are relatively fewer control patients without reactions. Not measuring the urinary concentration of UA of the patients with the objective of removing hypersecretory patients also represents another limitation of this study. Information on water intake, purine contents in diet, and exercise levels, which was not obtained from the patients, may also represent a limitation. However, we believe that these factors did not influence the results of this study, since the patients were homogenous in terms of cultural background and socioeconomic level. In addition, during the reaction episodes, physical activity tends to be very restricted due to neural pain and systemic symptoms.
ADDITIONAL INFORMATION AND DECLARATIONS
Funding
Financial support provided by PRONEX hanseníase, FAPEMAT/CNPq #0092009. The funders had no role in study design, data collection and analysis, decision to publish, or preparation of the manuscript.
Grant Disclosures
The following grant information was disclosed by the authors: PRONEX hanseníase, FAPEMAT/CNPq: #0092009.
Competing Interests
The authors declare that there are no competing interests.
Author Contributions
• Yvelise T. Morato-Conceicao conceived and designed the experiments, performed the experiments, analyzed the data, wrote the paper, prepared figures and/or tables, reviewed drafts of the paper.
• Eduardo R. Alves-Junior performed the experiments, contributed reagents/materials/-analysis tools, prepared figures and/or tables, reviewed drafts of the paper.
• Talita A. Arruda performed the experiments, wrote the paper, reviewed drafts of the paper.
• Jose C. Lopes performed the experiments, reviewed drafts of the paper.
• Cor J.F. Fontes conceived and designed the experiments, analyzed the data, contributed reagents/materials/analysis tools, wrote the paper, prepared figures and/or tables, reviewed drafts of the paper.
Human Ethics
The following information was supplied relating to ethical approvals (i.e., approving body and any reference numbers):
Julio Muller University Hospital Ethics Committee for Human Research #19502.
Data Availability
The following information was supplied regarding data availability: The raw data has been supplied asSupplemental Information.
Supplemental Information
Supplemental information for this article can be found online athttp://dx.doi.org/10.7717/ peerj.1799#supplemental-information.
REFERENCES
Abdel-Hafez HZ, Mohamed EEM, Abd-Elghany AA. 2010.Tissue and blood superoxide dismutase activity and malondialdehyde level in leprosy.Journal of the European Academy of Dermatology and Venereology24(6):704–708
DOI 10.1111/j.1468-3083.2009.03496.x.
Ames BN, Cathcart R, Schwiers E, Rochstein P. 1981.Uric acid provides an antioxidant defense in humans against oxidant- and radical-caused aging and cancer: a hypoth-esis.Proceedings of the National Academy of Sciences of the United States of America
78(11):6858–6862DOI 10.1073/pnas.78.11.6858.
Aukrust P, Müller F, Svardal AM, Ueland T, Berge RK, Froland SS. 2003.Disturbed glutathione metabolism and decreased antioxidant levels in human immunodefi-ciency virus-infected patients during highly active antiretroviral therapy–potential immunomodulatory effects of antioxidants.The Journal of Infectious Diseases
188:232–238DOI 10.1086/376459.
Becker K, Tilley L, Vennerstrom JL, Roberts D, Rogerson S, Ginsburg H. 2004. Oxida-tive stress in malaria parasite-infected erythrocytes: host-parasite interactions. Inter-national Journal for Parasitology34(2):163–189DOI 10.1016/j.ijpara.2003.09.011. Bergamini C, Cicoira M, Rossi A, Vassanelli C. 2009.Oxidative stress and
hyperuricemia: pathophysiology, clinical relevance, and therapeutic implications in chronic heart failure.European Journal of Heart Failure11:444–452
DOI 10.1093/eurjhf/hfp042.
Bhadwat VR, Borade VB. 2000.Increased lipid peroxidation in lepromatous leprosy.
Indian Journal of Dermatology, Venereology and Leprology 66:121–125.
Brasil. 2001. Ministério da Saúde. Secretaria de Políticas de Saúde. Departamento de Atenção Básica. Moreira MB, Costa MM. In:Controle da hanseníase na atenção básica: guia prático para profissionais da equipe de saúde da família. Brasília: Min-istério da Saúde.Available atbvsms.saude.gov.br/ bvs/ publicacoes/ hanseniase_atencao. pdf (accessed 22 June 2015).
Brazilian Ministry of Health. 2014. Ministério da Saúde. Secretaria de vigilância em Saúde. Tratamento das reações leprosas. In: Silva Junior JB, Duarte E, eds.Guia de Vigilância em Saúde. 359–362.Available athttp:// portalsaude.saude.gov.br/ images/ pdf/ 2014/ novembro/ 27/ guia-vigilancia-saude-linkado-27-11-14.pdf (accessed 11 May 2015).
Chakraborti G, Biswas R, Chakraborti S, Sen PK. 2014.Altered serum uric acid level in lichen planus patients.Indian Journal of Dermatology59(6):558–561 DOI 10.4103/0019-5154.143510.
Chhabra N, Bhattacharya SN, Singal A, Ahmed RS, Verma P. 2015.Profile of oxidative stress in response to treatment for type 1 leprosy reaction.Leprosy Review86:80–88. Clark IA, Hunt NH. 1983.Evidence for reactive oxygen intermediates causing hemolysis
and parasite death in malaria.Infection and Immunity39(1):1–6.
Crane JK, Mongiardo KM. 2014.Pro-inflammatory effects of uric acid in the gastroin-testinal tract.Immunological Investigations43(3):255–266
Desideri G, Castaldo G, Lombardi A, Mussap M, Testa A, Pontremoli R, Punzi L, Borghi C. 2014.Is it time to revise the normal range of serum uric acid levels?
European Review for Medical and Pharmacological Sciences18:1295–1306.
Dröge W. 2002.Free radicals in the physiological control of cell function.Physiological Reviews82:47–95DOI 10.1152/physrev.00018.2001.
Fang P, Li X, Luo JJ, Wang H, Yang X. 2013.A double-edged sword: uric acid and neurological disorders.Brain Disorders & Therapy2(2):109–114.
Foss NT. 1997. Imunologia (parte II). In: Talhari S, Neves RG, eds.Hanseníase. Manaus: Gráfica Tropical, 97–102.
Foss NT. 2003.Reactional episodes in leprosy.Medicina Ribeirão Preto36:453–459 DOI 10.11606/issn.2176-7262.v36i2/4p453-459.
Gaman AM, Buga AM, Gaman MA, Popa-Wagner A. 2014.The role of oxidative stress and the effects of antioxidants on the incidence of infectious complications chronic lymphocytic leukemia.Oxidative Medicine and Cellular Longevity 2014:Article 158135DOI 10.1155/2014/158135.
Ghaemi-Oskouie F, Shi Y. 2011.The role of uric acid as an endogenous danger signal in immunity and inflammation.Current Rheumatology Reports13:160–166 DOI 10.1007/s11926-011-0162-1.
Gupta N, Shankernarayan NP, Dharmalingam K. 2010.α1-Acid glycoprotein as a putative biomarker for monitoring the development of the type II reactional stage of leprosy.Journal of Medical Microbiology59:400–407DOI 10.1099/jmm.0.016394-0. Iso T, Kurabayashi M. 2015.Extremely low levels of serum uric acid are
associ-ated with endothelial dysfunction in humans.Circulation Journal79:978–980 DOI 10.1253/circj.CJ-15-0232.
Jyothi P, Riyaz N, Nandakumar G, Binitha MP. 2008.A study of oxidative stress in paucibacillary and multibacillary leprosy.Indian Journal of Dermatology, Venereology and Leprology 74(1):80DOI 10.4103/0378-6323.38428.
Kahawita IP, Lockwood DN. 2008.Towards understanding the pathology of erythema nodosum leprosy.Transactions of the Royal Society of Tropical Medicine and Hygiene
102:329–337DOI 10.1016/j.trstmh.2008.01.004.
Kanda E, Muneyuki T, Kanno Y, Suwa K, Nakajima K. 2015.Uric acid level has a U-Shaped association with loss of kidney function in health people: a prospective cohort study.PLoS ONE10(2):e0118031DOI 10.1371/journal.pone.0118031. Keizman D, Ish-Shalom M, Berliner S, Maimom N, Vered Y, Artamonov I, Tsehori
J, Nefussy B, Drory VE. 2009.Low uric acid levels in serum of patients with ALS: further evidence for oxidative stress?Journal of the Neurological Sciences285(1– 2):95–99DOI 10.1016/j.jns.2009.06.002.
Kohen R, Nyska A. 2002.Oxidation of biological systems: oxidative stress phenomena, antioxidants, redox reactions, and methods for their quantification.Toxicologic Pathology30(6):620–650DOI 10.1080/01926230290166724.
receptor—A expression in the renal inner medullary collecting duct in decompen-sated hearth failure.The Journal of Pharmacology and Experimental Therapeutics
339(1):203–209DOI 10.1124/jpet.111.184796.
Liu C, Zhao Q, Zhen Y, Gao Y, Tian L, Wang L, Ji L, Liu G, Ji Z, Liu K. 2013.Prednisone in uric acid lowering in symptomatic heart failure patients with hyperuricemia (PUSH-PATH) study.Canadian Journal of Cardiology29:1048–1054
DOI 10.1016/j.cjca.2012.11.008.
Martín NE, García-Nieto V. 2011.Hypouricemia and tubular transport of uric acid.
Nefrologia31(1):44–50DOI 10.3265/Nefrologia.pre2010.Oct.10588.
Matsushita K, Mahmoodi BK, Woodward M, Emberson JR, Jafar TH, Jee SH, Polk-inghorne KR, Shankar A, Smith DH, Tonelli M, Warnock DG, Wen CP, Coresh J, Gansevoort RT, Hemmelgarn BR, Levey AS. 2012.Comparison of risk prediction using CKD-EPI equation and the MDRD study equation for estimated glomerular filtration rate.The Journal of the American Medical Association307(18):1941–1951 DOI 10.1001/jama.2012.3954.
McDonagh EM, Thorn CF, Callaghan JT, Altman RB, Klein TE. 2014.PharmGKB summary: uric acid-lowering drugs pathway, pharmacodynamics.Pharmacogenetics and Genomics24(9):464–476DOI 10.1097/FPC.0000000000000058.
Meng H, Liu G, Zhai J, Zhen Y, Zhao Q, Zheng M, Ma G, Wang L, Tian L, Ji L, Duan L, Li L, Liu K, Liu C. 2015.Prednisone in uric acid lowering in symptomatic heart failure patients with hyperuricemia—The PUSH-PATH3 study.The Journal of Rheumatology42:866–869 DOI 10.3899/jrheum.141037.
Meotti FC, Jameson GNL, Turner R, Harwood DT, Stockwell S, Rees MD, Thomas SR, Kettle AJ. 2011.Urate as a physiological substrate for myeloperoxidase: impli-cations for hyperuricemia and inflammation.The Journal of Biological Chemistry
286:12901–12911DOI 10.1074/jbc.M110.172460.
Nery JA, Machado AM, Bernardes-Filho F, Oliveira SS, Quintanilha J, Sales AM. 2013.Understanding type 1 reaction state for early diagnosis and treatment: a way to avoid disability in leprosy.Anais Brasileiros de Dermatologia88:787–792 DOI 10.1590/abd1806-4841.20132004.
Nogueira MES, Moreno FRV, Silva EA, Arruda MSP. 2000. Imunologia. In: Opromolla DVA, ed.Noções de Hansenologia. Bauru: Centro de estudos ‘‘Dr. Reynaldo
Quagliato’’, 27–42.Available athttp:// hansen.bv.ilsl.br/ textoc/ livros/ Opromolla_ Diltor_nocoes/ PDF/ imunol.pdf (accessed 10 May 2015).
Olagnier D, Peri S, Steel C, Montfoort NV, Chiang C, Beljanski V, Slifker M, He Z, Nichols CN, Lin R, Balachandran S, Hiscott J. 2014.Cellular oxidative stress response controls the antiviral and apoptotic programs in dengue virus-infected dendritic cells.PLoS Pathog10(12):e1004566DOI 10.1371/journal.ppat.1004566. Pérez YG, Pérez LCG, Netto RCM, Lima DSN, Lima ES. 2012.Malondialdehyde and
sulfhydryl groups as biomarkers of oxidative stress in patients with systemic lupus erythematosus.Revista Brasileira de Reumatologia52(4):656–660.
Prasad CVB, Admath MVK, Admath GBK. 2007.Erythrocyte superoxide dismutase, catalase activities and hydrogen peroxide induced lipid peroxidation in leprosy.
Leprosy Review78(4):391–397.
Reddy YN, Murthy SV, Krishna DR, Prabhakar MC. 2003.Oxidative stress and anti-oxidant status in leprosy patients.Indian Journal of Leprosy 75(4):307–316. Schalcher TR, Borges RS, Coleman MD, Junior JB, Salgado CG, Vieira JL, Romão
PR, Oliveira FR, Monteiro MC. 2014.Clinical oxidative stress during leprosy multidrug therapy: impact of dapsone oxidation.PLoS ONE9(1):e85712 DOI 10.1371/journal.pone.0085712.
Schalcher TR, Vieira JLF, Salgado CG, Borges RS, Monteiro MC. 2013.Antioxidant fac-tors, nitric oxide levels, and cellular damage in leprosy patients.Revista da Sociedade Brasileira de Medicina Tropical46(5):645–649DOI 10.1590/0037-8682-1506-2013. Scollard DM, Adams LB, Gillis TP, Krahenbuhl JL, Truman RW, Willians DL. 2006.
The continuing challenges of leprosy.Clinical Microbiology Reviews19(2):338–381 DOI 10.1128/CMR.19.2.338-381.2006.
Scollard DM, Martelli CMT, Stefani MMA, Maroja MF, Villahermosa L, Pardillo F, Tamang KB. 2015.Risk factors for leprosy reactions in three endemic countries.
American Journal of Tropical Medicine and Hygiene92(1):108–114 DOI 10.4269/ajtmh.13-0221.
Simões e Silva AC, Pinheiro SVB, Santos RAS. 2008.Peptide and interaction heart-kidney.Revista Brasileira de Hipertensão15(3):134–143.
Suzuki K, Akama T, Kawashima A, Yoshihara A, Yotsu RR, Ishii N. 2012.Current status of leprosy: epidemiology, basic science and clinical perspectives.Jornal of Dermatology39(2):121–129 DOI 10.1111/j.1346-8138.2011.01370.x.
Swathi M, Tagore R. 2015.Study of oxidative stress in different forms of leprosy.Indian Journal of Dermatology 60(3):321 DOI 10.4103/0019-5154.156426.
Volpe M. 2014.Natriuretic peptides and cardio-renal disease.International Journal of Cardiology 176:630–639DOI 10.1016/j.ijcard.2014.08.032.
Yousefi M, Rahimi H, Barikbin B, Toossi P, Lofti S, Hedayati M, Younespour S. 2011. Uric acid: a new antioxidant in patients with pemphigus vulgaris.Indian Journal of Dermatology56(3):278–281 DOI 10.4103/0019-5154.82480.
Wei CY, Sun CC, Wei JC, Tai HC, Sun CA, Chung CF, Chou YC, Lin PL, Yang T. 2015. Association between hyperuricemia and metabolic syndrome: an epidemiolog-ical study of a labor force population in Taiwan.BioMed Research International
2015(2015):Article 369179DOI 10.1155/2015/369179.
World Health Organization. 2014.Global leprosy update, 2013; reducing disease
burden.Weekly Epidemiological Record36(89):389–400.Available athttp:// www.who. int/ wer/ 2014/ wer8936.pdf (accessed 10 June 2015).