EphA4 Regulates the Balance between
Self-Renewal and Differentiation of Radial Glial
Cells and Intermediate Neuronal Precursors
in Cooperation with FGF Signaling
Qingfa Chen1, Daiki Arai1, Kazuki Kawakami1, Takahiro Sawada1, Xuefeng Jing1, Masayasu Miyajima2, Syu-ichi Hirai3, Kazushige Sakaguchi1, Kenryo Furushima1*
1Department of Molecular Cell Biology and Molecular Medicine, Institute of Advanced Medicine, Wakayama Medical University, 811–1 Kimiidera, Wakayama, 641–8509, Japan,2Laboratory Animal Center,
Wakayama Medical University, 811–1 Kimiidera, Wakayama, 641–8509, Japan,3Department of Biology,
Wakayama Medical University, 580 Mikazura, Wakayama, 641–0011, Japan
Abstract
In mouse cerebral corticogenesis, neurons are generated from radial glial cells (RGCs) or from their immediate progeny, intermediate neuronal precursors (INPs). The balance be-tween self-renewal of these neuronal precursors and specification of cell fate is critical for proper cortical development, but the signaling mechanisms that regulate this progression are poorly understood. EphA4, a member of the receptor tyrosine kinase superfamily, is ex-pressed in RGCs during embryogenesis. To illuminate the function of EphA4 in RGC cell fate determination during early corticogenesis, we deletedEpha4in cortical cells at E11.5 or E13.5. Loss of EphA4 at both stages led to precocious in vivo RGC differentiation toward neurogenesis. Cortical cells isolated at E14.5 and E15.5 from both deletion mutants showed reduced capacity for neurosphere formation with greater differentiation toward neurons.
They also exhibited lower phosphorylation of ERK and FRS2αin the presence of FGF. The
size of the cerebral cortex at P0 was smaller than that of controls whenEpha4was deleted at E11.5 but not when it was deleted at E13.5, although the cortical layers were formed nor-mally in both mutants. The number of PAX6-positive RGCs decreased at later developmen-tal stages only in the E11.5Epha4deletion mutant. These results suggest that EphA4, in cooperation with an FGF signal, contributes to the maintenance of RGC self-renewal and repression of RGC differentiation through the neuronal lineage. This function of EphA4 is especially critical and uncompensated in early stages of corticogenesis, and thus deletion at E11.5 reduces the size of the neonatal cortex.
OPEN ACCESS
Citation:Chen Q, Arai D, Kawakami K, Sawada T, Jing X, Miyajima M, et al. (2015) EphA4 Regulates the Balance between Self-Renewal and
Differentiation of Radial Glial Cells and Intermediate Neuronal Precursors in Cooperation with FGF Signaling. PLoS ONE 10(5): e0126942. doi:10.1371/ journal.pone.0126942
Academic Editor:Robert Blum, University of Wurzburg, GERMANY
Received:July 23, 2014
Accepted:April 9, 2015
Published:May 15, 2015
Copyright:© 2015 Chen et al. This is an open access article distributed under the terms of the
Creative Commons Attribution License, which permits unrestricted use, distribution, and reproduction in any medium, provided the original author and source are credited.
Data Availability Statement:All relevant data are within the paper.
Funding:This work was supported by a Research Grant on Priority Areas from Wakayama Medical University. The funders had no role in study design, data collection and analysis, decision to publish, or preparation of the manuscript.
Introduction
During corticogenesis, radial glial cells (RGCs) reproduce in the apical ventricular zone (VZ) and differentiate into intermediate neuronal precursors (INPs) during early stages, and then
into several types of neuronal cells at later stages of embryonic development [1,2]. INPs
gener-ated from RGCs divide once or twice in the basal VZ or in the subventricular zone (SVZ) to generate more INPs (self-renewal) or post-mitotic neurons [3]. Neuronal cells generated from RGCs or INPs migrate to the cortical plate in an inside-out laminar pattern to form the six
cor-tical layers [4,5]. The neurons in deeper cortical layers (5/6) are generated directly from RGCs
or indirectly via INPs, whereas the neurons in the upper cortical layers (2/3 to 4) are generated exclusively from INPs [6]. As a result, mammalian cortex generates six layers by segregating specific neuronal cells. RGCs, INPs, and neuronal cells in each layer can be identified and
traced during corticogenesis by the sequential expression of specific transcription factors [7–9].
Intriguingly, early loss of INPs leads to a decrease in cortical surface expansion and thickness, with a reduction in neuronal number in all cortical layers [6], suggesting that INP progeny con-tribute to the correct morphogenesis of each cortical layer.
Fibroblast growth factors (FGFs) promote RGC proliferation via phosphorylation of FRS2α
and ERK [10–13], but it is unclear how they exert their effects on RGCs and neuronal
progeni-tor cellsin vivoand how the FGF signal induces the RGC-to-neuronal cell transition.
Simulta-neous deletion of three FGF receptor genes (FGFR1,FGFR2, andFGFR3) during cortical
neurogenesis depletes RGCs due to precocious neurogenesis [14,15], possibly mediated by
changes in Notch signaling downstream of the FGF signal [15].
EphA4 is a member of the Eph receptor tyrosine kinase family and is activated by all
members of the ephrin-A ligand family and most members of the ephrin-B family [16,17]. We
previously demonstrated that direct binding of EphA4 to FGF receptors (FGFRs) leads to
acti-vation of FRS2αand MAPK [18], suggesting possible regulation of FGF signal transduction in
RGCs by EphA4. EphA4 is expressed in the neural ectoderm at embryonic day 8 (E8.0) and then in various cell types throughout the cortex during subsequent stages of neurodevelopment [19,20]. EphA4 is a well-known neuronal repellant that regulates the formation of the axon tract and cortical network as well as radial migration of cortical neurons in the mouse cortex [21–24]. EphA4 maintains neural stem cells in the adult cortex andEpha4null mice exhibit a
thinner cortex than wild-type mice and reduced proliferation of cortical RGCs [25,26].
How-ever, little is known of the cell- and stage-specific function of EphA4 in corticogenesis. In par-ticular, it is unclear whether EphA4 contributes to proliferation and/or differentiation of neural stem/progenitor cells.
Here we studied the stage-specific functions of EphA4 in corticogenesis by creating two
con-ditionalEpha4knockout mice in which the gene was deleted at different developmental stages.
Materials and Methods
Mice
committee (permit numbers: 23–30, 23–34, and 23–49). All surgery was performed under sodi-um pentobarbital anesthesia and all efforts were made to minimize animal suffering.
Immunohistochemistry and Nissl staining
Whole mouse heads or isolated brains retrieved between E10.5 and P0 were fixed overnight in 4% paraformaldehyde (PFA) at 4°C and then embedded in paraffin wax. Paraffin sections (6-μm-thick) were de-waxed, hydrated, heated at 121°C for 1 min in 10 mM sodium citrate (pH 6.0) for antigen retrieval, and then immunohistochemically stained using a standard protocol. Briefly, sections were pretreated with 10% goat serum in Tris-buffered saline and Tween 20 (pH 8.0) at room temperature (RT) for 30 min, and incubated with a primary antibody at 4°C overnight. The primary antibodies used in this study were as follows: rabbit anti-EphA4 (Cat. #sc-921, 1:300, Santa Cruz), mouse anti-pHH3 (anti-phosphorylated histone H3, Cat.
#ab14955, 1:600, Abcam), rabbit anti-Class IIIβ-tubulin (TUBB3) (Cat. #MRB-435P, 1:1000,
Covance), mouse anti-TUBB3 (Cat. #MMS-435P, 1:1000, Covance), rabbit anti-TBR2 (Cat. #AB2283, 1:1000, Millipore; Cat.#ab23345, 1:500, Abcam), rabbit anti-PAX6 (Cat. #PRB-278P, 1:600, Covance), rabbit anti-Ki67 (Cat. #ab16667, 1:200, Abcam), rabbit anti-CUX1 (Cat. #sc-13024, 1:100, Santa Cruz), rat CTIP2 (Cat. #ab18465, 1:1000, Abcam), and mouse anti-BrdU (Cat. #MI-11-3, 1:1000, MBL). After a wash in PBS, immunolabeled sections were incu-bated at RT for 1 h with secondary antibodies (Vector Labs) conjugated to horseradish
peroxi-dase for 3,3’-diaminobenzidine staining or to Alexa Fluor 488 and Alexa Fluor 568 (Molecular
Probes) for immunofluorescence staining. Sections were then washed in PBS, counterstained
with 4’,6’-diamino-2-phenylindole (DAPI; Molecular Probes), and mounted with Gel/Mount
(DAKO). Staining was detected with a Keyence BZ-9000 microscope or a Zeiss LSM5 Pascal confocal microscope.
For Nissl staining, whole mouse heads or isolated brains were fixed as described above, and paraffin sections (10-μm-thick) were stained with 0.1% cresyl violet [30]. Staining was detected with a Keyence BZ-9000 microscope.
Histochemical and immunohistochemical quantification
Coronal brain sections were prepared as described to measure cortical thickness, layer mor-phology, and the location and number of specific cell populations (RGCs, INPs, and their prog-eny) at three locations along the anterior-posterior axis: anterior, the section where the corpus callosum crosses the hemispheres and the hippocampal commissure appears; middle, the sec-tion that has both the medial-lateral habenular and ventral-lateral thalamic nuclei; posterior, the section just posterior to the ventral-lateral thalamic nucleus. Values at each location are the
averages of three sections from 3–5 control and mutant littermate pairs (9–15 sections). The
thickness of the P0 cortex was measured midway between the pallial–subpallial ventricular
zone boundary and the dorsalmost bend of the cortical VZ at the interhemispheric fissure
(de-marcated by the bars inFig 1). The thickness of the proliferative zone was also determined at
the same position. The thicknesses of the proliferating layer (PAX6 immunoreactive) and the neuronal layer (TUBB3 immunoreactive) were determined at the same anterior coronal posi-tion. The numbers of PAX6-expressing (+) cells, TBR2+ cells, pHH3+ cells, BrdU-labeled (BrdU+) cells, BrdU+Ki67+ cells, BrdU+TUBB3+ cells, BrdU+CUX1+ cells, and BrdU+CTIP2
+ cells were counted within 100–300-μm-wide rectangular regions. At P0 and E17.5, the
rect-angular regions correspond to the mid-area of the anterior somatosensory cortex and, from
E13.5 to E15.5, the midway of the regions correspond to the midway between the pallial–
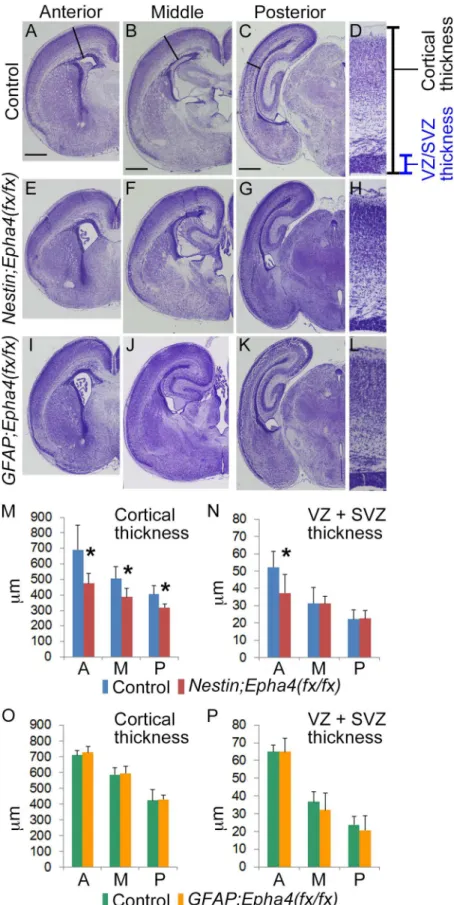
Fig 1. Effect of stage-dependent EphA4 deletion on the cerebral cortex at P0. A–L, Cresyl violet stain of coronal brain sections from control (A–D),Nestin;Epha4
fx/fx
(E–H), andGFAP;Epha4
fx/fx
PAX6+ or TBR2+ were counted in a 300-μm-wide radial segment of the entire cortical
thick-ness and normalized to 100μm.
BrdU and TUNEL labeling
Pregnant dams received an intraperitoneal injection of BrdU, 50 mg/kg body weight. For cell cycle exit assays, pregnant females carrying E13.5 or E14.5 embryos were injected with BrdU and the embryos were collected at E14.5 and E15.5, respectively, and processed for immunohis-tochemistry. For birthdating assays, pregnant females carrying E11.5, E13.5, E15.5, or E17.5 embryos were injected with BrdU and embryos were collected at P0. Sections were denatured in 1.5 N HCl for 30 min at 37°C, followed by neutralization in 0.1 M sodium borate (pH 8.5) before incubation with the primary antibodies. The cortical thickness was divided into 10 par-allel subregions (bins) and the number of BrdU+ cells was counted in each bin from three sec-tions per mouse. At least three mice were examined for each genotype. TUNEL staining was
performed following the manufacturer’s protocol (Takara). Cells with a condensed shape and
dark black staining were regarded as apoptotic and were easily distinguished from blood cells, which showed no shrinkage and/or were stained brown only in the cytoplasm following the TUNEL protocol.
Neurosphere cultures
Neurospheres were derived from single cell suspensions obtained by trypsin digestion of E14.5
cortices. Cells were plated at clonal density (<1 × 10⁵cells/ml) in basal serum-free media
(DMEM/F12 supplemented with B27, 25 mM HEPES, 0.6% glucose, and 1% pen/strep) con-taining FGF2 (20 ng/ml) and EGF (20 ng/ml), maintained at 37°C, and supplemented with fresh media every other day. For immunohistochemical analysis of neurosphere differentiation
using anti-TBR2 and-TUBB3 antibodies, primary neurospheres grown for 4–5 days were
tryp-sinized and single cells were plated and cultured in the same medium for 24 h at a density of
1 × 10⁵cells/well in 8-well chamber slides coated with 0.01% PLL and 200μg/ml fibronectin.
The cells were fixed with 4% PFA for 30 min at RT and treated with 0.01% Triton X-100/PBS. The cells were blocked with 1% goat serum in PBS at RT for 30 min and incubated with TBR2 and TUBB3 antibodies at 4°C overnight. The cells were incubated at RT for 1 h with Alexa Flour 568 secondary antibody and counterstained with DAPI and mounted with Gel/Mount. For neurosphere formation, following the third passage, single cells (dissociated by trypsin treatment) were replated and cultured in 96-well plates at clonal density in basal serum-free media (DMEM/F12 supplemented with B27, 0.6% glucose, and 1% pen/strep) containing
vehi-cle, FGF2 (20 ng/ml) alone, clustered ephrinA1-Fc (0.5μg/ml) alone, or FGF2 plus clustered
ephrinA1-Fc. Ephrin-A1 fused to human IgG-Fc was purchased from Sigma-Aldrich. Before
application, 5μg of ephrin-A1-Fc was incubated with 12μg of rabbit anti-human IgG-Fc
are the corresponding sections of these mice along the antero-posterior axis of the telencephalon. The Nestin;Epha4fx/fx
cortex appears smaller than the control cortex, while theGFAP;Epha4fx/fx
cortex is almost the same size as the control cortex.M–P,Quantification of cortical thickness (M, O) and proliferating zone (VZ+SVZ) width (N, P) inNestin;Epha4fx/fx(M, N) andGFAP;Epha4fx/fx(O, P) mice. Solid lines in control animals (A to C) and corresponding lines in mutants (E–G, I–K) indicate the antero-posterior location where
these thicknesses were measured. Enlargements of the measured areas in the anterior part (A, E, and I) are shown in the rightmost column (D, H, and L, respectively). Cortical thickness was reduced in all brain sections fromNestin;Epha4fx/fxmice, and the proliferating zone width was thinner only in anterior sections. However, inGFAP;Epha4fx/fx
mice, cortical thickness and proliferating zone width were similar to controls. A, anterior; M, middle; P, posterior. N = 5 for each measurement, (*) P<0.05. Error bars represent SD. Scale bar, 500μm.
(Jackson ImmunoResearch) in 1 ml of PBS at 4°C for at least 1 h to produce clustered ephrin-A1 [18]. The number of tertiary neurospheres was determined under light microscopy.
Western blotting
Telencephalic cortices were dissected from E10.5 to P0 mouse brains. For FGF2 stimulation ex-periments at E15.5, cells from isolated telencephalic cortices were mechanically dissociated and incubated in DMEM supplemented with 0.6% glucose, 25 mM HEPES, and 1%
penicillin-streptomycin (pen/strep) for 60 min at 37°C under a 5% CO2atmosphere. The cell suspension
was then divided into two tubes, one control and the other incubated with FGF2 (100 ng/ml) for 20 min. Treated and control cells were lysed in buffer containing 50 mM HEPES, 1% Triton X-100, 5 mM ethylenediaminetetraacetic acid, 50 mM NaCl, 10 mM sodium pyrophosphate, 50 mM sodium fluoride, 1 mM sodium orthovanadate, and protease inhibitors (1 mM
phenyl-methylsulfonyl fluoride, 1μM aprotinin, 1μM leupeptin, and 1μM pepstatin A). Proteins
were fractionated by sodium dodecyl sulfate-polyacrylamide gel (SDS-PAGE) electrophoresis (15μg–50μg protein per gel lane) and blotted onto polyvinylidene fluoride membranes (Millipore, Billerica, MA, USA). Immunodetection was performed with an Immobilon Western Blotting Detection System (Millipore). Antibodies used for western blotting were as follows: rabbit EphA4 polyclonal antibody (Cat. #sc-921; 1:2000, Santa Cruz), rabbit
anti-FRS2αpolyclonal antibody (Cat. 8318; 1:1000, Santa Cruz), rabbit anti-GAPDH (Cat.
#sc-25778, 1:3000, Santa Cruz), rabbit anti-phospho-p44/42 polyclonal mitogen-activated protein kinase (MAPK) (ERK) (Thr202/Tyr204) antibody (Cat. #9101; 1:4000, Cell Signaling Tech.), rabbit anti-p44/42 MAPK (ERK) polyclonal antibody (Cat. #9102; 1:4000, Cell Signaling
Tech.), and rabbit anti-pFRS2α(Y196) (Cat. #3861; 1:1000, Cell Signaling Tech.). Band
intensi-ties were quantified using CS Analyzer version 3.0 (ATTO Corporation). Because the signal
intensity of FRS2αwas very weak, pFRS2αwas normalized to the signal intensity of GAPDH,
whereas the intensity of pERK was normalized to that of ERK. Primary neurospheres were iso-lated as described above and used for western blot analysis of TBR2 and TUBB3.
Statistical analysis
All values are expressed as mean ± standard deviation (SD). Error bars in graphs represent the
SD. Numerical group means were compared by Student’s t-tests. For all experiments
compar-ing mutants to controls, values from 3–5 pairs of littermates were averaged for each
measure-ment location.
Results
Stage-dependent effect of radial glia
EphA4
deletion on cortical size
To investigate the role of EphA4 in the temporal control of corticogenesis, we conditionally
de-letedEpha4in RGCs of the cortex before the onset of deep cortical layer formation or upper
layer formation. Targeted deletion ofEpha4was accomplished via Cre-dependent
recombina-tion of the loxP-flanked sequences inEpha4fxalleles. Mice carryingEpha4fxalleles were crossed
with mice carryingNestin-CreorhGFAP-Cretransgenes to generate mice homozygous for
Epha4fxalleles andCreunder the control of the nestin or glial fibrillary acid protein (GFAP)
promoter (Nestin;Epha4fx/fxandGFAP;Epha4fx/fx). Mice carrying homozygousEpha4fxalleles
were used as controls. TheNestinorhGFAPpromoter directs expression of Cre recombinase
specifically in RGCs of the dorsal telencephalon and cerebral cortex starting at E11.5 or E13.5,
respectively, resulting in recombined floxed alleles ofEpha4in most or all RGCs and their
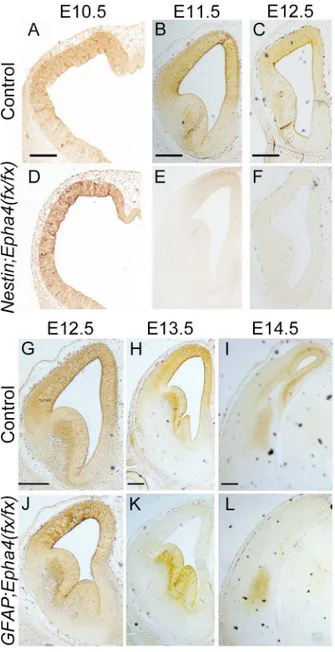
from E10.5 to P0 revealed that most EphA4 expression disappeared at E11.5 inNestin;Epha4fx/fx
mice and at E13.5 inGFAP;Epha4fx/fxmice, consistent with the Cre expression pattern (Fig 2).
InGFAP;Epha4fx/fxmice, EphA4 was expressed abundantly in the basal ganglia, as revealed by immunostaining, and modest expression was also detected in the cortex after E13.5. It has been demonstrated that this extent of reduction in cortical EphA4 expression is sufficient to affect
neurogenesis [14,32,33]. This approach, using two types ofEpha4mutants, allowed us to
ana-lyze the function of EphA4 during two developmental stages of corticogenesis.
Cresyl violet staining of brain sections revealed that the gross layered structure of the
cere-bral cortex inNestin;Epha4fx/fxmice was normal at P0. However, the size of each hemisphere
was reduced slightly compared to control littermates (Fig 1A–1H) and there was a significant
reduction in the radial thickness of the entire cortex (Fig 1M). Furthermore, the thicknesses of the VZ and SVZ, considered cortical proliferative zones, were also significantly reduced in the
anterior cortical region (Fig 1N). The gross structure of the cortex inGFAP;Epha4fx/fxmice
(engineered for laterEpha4deletion) was also normal but, in contrast toNestin;Epha4fx/fx
mice, there were no significant differences in the radial thickness of the cortex or proliferative
zones compared to control littermates (Fig 1A–1D, 1I–1L, 1O and 1P). This specific reduction
in the entire cortical and anterior proliferative zone thickness may reflect the anterior–
posteri-or developmental gradient of cposteri-orticogenesis [34]. We further studied the biological effects of EphA4 deletion on corticogenesis by comparing the locations, numbers, and lineages of
specif-ic cell populations betweenNestin;Epha4fx/fxandGFAP;Epha4fx/fxmice. The heterozygotes,
Nestin;Epha4+/fxandGFAP;Epha4+/fx, did not show any difference from controls in the radial thickness of the cortex and proliferative zones (data not shown).
Loss of EphA4 leads to transient overproduction of cortical INPs and
neurons
One possible explanation for the reduced cortex thickness and smaller anterior cortical
prolif-erative zone at P0 inNestin;Epha4fx/fxmouse brain is a reduction in the number of precursor
cells such as RGCs and INPs in the proliferative zone, which, aside from directly reducing pro-liferative zone thickness, would also reduce the pool of precursors needed for populating the
cortex with mature neurons. To examine if indeed theEpha4deletion reduces the number of
RGCs and INPs, we first examined changes in the expression of the transcription factor PAX6,
a marker for RGCs [8], from E13.5 to P0. We also examined the effect ofEpha4deletion on
RGC-derived neurogenesis by measuring the expression of the neuronal markerβIII tubulin
(TUBB3) during this same embryonic period.
The thickness of the PAX6+ cortical area and the number of PAX6+ cells were both normal inNestin;Epha4fx/fxmice from E13.5 to E15.5, but reduced at E17.5 and thereafter compared to controls (Fig 3A, 3B, 3D, 3E, 3G, 3H, 3J and 3L). The thickness of the cortical layer and number of post-mitotic neurons (TUBB3+) were increased at E14.5 in these mutants compared to con-trol littermates (Fig 3A, 3B, 3N and 3P), had about the same thickness and number of concon-trols at E15.5 and E17.5, but were considerably reduced at P0 (Fig 3D, 3E, 3G, 3H, 3N and 3P). This reduced thickness of the TUBB3+ layer and the lower number of TUBB3+ cells at P0 is
consistent with the thinner cortex shown inFig 1. In contrast, the cortical thickness and
num-ber of post-mitotic neurons ofGFAP;Epha4fx/fxmice were normal at P0. We investigated why
an approximately 2-day delay inEpha4deletion betweenNestin;Epha4fx/fxandGFAP;Epha4fx/
fxmice ameliorated this reduction in the cortical thickness and number of neurons in the
ante-rior region by examining the time course of RGC proliferation and differentiation inGFAP;
Epha4fx/fxmice. The cortical layer of neurons was thicker and the number of neurons was
Fig 2.Nestin-Cre- andhGFAP-Cre-mediated deletion ofEpha4in the developing forebrain at E11.5 and E13.5, respectively. A–F, Immunohistochemical EphA4 expression pattern in control (A–C) andNestin;
Epha4fx/fx
mouse brain (D–F). Expression of EphA4 inNestin;Epha4fx/fxmouse forebrain starts to disappear
after E11.5.G–L,Immunohistochemical EphA4 expression pattern in control (G–I) andGFAP;Epha4
fx/fx
mouse brain (J–L). Expression of EphA4 inGFAP;Epha4fx/fxmouse cortex starts to diminish after E13.5 but
size of the control after E15.5 without reduction at P0 (Fig 3A, 3C, 3D, 3F, 3G, 3I, 3O and 3Q).
In addition, unlikeNestin;Epha4fx/fxmice, the thickness of the PAX6+ area and the number of
PAX6+ cells inGFAP;Epha4fx/fxmouse anterior cortex were not significantly different from
controls after E15.5 (Fig 3A, 3C, 3D, 3F, 3G, 3I, 3K and 3M). In contrast toEpha4fx/fxmutants,
Nestin;Epha4+/fxandGFAP;Epha4+/fxmice showed similar radial thickness of TUBB3+ and PAX6+ layers to controls (data not shown). Because there was no difference between heterozy-gotes and controls, we further compared the phenotypes of homozyheterozy-gotes and controls.
The number of apoptotic cells detected by TUNEL staining was similar to controls at E14.5 in both mutants (Fig 4). These findings suggest that neurogenesis was temporarily accelerated
around E14.5 byEpha4deletion, regardless of the timing of the deletion (E11.5 or E13.5), but
that RGC self-renewal after E17.5 was impaired by earlier deletion ofEpha4, resulting in RGC
depletion and eventual reduction of cortical thickness at P0.
Many upper-layer cortical neurons are generated from TBR2+ INPs in the SVZ rather than
directly from RGCs [6,8,35,36]. To distinguish whether overproduction of cortical neurons at
E14.5 is due to accelerated neuronal differentiation of RGC or enhanced transition to INPs, we examined the number of TBR2+ cells in the VZ and SVZ from E13.5 to P0. The number of TBR2+ cells increased transiently compared to control littermates at E14.5 in both mutants
(Fig 5A–5C, 5J and 5K), suggesting enhanced proliferation of INPs at this stage. However, at
later embryonic stages, the number of TBR2+ INPs decreased inNestin;Epha4fx/fxmice but
re-mained at control levels inGFAP;Epha4fx/fxmouse cortex (Fig 5D–5K). We next quantified the
number of mitotic progenitor cells labeled with anti-phosphohistone-H3 (pHH3) antibody from E13.5 to E17.5 based on their co-staining with PAX6 (RGCs) or TBR2 (INPs). In both mutants, the number of mitotic cells at E14.5 increased in TBR2+ INPs, but not in PAX6+ RGCs, suggesting that replication of INPs is accelerated at this stage regardless of the time of
Epha4deletion (Fig 5L–5Q, 5X and 5Y). The number of pHH3+TBR2+ cells at E17.5 was
sig-nificantly below the control level inNestin;Epha4fx/fxmice but not significantly different from
control levels inGFAP;Epha4fx/fxmice (Fig 5R–5Y).
The results of these INP cell-marking studies using TBR2 or pHH3 were consistent at E14.5, indicating that deletion of EphA4 leads to overproduction of neurons due to a greater precursor population (of INPs). One tentative interpretation is that EphA4 normally sup-presses the asymmetrical division of RGCs toward the INP lineage and the replication of INPs,
in addition to augmenting RGC self-renewal. Later in development (E17.5–P0), the number of
INPs and RGCs is reduced inNestin;Epha4fx/fxmice compared to controls, but not inGFAP;
Epha4fx/fxmice. This difference may be explained by the stage-dependent effect of EphA4 dele-tion on RGC and INP proliferadele-tion and differentiadele-tion.
EphA4 is required for maintaining the self-renewal of RGCs and
suppressing differentiation to the neuronal lineage
Despite accelerated generation of TUBB3+ neurons in both mutants, the number of PAX6+ cells
and the radial thickness of the PAX6+ cell layer were unchanged until around E14.5 (Fig 3J–3Q).
InNestin;Epha4fx/fxmice, however, these parameters, reflecting RGC proliferation and differentia-tion, were reduced after E17.5 compared to controls (Fig 3D, 3E, 3G, 3H, 3J and 3L). The number of INPs also decreased after E17.5 (Fig 5J and 5X), and the number and thickness of the cortical
layer of post-mitotic neurons were considerably reduced by P0 (Figs3G, 3H, 3N, 3Pand5J).
with those of immunohistochemistry. c, control; m,Nestin;Epha4fx/fx
in panel M andGFAP;Epha4fx/fx
in panel N. Scale bars, 100μm.
Since the decrease in the number of INPs and cortical neurons could result from a reduced num-ber of RGCs (the common precursor), we speculated that early accelerated differentiation to corti-cal neurons leads to depletion of RGCs in these mice. To find more direct evidence for decreased self-renewal and increased differentiation of RGCs in the VZ, we quantified the number of cells committed to cell division and the number of post-mitotic neurons. Mitotically active precursor cells were labeled with a pulse of BrdU at E13.5 or E14.5, and the fate of these mitotic cell popula-tions was assessed 24 h later by cell-selective immunostaining. Incorporation of BrdU into divid-ing precursor cells was examined in combination with Ki67, a protein marker of dividdivid-ing cells, or with TUBB3, a marker of post-mitotic neurons, to determine cell cycle reentry or exit, respective-ly, by cells that were mitotic at the time of the BrdU pulse. In mice labeled at either E13.5 or E14.5, we found a significant decrease in the Ki67+BrdU+ cell to total BrdU+ cell ratio in both mutants compared to controls, indicating that RGC self-renewal is diminished by both early and
+, red) (N, O), and the number of neuronal cells (P, Q) using these stained sections (Nestin;Epha4fx/fx
, J, L, N, P;GFAP;Epha4fx/fx
, K, M, O, Q). The PAX6-expressing progenitor cell population in the VZ was of comparable size in both mutants and controls from E13.5 to E15.5 (A–C, J–M), but was
considerably smaller at E17.5 and P0 inNestin;Epha4fx/fxmice (D, E, G, H, J, L). Both mutants showed normal cortex at E13.5, but the cortical layer size of post-mitotic neurons (TUBB3+) became thicker at E14.5 compared to controls (A–C, N–Q). The neuronal area in mutants returned to the size of controls at
E15.5 (D–F, N–Q). However, inNestin;Epha4fx/fxmice, the neuronal area was considerably smaller at P0, while inGFAP;Epha4fx/fxmice it was not (G–I, N–
Q). N = 5, (*) P<0.05. Error bars represent SD. Scale bar, 100μm. doi:10.1371/journal.pone.0126942.g003
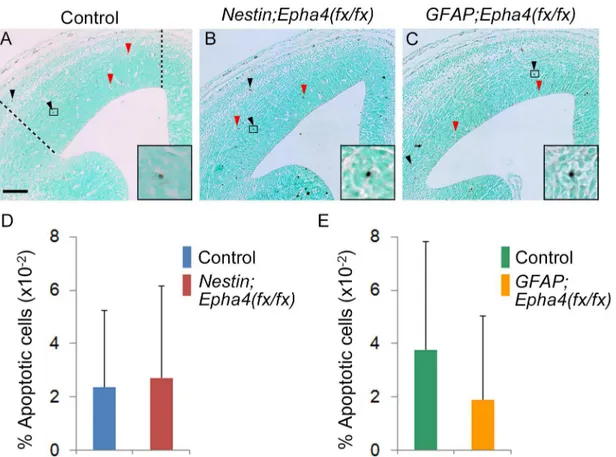
Fig 4. Apoptosis in the cortex. A–C,Representative image of apoptotic cells in the cortex of control (A),Nestin;Epha4fx/fx(B), andGFAP;Epha4fx/fx(C) mice. Apoptotic cells were detected by TUNEL staining at E14.5. Apoptotic cells (black arrowheads) show intense dark black staining, whereas blood cells (red arrow head) exhibit light brown staining in the cytoplasm. The boxed areas are magnified (lower right insets) to show apoptotic cells. The number of apoptotic cells between the dotted lines in each section was counted.D and E, Quantification of the number of apoptotic cells detected in panels A, B, and C. The percentage of apoptotic cells per all cells between the dotted lines inNestin;Epha4fx/fx
(D) andGFAP;Epha4fx/fx
(E) mice is shown. There was no significant difference in the percentage of apoptotic cells. N = 4 per genotype. Error bars represent SD. Scale bar, 100μm.
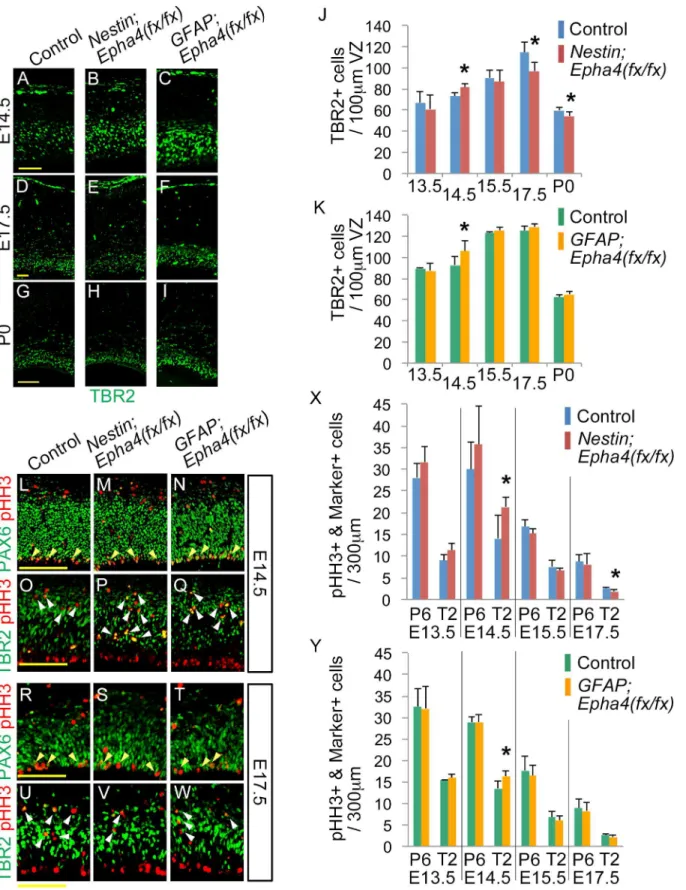
Fig 5. Production of TBR2+ INPs and pHH3+ mitotic cells in the VZ and SVZ ofNestin;Epha4fx/fxandGFAP;Epha4fx/fxmice. A–I,Anterior sections isolated from mutants and control mice between E13.5 and P0 were immunostained for an INP marker (TBR2, green).J and K,The number of TBR2+ cells within 100-μm-wide regions ofNestin;Epha4fx/fx
(J) andGFAP;Epha4fx/fx
laterEpha4deletion (Fig 6A–6C, 6G and 6H). Consistent with these findings, the TUBB3+BrdU+ cell to total BrdU+ cell ratio increased, indicating elevated production of post-mitotic neurons in
both EphA4 mutants concomitant with reduced RGC self-renewal (Fig 6D–6F, 6I and 6J).
To confirm this shift from RGC self-renewal to neuronal differentiation in mutant mice, we
examined the capacity of isolated cortical cells to produce neurospheresin vitro. Embryonic
day 14.5 cortical cells from control mice and mutants were dissociated and cultured in the pres-ence of FGF2 alone, clustered ephrin-A1 alone, or FGF2 plus clustered ephrin-A1 [37]. As de-scribed above, EphA4 expression was detected in both the basal ganglia and the cortex of
GFAP;Epha4fx/fxmice. To avoid contamination by EphA4+ cells, we used cells only from Nes-tin;Epha4fx/fxcortex for this experiment. Control E14.5 cortical cells developed into a larger
number of neurospheres than E14.5 cortical cells fromNestin;Epha4fx/fxmice in the presence
of either FGF2 alone or FGF2 plus clustered ephrin-A1 (Fig 6K and 6L). In addition to neuro-sphere formation, we examined the effect of EphA4 deletion on the neuronal differentiation of neurospheres using immunostaining. Neurospheres derived from the mutant formed more TBR2+ cells and TUBB3+ cells than control neurospheres (Fig 6M). We also confirmed the in-creased expression level of TBR2 and TUBB3 in mutant spheres by western blotting analysis
(Fig 6N–6P). These results suggest that EphA4 is required for FGF2-mediated self-renewal of
neural stem cells/progenitors in culture.
These results indicate that EphA4 appears critical for RGC self-renewal around E14.5.
Epha4deletion induces premature progression of RGCs toward the neuronal cell lineage, and this accelerated differentiation to cortical neurons during early corticogenesis results in deple-tion of RGC and, ultimately, in a reduced cortical volume by P0.
Early loss of
Epha4
leads to aberrant corticogenesis via precocious
neuronal differentiation
The early transition of RGCs to INPs and neurons in the VZ ofEpha4deletion mutants around
E14.5 could conceivably alter the laminar structure of the cerebral cortex. The laminar pattern of cortical neurons is generated by two developmental processes, migration of neurons to their final destination within the nascent neocortex and acquisition of distinct neuronal identities [5, 38]. We first examined whether RGCs lacking EphA4 generate cortical layers through neural
migration inNestin;Epha4fx/fxandGFAP;Epha4fx/fxmutants. Since the neurons born at E13.5
are predominantly deep layer neurons and those born at E15.5 are upper-layer neurons [39], we performed birthdating experiments by injecting mice with BrdU at E13.5 or E15.5 [40]. EphA4 was deleted by E13.5 in both mutants, as described above (Fig 2). We divided the P0 cortex into 10 subregions of equivalent thickness (bins) and measured the fraction of BrdU+
cells in each.Nestin;Epha4fx/fxmice labeled with BrdU at E13.5 showed a significant increase in
the number of BrdU+ neurons in bins 2–4 compared to controls (Fig 7A, 7B, 7G, 7H and 7M).
However, the same mutant mice labeled at E15.5 showed a significant decrease in the number
of BrdU+ cells in bins 2 and 4 (Fig 7D, 7E, 7J, 7K and 7N).GFAP;Epha4fx/fxmice labeled at
E13.5 showed an increase in the number of BrdU+ neurons in bins 2–4, similar to the findings
E17.5 and P0, TBR2+ cells were depleted inNestin;Epha4fx/fx
mice (E, H, E17.5 and P0 in J) but the numbers were unaffected inGFAP;Epha4fx/fx
mice compared to controls (F, I, E17.5 and P0 in K).L–W,Co-staining for pHH3 and PAX6 or TBR2. Mitotic cells were immunostained for pHH3 (red). The pHH3 + cells were co-stained with PAX6 (green), a marker for RGCs, or with TBR2 (green), a marker of INPs. Co-stained cells are shown by yellow and white arrowheads, respectively.X and Y,Quantification of the number of pHH3+ cells co-labeled by either marker inNestin;Epha4fx/fx(X) andGFAP;Epha4fx/fx(Y) mice. The number of pHH3+PAX6+ RGCs (P6) and pHH3+TBR2+ INPs (T2) was counted separately at E13.5, E14.5, E15.5, and E17.5 in control,Nestin; Epha4fx/fx
, andGFAP;Epha4fx/fx
mice. More INPs (pHH3+TBR2+) are dividing at E14.5 in both mutants.Nestin;Epha4fx/fx
exhibited fewer mitotic RGCs (pHH3+PAX6+) than controls at E17.5, whereasGFAP;Epha4fx/fxmice showed no difference from controls. P6, pHH3+PAX6+; T2, pHH3+TBR2+. N = 5 (A–
K) and 4 (L–Y), (*)P<0.05. Error bars represent SD. Scale bars: A–F, 50μm, G–I and L–W, 100μm.
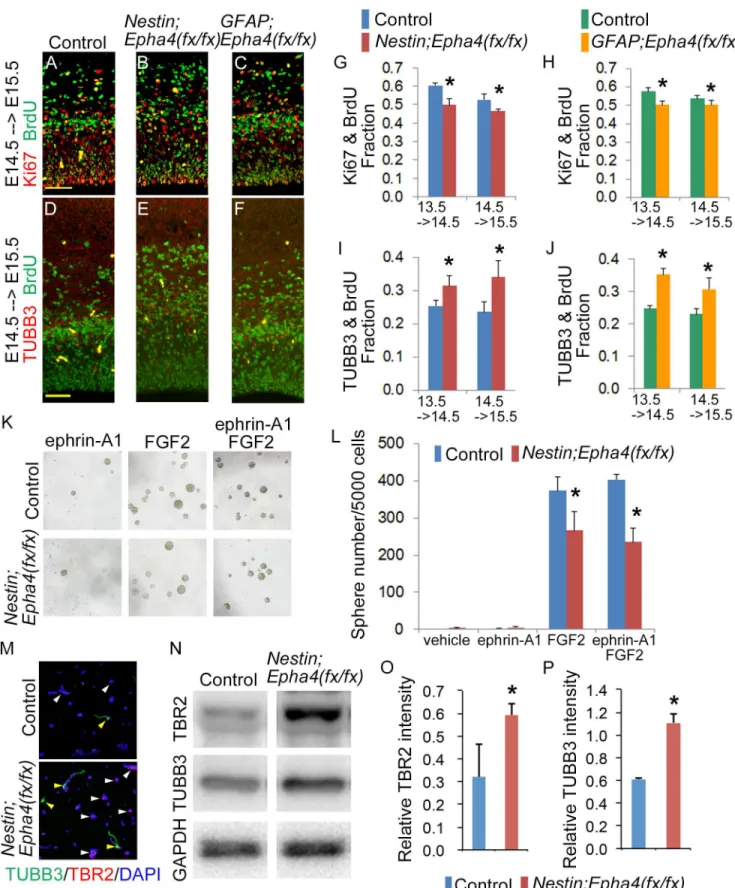
Fig 6. Self-renewal and differentiation of neural stem/progenitor cells. A–J,Evaluation of the population of cells that re-enter and exit the cell cycle in Nestin;Epha4fx/fx
andGFAP;Epha4fx/fx
inNestin;Epha4fx/fxmice, but also showed an increase in the number of BrdU+ cells in bins 2 and 3 when labeled at E15.5 (Fig 7A, 7C, 7G, 7I, 7D, 7F, 7J, 7L, 7O and 7P). These findings sug-gest that the migration bias toward the upper layer at E13.5 may be augmented in both mutants by generation of more upper-layer neurons at this time point. The difference in the number of
E15.5-labeled BrdU+ neurons betweenNestin;Epha4fx/fxandGFAP;Epha4fx/fxmay be caused
by the difference inEpha4deletion timing.
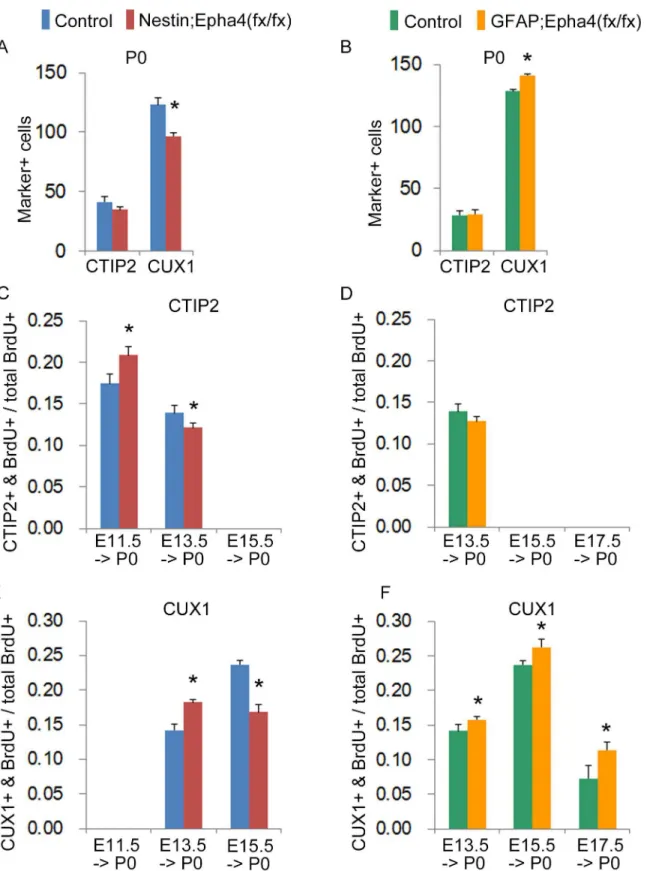
We then examined the relative proportion of cells that acquired a specific layer fate by immunostaining with specific markers for layers 2/3 (CUX1) or layer 5 (CTIP2) in the dorso-lateral neocortex [39]. CUX1+ and CTIP2+ cells in mutant mice were, similar to cells in control
mice, distributed in layers 2/3 and 5, respectively (Fig 7A–7L), suggesting that there is no
ap-parent disturbance in the fate of cortical neuronal cells in the absence of EphA4. However, we
observed a significant decrease in the number of CUX1+ cells inNestin;Epha4fx/fxmice
com-pared to controls at P0 (Fig 8A), whileGFAP;Epha4fx/fxmice showed a significant increase in
the number of CUX1+ cells at P0 (Fig 8B).
We therefore examined the identity of neurons born at each stage inEpha4mutants. We
quantified the ratio of neurons born at a given developmental stage relative to the total number of BrdU+ cells within both upper and lower cortical layers of mutants and controls. The divid-ing cells labeled by BrdU at E11.5, E13.5, E15.5, or E17.5 were examined at P0 for BrdU and a
layer-specific marker, CTIP2 for layer 5 or CUX1 for layers 2/3, in anterior brain sections.
Nes-tin;Epha4fx/fxmice showed a significant increase in the ratio of CTIP2+BrdU+ neurons to total BrdU+ cells born at E11.5, a significant increase in the ratio of CUX1+BrdU+ neurons to total BrdU+ cells born at E13.5, and a significant decrease in the ratio of CTIP2+BrdU+ neurons to total BrdU+ cells born at E13.5 (Fig 8C and 8E). The same mutant mice labeled with BrdU at E15.5 also showed a significant decrease in the number of CUX1+BrdU+ neurons and no de-tectable CTIP2+BrdU+ cells (Fig 8C and 8E). Therefore, deep layer neurons expressing CTIP2
appear to be generated earlier inNestin;Epha4fx/fxmice than in controls, again suggesting
pre-cocious neurogenesis. Since neurogenesis inNestin;Epha4fx/fxmice is accelerated after E11.5,
the stage of EphA4 deletion in this mutant, precocious differentiation to neurons may account
for depletion of PAX6+ RGCs at P0 inNestin;Epha4fx/fxmice (Figs1N,3J, 3L,8C and 8E).
In the case ofGFAP;Epha4fx/fxmice, however, the ratio of CTIP2+BrdU+ neurons to total
BrdU+ cells born at E13.5, the stage of EphA4 deletion in these mutants, remained unchanged (Fig 8D), suggesting that the deep layer neurons expressing CTIP2 had already completed
INPs, while TUBB3+BrdU+ cells represent differentiated neuronal cells. Representative immunofluorescent images at E15.5 for BrdU (green) and Ki67 (red) (A–C), and those for BrdU (green) and TUBB3 (red) (D–F). Quantification of the number of Ki67+BrdU+ cells (G, H) and TUBB3+BrdU+ cells (I, J) inNestin;
Epha4fx/fx(G, I) andGFAP;Epha4fx/fx(H, J) mice. In both mutants, the Ki67+BrdU+ cell to total BrdU+ cell ratio decreased around E14.5, whereas the TUBB3 +BrdU+ cell to total BrdU+ cell ratio significantly increased relative to controls. These findings suggest that differentiation of RGCs and INPs to neurons is accelerated at this stage in mutants relative to controls. These changes are expressed quantitatively as the fraction of double stained cells relative to the total number of BrdU+ cells in the cortex. N = 5 per genotype, (*) P<0.05. Error bars represent SD. Scale bars, 50μm.K and L,Neurosphere formation from cortical cells isolated fromNestin;Epha4fx/fxcortex in the presence of FGF2 alone, clustered ephrin-A1 alone, or FGF2 plus clustered ephrin-A1. Representative images of neurosphere formation (K) and the number of neurospheres in K (L). Fewer neurospheres grew from isolatedNestin;Epha4fx/fx cortical cells than from control cortical cells. FGF2 increased the number of the neurospheres derived from control E14.5 cortex but not that from mutant E14.5 cortex, whereas clustered ephrin-A1 alone, a ligand for EphA4, did not affect neurosphere growth.M–P,Differentiation of neurospheres derived from control andNestin;Epha4fx/fxcortical cells. The cells from the E14.5 cortex were cultured for 4–5 days to form primary neurospheres. Cells from the primary
neurospheres were replated to obtain a monolayer culture and used for immunostaining as described in the Materials and Methods. Representative image of neurospheres immunostained with markers for INPs (TBR2, red) and neurons (TUBB3, green) (M). There was a higher percentage of spheres with TBR2+ (white arrowheads) and TUBB3+ (yellow arrowheads) cells in the mutant (lower figure in M) than in controls (upper figure in M). Representative western blot analysis of TBR2 and TUBB3 in neurospheres from control andNestin;Epha4fx/fxmice (N) and quantification of TBR2 (O) and TUBB3 (P) signal intensities in neurospheres from control andNestin;Epha4fx/fxmice. The level of TBR2 and TUBB3 expression in the spheres increased in mutants compared to controls,
showing that spheres ofNestin;Epha4fx/fx
are in a more differentiated state compared to control. N = 5 per genotype, (*) P<0.05. Error bars represent SD.
migration by this stage. Furthermore, in contrast to the results inNestin;Epha4fx/fxmice,
GFAP;Epha4fx/fxmice showed a significant increase in the ratio of CUX1+BrdU+ neurons born at all of the stages, including E13.5, E15.5, and E17.5 (Fig 8F).
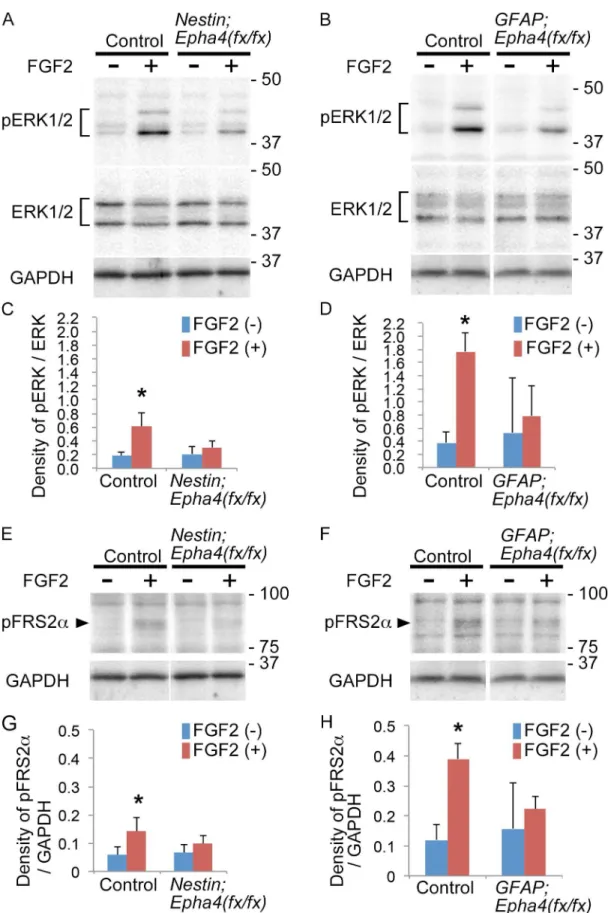
EphA4 regulates cortical neurogenesis by modulating an FGF signal
We reported previously that EphA4 forms a ternary complex with FGFRs and FRS2αand
aug-ments the canonical FGF signal through tyrosine phosphorylation of FRS2αand ERK activation
[18,41]. To examine whether loss of EphA4 affects the FGF signaling pathway in the cortex, western blotting was used to examine the activation of downstream FGF signaling molecules,
phosphorylated FRS2α(pFRS2α) and ERK1/2 (pERK1/2), in response to FGF2 in E15.5Epha4
mutants and control mice. Both FRS2αand ERK1/2 were phospho-activated in response to
FGF2 stimulation in the control, but these proteins in the mutants were much less activated than in the control (Fig 9), suggesting that loss of EphA4 diminishes FGF signaling in cortical cells.
Discussion
Most developmental processes, including proliferation, survival, apoptosis, migration, meta-bolic alterations, and morphological changes, are triggered by synthesis of signaling molecules and binding to distinct receptors expressed by neighboring cells. The Eph/ephrin cell-cell
contact-mediated signaling pathway is implicated in many biological events [16,42]. In brain
development, EphA4 signaling is involved in the control of embryonic and postnatal
neurogen-esis [25,26]. Multiple FGF signaling pathways participate in corticogenesis. At least 8 of the 22
members of the FGF ligand family, FGF2, 3, 7, 8, 10, 15, 17, and 18, are expressed in early fore-brain and function in mammalian corticogenesis by binding to and activating three distinct
FGFRs, FGFR1, FGFR2, and FGFR3 [14,43–47]. A few molecules, such as heparan sulfate
pro-teoglycans [48], Klotho [49], XFLRT3 [50], SEF [51], and EphA4 [18,41], are known to
modu-late FGF signaling by binding to FGF ligands and/or FGFRs.
During cortical neurogenesis, RGCs not only self-renew but also generate cortical neurons by undergoing asymmetrical division to INPs and further differentiation through this lineage.
Peak neurogenesis occurs around E14.5 [52]. We generated two lines ofEpha4deletion mutant
mice using Nestin-Cre and GFAP-Cre. These mice show loss of EphA4 expression in a
stage-specific manner, after E11.5 by Nestin-Cre (Nestin;Epha4fx/fx) and after E13.5 by GFAP-Cre
(GFAP;Epha4fx/fx). We found a similar phenotype in both mutants around E14.5 that suggested upregulated neurogenesis. The number of TBR2+ or pHH3+ mitotic cells in the SVZ, repre-senting INPs, increased significantly at E14.5 compared to controls, but the number of PAX6+ RGCs remained constant, suggesting that EphA4 acts to repress both replication of INPs and differentiation of INPs to neurons at this stage without an apparent effect on RGC cell division.
However,Nestin;Epha4fx/fxandGFAP;Epha4fx/fxmice exhibited distinct phenotypes at P0.
Overproduction of neurons at E14.5 was not maintained after E15.5 in either mutant. In
Nes-tin;Epha4fx/fxmice, the number of RGCs expressing PAX6 in the VZ and INPs expressing TBR2 in the SVZ decreased at E17.5 and P0. The number of mitotic cells labeled by pHH3 in
the SVZ ofNestin;Epha4fx/fxmice was also reduced at E17.5 compared to control mice.
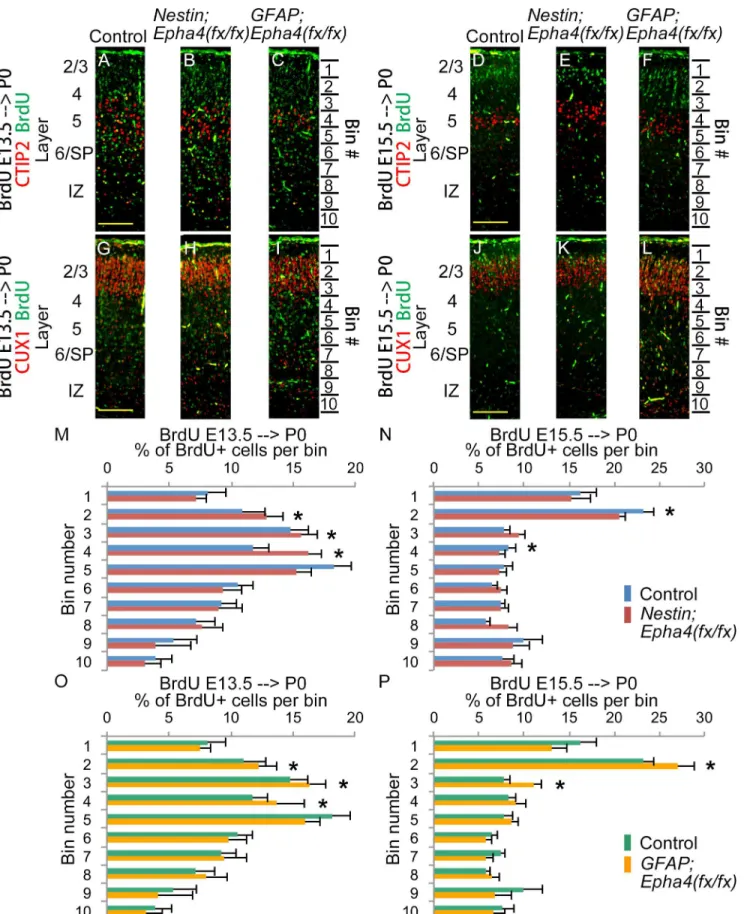
Quantified distribution of BrdU+ cell numbers in 10 bins spanning the layers of the cortex. BrdU was injected to label proliferative cells that differentiate into migrating neurons at E13.5 (A–C, G–I, M, O) and E15.5 (D–F, J–L, N, P). The cortical distributions of these cells were analyzed at P0 in control (A, D, G, J),
Nestin;Epha4fx/fx(B, E, H, K) andGFAP;Epha4fx/fx(C, F, I, L) mice. InNestin;Epha4fx/fxmice, a greater fraction of neurons born at E13.5 (M, red bar) was found in upper cortical layers compared to controls (M, blue bar), but a smaller fraction of cells born at E15.5 (N, red bar) was found in upper layers compared to controls (N, blue bar). In contrast,GFAP;Epha4fx/fx
mice exhibited a greater fraction of neurons born at both E13.5 and E15.5 (O and P, yellow bar) in upper cortical layers compared to controls (O and P, green bar). N = 3 per genotype, (*) P<0.01. Error bars represent SD.
Fig 8. Cortical distribution of neurons born at E11.5, E13.5, E15.5, or E17.5 in P0 mice. A and B,Total number of cells labeled with the layer marker CTIP2 or CUX1 at P0 inNestin;Epha4fx/fx(A) orGFAP;Epha4fx/fx(B) mice compared to controls.C–F, The ratio of the number of CTIP2+BrdU+ or CUX1
+BrdU+ cells relative to the total number of BrdU+ cells. BrdU was injected to label proliferative cells at E11.5, E13.5, E15.5, and E17.5 inNestin;Epha4fx/fx (C, E),GFAP;Epha4fx/fx
(D, F) and corresponding control mice. Both the mutant and the control embryos show a similar cortical layer structure. However, the total number of CUX1+ cells at P0 decreased inNestin;Epha4fx/fx
(A) but increased inGFAP;Epha4fx/fx
Moreover, in P0 cortex,Nestin;Epha4fx/fxmice produced more upper-layer CUX1+ neurons born at E13.5 than controls, while the number of CUX1+ neurons born at E15.5 was reduced.
These results suggest precocious neurogenesis and subsequent depletion of RGCs inNestin;
Epha4fx/fxmice. This conclusion was supported by neurosphere formation experiments and
analysis of neurospheres for differentiation. Cells isolated from the E14.5 cortex ofNestin;
Epha4fx/fxmice formed fewer neurospheres in response to FGF2 than controls, and increased expression of the markers for INPs (TBR2) and neurons (TUBB3) compared to controls, indi-cating that the commitment and progression from RGCs to INPs and/or from INPs to neurons have already begun at this stage. Hence, EphA4 functions to maintain RGC self-renewal and repress the differentiation of RGCs to INPs and INPs to cortical neurons.
In contrast toNestin;Epha4fx/fxmice, the number of RGCs, INPs, and mitotic cells inGFAP;
Epha4fx/fxmice at E17.5 and P0 was similar to controls. In addition, the number of CUX1+ neu-rons born at E13.5, E15.5, and E17.5 increased in the cortex of this mutant at P0, suggesting
that the precocious neurogenesis and depletion of RGCs observed inNestin;Epha4fx/fxmice
does not occur inGFAP;Epha4fx/fxmice. However, there were more RGCs exiting the cell cycle
and fewer re-entering the cell cycle at E14.5 inGFAP;Epha4fx/fxmice than controls, suggesting
thatGFAP;Epha4fx/fxmice also show temporarily accelerated neurogenesis, similar toNestin; Epha4fx/fxmice, at this developmental stage.
The distinct cortical phenotypes of the two mutants at P0 may be caused by the difference in the developmental stage when EphA4 is deleted. RGCs extensively expand their cell pool be-fore E11.5 and begin to deplete the pool after E11.5, when neurogenesis occurs. By E11.5,
Epha4had been deleted inNestin;Epha4fx/fxmice but not inGFAP;Epha4fx/fxmice.Epha4
dele-tion inGFAP;Epha4fx/fxmice occurs 2 days later (E13.5) than inNestin;Epha4fx/fxmice. Thus,
at the time when neurogenesis starts,GFAP;Epha4fx/fxmice have a more abundant RGC pool
thanNestin;Epha4fx/fxmice. The delay inEpha4deletion inGFAP;Epha4fx/fxmice may be why
the decrease in RGCs is not observable by P0. The decrease in the number of RGCs inNestin;
Epha4fx/fxmice was detectable at E17.5, even though precocious neurogenesis had already been
observed inNestin;Epha4fx/fxmice at E11.5. Therefore, inGFAP;Epha4fx/fxmice, depletion of
RGCs due to precocious neurogenesis might become detectable at a later stage than inNestin;
Epha4fx/fxmice.
By deleting EphA4 expression at different developmental stages in the cortex, we were able to identify three mechanisms determining cortex size at P0: (1) EphA4 functions to repress dif-ferentiation through the neuronal lineage, (2) EphA4 regulates the production of INPs from RGCs, and (3) EphA4 appears critical for maintaining the self-renewal of RGCs, especially be-fore E13.5. Regarding this third point, however, the number of PAX6+ RGCs did not decrease
until E17.5, even inNestin;Epha4fx/fxmice. A recent study identified a new type of progenitor
cells in mice, radial glial-like cells (oRGCs), which are likely a progeny of RGCs. oRGCs are PAX6+ but monopolar cells with only a basal process and without an apical process, in contrast to bipolar RGCs [53]. We, therefore, cannot rule out the possibility that the PAX6+ cell
popula-tion inNestin;Epha4fx/fxmouse cortex may have included a substantial number of oRGCs, and
so obscured the accelerated differentiation of RGCs before E17.5.
We previously reported that trans-activation of EphA4 and FGFRs by a direct interaction
phosphorylates a downstream docking protein, FRS2α, and activates ERK1/2in vitro[18,41].
mice, a larger number of CTIP2+ cells was co-labeled with BrdU at E11.5 but fewer were co-labeled at E13.5 compared to controls (C), whereas inGFAP; Epha4fx/fx
mice, the number of co-labeled cells was similar to that of controls at both E11.5 and E13.5 (D). The number of CUX1+ cells co-labeled with BrdU at E13.5 was greater in both mutants (E, F), while the number at E15.5 was lower inNestin;Epha4fx/fxmice (E) and greater inGFAP;Epha4fx/fxmice compared to controls (F). IZ, intermediate zone; SP, subplate. N = 6 for total number of CUX1+ cells and N = 3 for other markers per genotype, (*) P<0.01. Error bars represent SD.
Fig 9. ERK1/2 and FRS2αphosphorylation in cortical cells in response to FGF2. A and B,Representative western blot analysis of ERK1/2
We show in the current report that FRS2αand ERK1/2 are less activated by FGF2 in E15.5
cor-tical cells from bothEpha4mutants compared to controls. Moreover, cortical cells isolated
from mutant cortex formed fewer neurospheres than cells from control cortex in response to FGF2 stimulation. These results indicate that FGF responsiveness is reduced in cortical cells
missingEpha4. Loss of FGF signaling by combined deletion of FGFR1, FGFR2, and FGFR3 in
the cortex by E10 or E13.5 reduced PAX6+ RGCs and increased TBR1+ or TBR2+ INPs and
TUBB3+ neurons [14,15]. As these cortical phenotypes are similar to those of ourEpha4
mu-tants, we speculate that EphA4 supports RGC self-renewal and represses RGC differentiation
telencephalon were stimulated for 20 min with FGF2 after 1 h starvation and lysed immediately. Stimulated and non-stimulated cells are marked by + or—,
respectively. Total ERK1/2 expression (ERK) was used to show equal sample loading.C and D,Quantification of pERK1/2 and ERK1/2 signal intensities in the cortical cells stimulated with FGF2 (+) or not (-) inNestin;Epha4fx/fx(C) andGFAP;Epha4fx/fx(D) mice.E and F,Representative western blot analysis of FRS2αphosphorylation (pFRS2α) in cortical cells from control andNestin;Epha4fx/fxmice (E) orGFAP;Epha4fx/fxmice (F). Cells from the E15.5
telencephalon were examined as described above. GAPDH expression was used to show equal sample loading.G and H,Quantification of pFRS2αand GAPDH signal intensities in cortical cells stimulated with FGF2 (+) or not (-) inNestin;Epha4fx/fx
(G) andGFAP;Epha4fx/fx
(H) mice. ERK1/2 and FRS2α
phosphorylation levels were much lower in both mutants compared to controls. Molecular size markers are shown in kDa on the right side of the western blot lanes. N = 5 per genotype, (*) P<0.05. Error bars represent SD.
doi:10.1371/journal.pone.0126942.g009
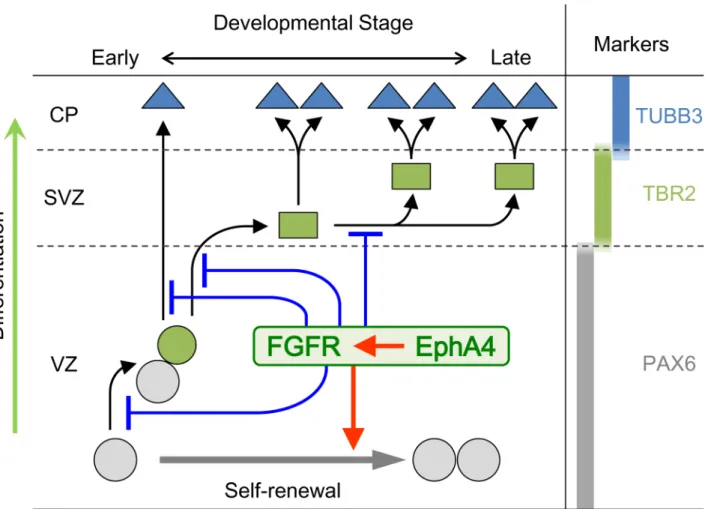
Fig 10. A model summarizing our results.In early brain corticogenesis, EphA4 in collaboration with FGFRs regulates transition through the neuronal lineage and accelerates self-renewal of RGCs. Black and gray arrows indicate the process of differentiation and self-renewal, respectively. Red arrow-headed lines indicate the function of acceleration and blue T-shaped lines indicate that of suppression. PAX6, TBR2, and TUBB3 are the markers for RGCs, INPs, and neuronal cells, respectively. Gray circles, RGCs; Green circle, committed RGCs; Green squares, INPs; Blue triangles, neuronal cells. CP, cortical plate; SVZ, subventricular zone; VZ, ventricular zone.
into neurons, processes known to be mediated by FGF signaling [15,54]. However,Epha4
mutants did not show a measurable reduction in the number of RGCs or in the cortical area oc-cupied by RGCs between E13.5 and E14.5, in contrast to FGFR mutants, which exhibited reduc-tions in both RGC number and cortical area dominated by RGCs at this embryonic stage. Instead, we found a transient increase in INPs and differentiated neuronal cells at E14.5 in both
Epha4mutants. Furthermore, cortical size at P0 was reduced inNestin;Epha4fx/fxmice
com-pared toGFAP;Epha4fx/fxmice. Taken together, these observations suggest that the balance
be-tween RGC self-renewal and the progression to more differentiated states is determined mainly
by FGF signaling and regulated by EphA4 through complex formation with FGFRsin vivo. The
function of EphA4 before E13.5 appears critical for determining the size of the cortex at P0. In summary, our study demonstrates that EphA4 plays an important role in modulating RGC self-renewal, INP proliferation, and the differentiation of RGCs and INPs through the neuronal lineage during embryonic corticogenesis (Fig 10). The regulatory function of EphA4 appears to be mediated by FGF signaling. The critical period for EphA4 expression that affects the size of the cortex at P0 occurs before E13.5, although disturbed expression later in develop-ment may also transiently influence cortical neurogenesis. However, gross cortical layer forma-tion is not disturbed, even in the absence of EphA4 expression after E10.5.
Acknowledgments
We thank Dr. Gen Yamada and his colleagues for providing helpful suggestions and technical support, and Mayuko Sakiyama for genotyping the mice.
Author Contributions
Conceived and designed the experiments: KF KS. Performed the experiments: KF QC DA KK TS XJ MM. Analyzed the data: KF QC SH KS. Wrote the paper: KF QC KS.
References
1. Kriegstein A, Noctor S, Martinez-Cerdeno V. Patterns of neural stem and progenitor cell division may underlie evolutionary cortical expansion. Nat Rev Neurosci. 2006; 7: 883–890. PMID:17033683 2. Merkle FT, Alvarez-Buylla A. Neural stem cells in mammalian development. Curr Opin Cell Biol. 2006;
18: 704–709. PMID:17046226
3. Noctor SC, Martinez-Cerdeno V, Ivic L, Kriegstein AR. Cortical neurons arise in symmetric and asym-metric division zones and migrate through specific phases. Nat Neurosci. 2004; 7: 136–144. PMID:
14703572
4. Kwan KY, Sestan N, Anton ES. Transcriptional co-regulation of neuronal migration and laminar identity in the neocortex. Development. 2012; 139: 1535–1546. doi:10.1242/dev.069963PMID:22492350 5. McConnell SK. The generation of neuronal diversity in the central nervous system. Annu Rev Neurosci.
1991; 14: 269–300. PMID:2031572
6. Sessa A, Mao CA, Hadjantonakis AK, Klein WH, Broccoli V. Tbr2 directs conversion of radial glia into basal precursors and guides neuronal amplification by indirect neurogenesis in the developing neocor-tex. Neuron. 2008; 60: 56–69. doi:10.1016/j.neuron.2008.09.028PMID:18940588
7. Arlotta P, Molyneaux BJ, Chen J, Inoue J, Kominami R, Macklis JD. Neuronal subtype-specific genes that control corticospinal motor neuron development in vivo. Neuron. 2005; 45: 207–221. PMID:
15664173
8. Englund C, Fink A, Lau C, Pham D, Daza RA, Bulfone A, et al. Pax6, Tbr2, and Tbr1 are expressed se-quentially by radial glia, intermediate progenitor cells, and postmitotic neurons in developing neocortex. J Neurosci. 2005; 25: 247–251. PMID:15634788
9. Nieto M, Monuki ES, Tang H, Imitola J, Haubst N, Khoury SJ, et al. Expression of Cux-1 and Cux-2 in the subventricular zone and upper layers II-IV of the cerebral cortex. J Comp Neurol. 2004; 479: 168–
180. PMID:15452856
modeling human neuro-cardio-facial-cutaneous and related syndromes. J Neurosci. 2012; 32: 8663–
8677. doi:10.1523/JNEUROSCI.1107-12.2012PMID:22723706
11. Sato T, Shimazaki T, Naka H, Fukami S, Satoh Y, Okano H, et al. FRS2alpha regulates Erk levels to control a self-renewal target Hes1 and proliferation of FGF-responsive neural stem/progenitor cells. Stem Cells. 2010; 28: 1661–1673. doi:10.1002/stem.488PMID:20652960
12. Satoh Y, Kobayashi Y, Takeuchi A, Pages G, Pouyssegur J, Kazama T. Deletion of ERK1 and ERK2 in the CNS causes cortical abnormalities and neonatal lethality: Erk1 deficiency enhances the impairment of neurogenesis in Erk2-deficient mice. J Neurosci. 2011; 31: 1149–1155. doi:10.1523/JNEUROSCI.
2243-10.2011PMID:21248139
13. Yamamoto S, Yoshino I, Shimazaki T, Murohashi M, Hevner RF, Lax I, et al. Essential role of Shp2-binding sites on FRS2alpha for corticogenesis and for FGF2-dependent proliferation of neural progeni-tor cells. Proc Natl Acad Sci U S A. 2005; 102: 15983–15988. PMID:16239343
14. Kang W, Wong LC, Shi SH, Hebert JM. The transition from radial glial to intermediate progenitor cell is inhibited by FGF signaling during corticogenesis. J Neurosci. 2009; 29: 14571–14580. doi:10.1523/
JNEUROSCI.3844-09.2009PMID:19923290
15. Rash BG, Lim HD, Breunig JJ, Vaccarino FM. FGF signaling expands embryonic cortical surface area by regulating Notch-dependent neurogenesis. J Neurosci. 2011; 31: 15604–15617. doi:10.1523/
JNEUROSCI.4439-11.2011PMID:22031906
16. Klein R. Eph/ephrin signalling during development. Development. 2012; 139: 4105–4109. doi:10.1242/
dev.074997PMID:23093422
17. Wilkinson DG. Multiple roles of EPH receptors and ephrins in neural development. Nat Rev Neurosci. 2001; 2: 155–164. PMID:11256076
18. Yokote H, Fujita K, Jing X, Sawada T, Liang S, Yao L, et al. Trans-activation of EphA4 and FGF recep-tors mediated by direct interactions between their cytoplasmic domains. Proc Natl Acad Sci U S A. 2005; 102: 18866–18871. PMID:16365308
19. Greferath U, Canty AJ, Messenger J, Murphy M. Developmental expression of EphA4-tyrosine kinase receptor in the mouse brain and spinal cord. Mech Dev. 2002; 119 Suppl 1: S231–238. PMID:
14516691
20. Nieto MA, Gilardi-Hebenstreit P, Charnay P, Wilkinson DG. A receptor protein tyrosine kinase implicat-ed in the segmental patterning of the hindbrain and mesoderm. Development. 1992; 116: 1137–1150.
PMID:1295734
21. Clifford MA, Kanwal JK, Dzakpasu R, Donoghue MJ. EphA4 expression promotes network activity and spine maturation in cortical neuronal cultures. Neural development. 2011; 6: 21. doi: 10.1186/1749-8104-6-21PMID:21542907
22. Dufour A, Egea J, Kullander K, Klein R, Vanderhaeghen P. Genetic analysis of EphA-dependent signal-ing mechanisms controllsignal-ing topographic mappsignal-ing in vivo. Development. 2006; 133: 4415–4420. PMID:
17035292
23. Hu Y, Li S, Jiang H, Li MT, Zhou JW. Ephrin-B2/EphA4 forward signaling is required for regulation of ra-dial migration of cortical neurons in the mouse. Neurosci Bull. 2014; 30: 425–432. doi:
10.1007/s12264-013-1404-1PMID:24477991
24. Kullander K, Mather NK, Diella F, Dottori M, Boyd AW, Klein R. Kinase-dependent and kinase-indepen-dent functions of EphA4 receptors in major axon tract formation in vivo. Neuron. 2001; 29: 73–84.
PMID:11182082
25. Khodosevich K, Watanabe Y, Monyer H. EphA4 preserves postnatal and adult neural stem cells in an undifferentiated state in vivo. J Cell Sci. 2011; 124: 1268–1279. doi:10.1242/jcs.076059PMID:
21444754
26. North HA, Zhao X, Kolk SM, Clifford MA, Ziskind DM, Donoghue MJ. Promotion of proliferation in the developing cerebral cortex by EphA4 forward signaling. Development. 2009; 136: 2467–2476. doi:10.
1242/dev.034405PMID:19542359
27. Herrmann JE, Pence MA, Shapera EA, Shah RR, Geoffroy CG, Zheng B. Generation of an EphA4 con-ditional allele in mice. Genesis. 2010; 48: 101–105. doi:10.1002/dvg.20587PMID:20014422
28. Tronche F, Kellendonk C, Kretz O, Gass P, Anlag K, Orban PC, et al. Disruption of the glucocorticoid re-ceptor gene in the nervous system results in reduced anxiety. Nat Genet. 1999; 23: 99–103. PMID:
10471508
29. Zhou X, Suh J, Cerretti DP, Zhou R, DiCicco-Bloom E. Ephrins stimulate neurite outgrowth during early cortical neurogenesis. J Neurosci Res. 2001; 66: 1054–1063. PMID:11746437
31. Malatesta P, Hack MA, Hartfuss E, Kettenmann H, Klinkert W, Kirchhoff F, et al. Neuronal or glial proge-ny: regional differences in radial glia fate. Neuron. 2003; 37: 751–764. PMID:12628166
32. Stevens HE, Smith KM, Maragnoli ME, Fagel D, Borok E, Shanabrough M, et al. Fgfr2 is required for the development of the medial prefrontal cortex and its connections with limbic circuits. J Neurosci. 2010; 30: 5590–5602. doi:10.1523/JNEUROSCI.5837-09.2010PMID:20410112
33. Way SW, McKenna J 3rd, Mietzsch U, Reith RM, Wu HC, Gambello MJ. Loss of Tsc2 in radial glia mod-els the brain pathology of tuberous sclerosis complex in the mouse. Hum Mol Genet. 2009; 18: 1252–
1265. doi:10.1093/hmg/ddp025PMID:19150975
34. Bayer SA, Altman J. Directions in neurogenetic gradients and patterns of anatomical connections in the telencephalon. Prog Neurobiol. 1987; 29: 57–106. PMID:3295998
35. Kowalczyk T, Pontious A, Englund C, Daza RA, Bedogni F, Hodge R, et al. Intermediate neuronal pro-genitors (basal propro-genitors) produce pyramidal-projection neurons for all layers of cerebral cortex. Cereb Cortex. 2009; 19: 2439–2450. doi:10.1093/cercor/bhn260PMID:19168665
36. Noctor SC, Flint AC, Weissman TA, Dammerman RS, Kriegstein AR. Neurons derived from radial glial cells establish radial units in neocortex. Nature. 2001; 409: 714–720. PMID:11217860
37. Tropepe V, Sibilia M, Ciruna BG, Rossant J, Wagner EF, van der Kooy D. Distinct neural stem cells pro-liferate in response to EGF and FGF in the developing mouse telencephalon. Dev Biol. 1999; 208: 166–188. PMID:10075850
38. Nadarajah B, Parnavelas JG. Modes of neuronal migration in the developing cerebral cortex. Nat Rev Neurosci. 2002; 3: 423–432. PMID:12042877
39. Molyneaux BJ, Arlotta P, Menezes JR, Macklis JD. Neuronal subtype specification in the cerebral cor-tex. Nat Rev Neurosci. 2007; 8: 427–437. PMID:17514196
40. Hirai S, Cui de F, Miyata T, Ogawa M, Kiyonari H, Suda Y, et al. The c-Jun N-terminal kinase activator dual leucine zipper kinase regulates axon growth and neuronal migration in the developing cerebral cortex. J Neurosci. 2006; 26: 11992–12002. PMID:17108173
41. Sawada T, Jing X, Zhang Y, Shimada E, Yokote H, Miyajima M, et al. Ternary complex formation of EphA4, FGFR and FRS2alpha plays an important role in the proliferation of embryonic neural stem/pro-genitor cells. Genes Cells. 2010; 15: 297–311. doi:10.1111/j.1365-2443.2010.01391.xPMID:
20184660
42. Pasquale EB. Eph receptor signalling casts a wide net on cell behaviour. Nat Rev Mol Cell Biol. 2005; 6: 462–475. PMID:15928710
43. Vaccarino FM, Schwartz ML, Raballo R, Nilsen J, Rhee J, Zhou M, et al. Changes in cerebral cortex size are governed by fibroblast growth factor during embryogenesis. Nat Neurosci. 1999; 2: 246–253.
PMID:10195217
44. Ford-Perriss M, Abud H, Murphy M. Fibroblast growth factors in the developing central nervous system. Clin Exp Pharmacol Physiol. 2001; 28: 493–503. PMID:11422214
45. Garel S, Huffman KJ, Rubenstein JL. Molecular regionalization of the neocortex is disrupted in Fgf8 hypomorphic mutants. Development. 2003; 130: 1903–1914. PMID:12642494
46. Storm EE, Rubenstein JL, Martin GR. Dosage of Fgf8 determines whether cell survival is positively or negatively regulated in the developing forebrain. Proc Natl Acad Sci U S A. 2003; 100: 1757–1762.
PMID:12574514
47. Cholfin JA, Rubenstein JL. Patterning of frontal cortex subdivisions by Fgf17. Proc Natl Acad Sci U S A. 2007; 104: 7652–7657. PMID:17442747
48. Lemmon MA, Schlessinger J. Cell signaling by receptor tyrosine kinases. Cell. 2010; 141: 1117–1134.
doi:10.1016/j.cell.2010.06.011PMID:20602996
49. Hu MC, Kuro-o M, Moe OW. Renal and extrarenal actions of Klotho. Semin Nephrol. 2013; 33: 118–
129. doi:10.1016/j.semnephrol.2012.12.013PMID:23465499
50. Bottcher RT, Pollet N, Delius H, Niehrs C. The transmembrane protein XFLRT3 forms a complex with FGF receptors and promotes FGF signalling. Nat Cell Biol. 2004; 6: 38–44. PMID:14688794 51. Tsang M, Friesel R, Kudoh T, Dawid IB. Identification of Sef, a novel modulator of FGF signalling. Nat
Cell Biol. 2002; 4: 165–169. PMID:11802164
52. Noctor SC, Martinez-Cerdeno V, Kriegstein AR. Distinct behaviors of neural stem and progenitor cells underlie cortical neurogenesis. J Comp Neurol. 2008; 508: 28–44. doi:10.1002/cne.21669PMID:
18288691
53. Wang X, Tsai JW, LaMonica B, Kriegstein AR. A new subtype of progenitor cell in the mouse embryonic neocortex. Nat Neurosci. 2011; 14: 555–561. doi:10.1038/nn.2807PMID:21478886
![Fig 3. RGC proliferation and differentiation in the cerebral cortex. A–I, Anterior coronal sections from mutant and control mice were immunostained for a marker of RGCs (PAX6, green) and for a marker of young differentiated neurons (βIII tubulin [TUBB3], r](https://thumb-eu.123doks.com/thumbv2/123dok_br/16344042.189091/10.918.51.770.104.1028/proliferation-differentiation-cerebral-anterior-sections-immunostained-differentiated-neurons.webp)