in the Lungs of Live Mice Infected with Cystic Fibrosis
Pathogens
Seong-Won Nam1, Xiaoqiang Chen1,2, Jeesun Lim1, So Hyun Kim1, Sang-Tae Kim3, You-Hee Cho4, Juyoung Yoon1,2*, Sungsu Park1,5*
1Department of Chemistry and Nano Science, Ewha Womans University, Seoul, Korea,2Department of Bioinspired Science, Ewha Womans University, Seoul, Korea,
3Division of Life and Pharmaceutical Sciences, Ewha Womans University, Seoul, Korea,4Department of Pharmacy, CHA University, Gyeonggi, Korea,5Mechanobiology Institute (MBI), National University of Singapore (NUS), Singapore, Singapore
Abstract
Background:Pseudomonas aeruginosa(PA) andBurkholderia cepaciacomplex (Bcc), commonly found in the lungs of cystic fibrosis (CF) patients, often produce cyanide (CN), which inhibits cellular respiration. CN in sputa is a potential biomarker for lung infection by CF pathogens. However, its actual concentration in the infected lungs is unknown.
Methods and Findings:This work reports observation of CN in the lungs of mice infected with cyanogenic PA or Bcc strains using a CN fluorescent chemosensor (49,59-fluorescein dicarboxaldehyde) with a whole animal imaging system. When the CN chemosensor was injected into the lungs of mice intratracheally infected with either PA orB. cepaciastrains embedded in agar beads, CN was detected in the millimolar range (1.8 to 4 mM) in the infected lungs. CN concentration in PA-infected lungs rapidly increased within 24 hours but gradually decreased over the following days, while CN concentration inB. cepacia-infected lungs slowly increased, reaching a maximum at 5 days. CN concentrations correlated with the bacterial loads in the lungs.In vivoefficacy of antimicrobial treatments was tested in live mice by monitoring bacteriogenic CN in the lungs.
Conclusions:Thein vivoimaging method was also found suitable for minimally invasive testing the efficacy of antibiotic compounds as well as for aiding the understanding of bacterial cyanogenesis in CF lungs.
Citation:Nam S-W, Chen X, Lim J, Kim SH, Kim S-T, et al. (2011)In VivoFluorescence Imaging of Bacteriogenic Cyanide in the Lungs of Live Mice Infected with Cystic Fibrosis Pathogens. PLoS ONE 6(7): e21387. doi:10.1371/journal.pone.0021387
Editor:Tanya Parish, Queen Mary University of London, United Kingdom
ReceivedFebruary 9, 2011;AcceptedMay 26, 2011;PublishedJuly 7, 2011
Copyright:ß2011 Nam et al. This is an open-access article distributed under the terms of the Creative Commons Attribution License, which permits unrestricted use, distribution, and reproduction in any medium, provided the original author and source are credited.
Funding:This work was equally supported by the National Research Foundation of Korea (NRF) grants funded by the Korean Government (MEST) (Science Research Center program 20100001480: National Research Lab program 2010-0018895: World Class University Program R31-2008-000-10010-0: Basic Science Research Program R01-2008-000-20593-0). The first author was supported by Research Program-Grant 2010 of Ewha Womans University. The funders had no role in study design, data collection and analysis, decision to publish, or preparation of the manuscript.
Competing Interests:The authors have declared that no competing interests exist. * E-mail: nanopark@ewha.ac.kr (SP); jyoon@ewha.ac.kr (JY)
Introduction
Cystic fibrosis (CF) is the most common genetic disease in Caucasians [1]. Its main clinical features are excessive mucus production, airway obstruction, chronic airway infection and chronic inflammation, leading to severe bronchiectasis, irrevers-ible lung damage and respiratory failure. Pseudomonas aeruginosa
(PA) is the most common pathogen and is detected in 60–80% of patients’ cultures according to age [2]. PA releases virulence factors that induce pulmonary deterioration in the lungs of CF patients [3], including exotoxin A, elastase, LasA protease and pyocyanin [4]. Burkholderia cepacia complex (Bcc), a group of at least nine species including B. cepacia, is more dangerous to CF patients than PA [5]. Bcc infection leads to the rapid deterioration of a patient’s condition, termed ‘cepacia syndrome’, and approximately 20% of these patients die from high fevers, bacteremia and severe necrotizing pneumonia [6]. Bcc’s innate multi-drug resistance to antibiotics is often associated with the high mortality rates [3]. Bcc produces a variety of virulence
factors, such as proteases, lipases, hemolysins and exopolysac-chride (EPS) [3].
Most PA and Bcc strains are capable of producing cyanide (CN) [7,8], which binds ferric iron and inhibits the function of cytochrome c oxidase in mitochondria. The lungs of CF patients are typically in a microaerobic condition, where cyanogenic pathogens survive through anaerobic respiration that can increase CN production [7,9]. Although studies have not yet determined whether CN alone aggravates the conditions of CF patients, growing evidence suggests that it may be a predictor of PA infection in the CF lung [10,11]. CN has been detected up to 130mM in the sputa of CF and non-CF bronchiectasis patients
infected with PA [10] and has not been detected in the sputa of patients without PA infection [10,11]. However, monitoring the amount of CN produced by microorganisms in the lung is not easy because sputum samples are not easily obtained from either pediatric patients or small animals, such as mice.
infected organs,in vivomolecular imaging [12] offers noninvasive insight into living organisms and provides spatial and temporal information of disease-related changes in the body. Optical molecular imaging [13,14] can detect light emitted from chemiluminescent or fluorescent probes and is relatively safe, cheap and easy to handle compared with MRI or nuclear imaging. Fluorescent chemosensors selectively bind to ions [15] or metals [16], changing their emission or excitation/emission profiles. This property has been exploited to study cell physiologies, such as heavy metal transitions [16]. CN specific chemosensors were developed [17–20], but their application was limited to detecting CN in environmental samples, such as water. Recently, we have successfully visualized CN in the nematode Caenorhabditis elegans
using chemosensors [21,22].
In this study, CN production was monitored and quantified in the lungs of mice infected with PA orB. cepaciastrains. For chronic infections, mice were intratracheally infected with these strains embedded in agar beads [23,24]. An ‘‘off-on’’ type CN chemosensor was directly injected into the lungs before the whole animal imaging. The effects of antimicrobial compounds on CN production were visualized as well.
Materials and Methods
Synthesis and fluorescent assays of the CN sensor
The sensor was synthesized by a previously reported method [25]. Fluorescein (4 g, 12 mmol), 10 mL CHCl3, 6 mL CH3OH
and 0.06 g 15-crown-5 were placed in a 100 mL flask to which 20 g 50% NaOH solution was carefully added at 55uC. The mixture was stirred for 5 h. After cooling, it was acidified with 10 M H2SO4. The precipitates were collected and dried in
vacuum. Finally, the white solid product (142 mg, yield 3.0%) was obtained by chromatography on a silica gel column using CH3COOCH2CH3/CH2Cl2 (5:95, v/v) as eluent. Fluorescent
assays used test solutions of the sensor (3mM) and a various
concentration of the sodium salts of different anions (CN2, H2PO42, HSO42, NO32, CH3CO22, F2, Cl2, Br2 and I2) in
HEPES buffer (0.01 M, pH 7.4, 33% CH3CN). Fluorescence
emission spectra were obtained using a RF-5301/PC spectro-fluorophotometer (Shimadzu Co.).
Bacterial strains and CN determination in the bacterial culture
All PA strains were grown overnight in LB medium (BD) at 37uC and 220 rpm. The mutant required gentamicin (Sigma Chemical Co.). Supernatants were harvested at the optical density, OD600= 0.9 and CN was assayed using SpectroquantH CN
detection kits (Merck).
B. cepacia (KCTC 2966) was obtained from the Biological Resource Center (Daejeon, Korea). It was grown in 470 bacteria culture medium (Sigma-Aldrich) at 30uC and 220 rpm. The supernatant was harvested at OD600= 2.6 and CN was assayed
with the kit. To determine the amount of CN produced fromB. cepacia biofilm, 12 mL of a 1:10 dilution of the culture (OD600= 0.5) was inoculated in a Petri dish containing 48 g of
glass beads and CN was trapped in a separate dish containing 4 M NaOH as described previously [8]. CN trapped in NaOH was assayed using the CN detection kits (Merck).
Introduction of NaCN to the lungs
6-week-old female BALB/c nude mice (17 to 19 g) were purchased from Orientbio Inc. (Seongnam, Korea). They were treated in accordance with the university’s guidelines. The mice were anesthetized by intraperitoneal (i.p.) injection with 10mL
(each 0.25 mg tiletamine, zolazepam) zoletilH50 (Virbac, Carros, France) using an insulin syringe (Shinchang medical co., Gumi, Korea). Then, 40mL of various concentrations of NaCN (0.1 mM–1 M) were injected into their lungs using a syringe.
Infection with PA orB. cepacia
50mL of bacterial suspension in agar beads containing approximately 4.56106CFU was inoculated into the anesthetized
mice via intratracheal instillation [23,24] using a 24-gauge catheter (BD).
In vivoimaging
A multimodal-imaging system IS4000MM (Kodak) was used at 465 nm and an emission at 535 nm. After 40mL of the CN sensor (1 mM) was injected into the lungs of the anesthetized mice, the animals were exposed for 10 sec. Two rectangular regions of interest (ROI) with dimensions of 280 pixels (width)6222 pixels
(height) were manually drawn on each animal image with a dimension of 800 pixels (width)61,400 pixels (height) using the
program Image J (NIH, USA). One of the regions was the infectious or affected area, covering the lobes, for the signal intensity; the other ROI, outside the infectious area, was for background intensity. The value of the background intensity was subtracted from the signal intensity in order to obtain the normalized signal intensity from each image.
Ex vivoimaging of CN and biofilm in the lungs
20mm thick lung samples on glass slides [26] were incubated with the sensor (2mM) and TRITC (tetramethyl-rhodamine-isothiocyanate)-labeled concanavalin A (50mg/mL)
(Sigma-Al-drich) for 5 min. The images were obtained using a confocal laser scanning microscope (CLSM) (LSM510, Carl Zeiss) with 488 nm excitation and 505–530 nm emission filters for the sensor and 543 nm excitation and 560–615 nm emission filters for conca-navalin A-TRITC at 4006magnification.
In vivoefficacy testing of antimicrobial compounds and CN antidote
Ceftazidime, ciprofloxacin and patulin were purchased from Sigma-Aldrich. PA14-infected mice were treated with either ceftazidime [26] (200 mg/kg), through tail vein (i.v.) injection, or ciprofloxacin [26] (30 mg/kg), through oral administration, at 18 h after infection. Patulin [27] (50mg) was injected into the mice intraperitoneally (i.p.) once a day for 3 days. CN in the lung was imaged 6 h. after the treatments. The mice infected withB. cepacia
were treated with either ceftazidime (200 mg/kg, i.v.) or patulin (50mg, i.p.) 5 days after infection. Hydroxocobalamin (B12a) [28] was purchased from Sigma-Aldrich. B12a (70 mg/kg) was injected directly into the mouse lungs that had been either injected with 0.1 M NaCN or infected with PA14.
Bacterial load determinations
The lungs that were obtained from the sacrificed mice were homogenized in 1 ml of sterile PBS, plated in duplicates on BBLTM eosin methylene blue agar (BD) and incubated at 37uC for 18 h prior to CFU determinations.
Cell death in the infected lung tissue
TACSH 2 TdT-Fluor in situ apoptosis detection kit (Trevigen, Gaithersburg, MD, USA) was used to examine whether bacterio-genic CN induced apoptosis in the infected lungs. As a positive control, TACS-nuclease was added to tissue sections, which induced apoptosis. To examine necrotic cells, tissue sections were counter-stained with 1.5mM propidium iodide (Invitrogen).
Statistics
The data are reported as dot blots including every data points of n independent mice and independent experiments. Significant
difference was calculated with one-way analysis of variance (ANOVA) was with Bonferroni post-tests and defined asp,0.05 using an unpaired two-tailedttest [29] (Graphpad, La Jolla, CA, USA).
Results
Sensitivity and selectivity of CN sensor in solution
The title sensor 49,59-fluorescein dicarboxaldehyde (Fig. 1a), reported as an intermediate in previous work [30], was synthesized
Figure 1. Proposed mechanism of CN sensing with synthesized fluorescein dialdehyde as the CN sensor and the characterization of the sensor in aqueous solution.(a) CN ions selectively attack carbonyl groups of fluorescein dialdehyde and the phenol protons can be transferred to the developing alkoxide anion, resulting in the enhancement of fluorescence. (b) Fluorescence spectra of the sensor (3mM) with different concentrations of NaCN (1–1,000 eq.) in CH3CN/HEPES at room temperature. (c) Effect of pH on fluorescence spectra of the sensor (3mM) in
the absence of CN at room temperature in 100% water. (d) Fluorescence spectra of the sensor (3mM) with various anions (200 eq.) in CH3CN/HEPES at
room temperature. (e) Fluorescence intensity of the CN sensor (1 mM) with either supernatant obtained from PA14 culture in LB (O.D. = 3.3, pH 7.4), PBS (pH 7.4) containing pyocyanin (0.5 mM) or NaCN (1 mM). The graph represents the mean 6 standard deviation of three independent experiments. (f) Fluorescence intensity of the CN sensor (1 mM) with NaCN (0.1 M) in PBS (pH 7.4) in the absence or presence of B12a (2.5 mM). The graph represents the mean6standard deviation of three independent experiments.
and used as a CN sensor for the first time in this study to fluorescently observe CN in lungs. The sensing mechanism involved CN acting as a selective nucleophilic agent for o -hydroxy-substituted aromatic aldehyde [31] and could thus attack the carbonyl group, which was activated by phenol protons (Fig. 1a). Protons were then transferred from phenol hydrogen to the developing alkoxide anion, resulting in the fluorescence enhancement (Fig. 1a). In HEPES buffer (0.01 M, pH 7.4, 33% CH3CN), the enhancement of fluorescence depended on CN
concentration (Fig. 1b). In 100% water, there was no significant change in fluorescence intensities when pH was adjusted from 6.0 to 8.2 (Fig. 1c). The CN sensor selectively reacted with CN2ions among the various other anions in HEPES buffer, such as F2, Cl2, Br2, I2, H2PO42, HSO42, ClO42, NO32and CH3COO2
(Fig. 1d). The sensor did not react with PA14 supernatant or pyocyanin, a toxin produced by PA (Fig. 1e). Its reactivity with CN interfered with B12a [28], known to bind strongly with CN (Fig. 1f). Taken together, these results indicate that the sensor specifically binds to CN, enhancing its fluorescence in aqueous solution.
In vivofluorescence imaging of exogenous CN in mice
The sensor was prepared in dimethyl sulfoxide (DMSO), known to have low toxicity [32]. Before applying the CN sensor into mouse, its toxicity was tested by daily injecting 40mL of the sensor (1 mM) into the lungs of three mice for 10 days. The direct injection of the sensor into the lobes did not cause vomiting or
death. During the period, the injected mice did not show any differences in behavior relative to controls that had not been injected with the sensor (data not shown).
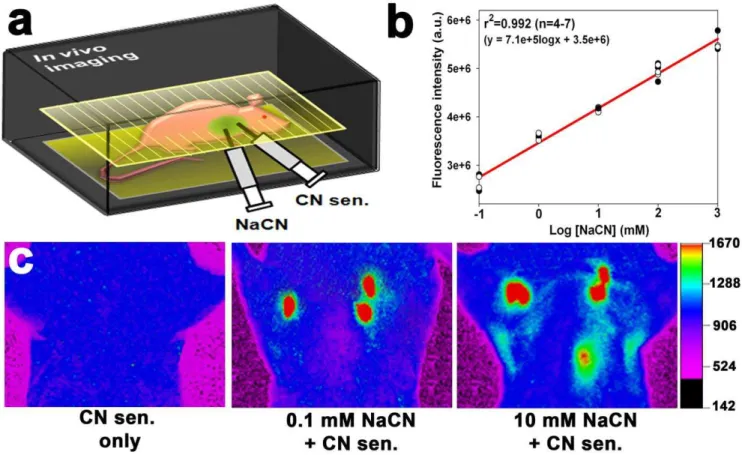
In the following experiments, 40mL of various concentrations of NaCN (0.1 mM–1 M) and 40mL of the CN sensor (1 mM) were injected into anesthetized mice (Fig. 2a). Whole animal imaging system was used to determine whether the sensor was capable of visualizing the exogenous CN in the lungs. Strong fluorescence was observed in lungs injected with NaCN (0.1 mM or higher), whereas the fluorescence was not observed in the lungs without NaCN (Fig. 2c and Figure S1), indicating that the sensor selectively reacted with CN in the lungs. Region of interest (ROI) analyses showed that the sensor’s fluorescence intensity the lungs exhibited a linear response with respect to the concentration of injected NaCN (Fig. 2b). The correlation coefficient of the linear regression was 0.992 for 4 to 7 independent measurements, and the detection limit was 0.1 mM NaCN (p= 0.0026). The reaction of the sensor with CN in mice was inhibited by B12a (Figure S2).
Short-termin vivoimaging of biogenic CN in the lungs of mice infected with PA orB. cepacia
To chronically infect the mouse lungs, mice were intratracheally infected with PA or B. cepacia strains embedded in agar beads [23,24] (Fig. 3a). As shown inFig. 3b, stronger fluorescence was observed in PA14 [33] - or PAO1 [34] -infected lungs, compared with either PA14 hcnC mutant [35] -, B. cepacia-infected or uninfected lungs (CN sensor only or PA14 supernatant), when
Figure 2.In vivoimaging of CN in the lungs of live mice using the CN sensor.(a) Experimental scheme for thein vivoimaging in the mouse lungs injected with NaCN. (b) Changes in fluorescence intensity as a function of NaCN concentration in the murine lungs. Four to seven mice were used per treatment, and each dot in the graph represents a background-subtracted fluorescence intensity obtained from a mouse in each treatment group after subtracting background fluorescence intensity. Total twenty seven mice were used. (c)In vivoimages of CN in the mouse lungs after injection with NaCN. The fluorescence intensity is shown in arbitrary units.
40mL of the CN sensor (1 mM) was directly injected into the lungs
at 18 h. after the infection. The dose-response curve (Fig. 2b) of the fluorescence signals in the lungs was used to estimate CN concentration in the lungs. Surprisingly, both PA strains produced millimolar concentrations (1.8 to 2.9 mM) of CN in the lung (Fig. 3c). Interestingly, the wild type PA14 produced stronger signals than wild type PAO1. Thesein vivodata were verified byex vivoimaging results (Fig. 3d), which exhibited a similar tendency in fluorescence intensity. The reaction of the sensor with CN in PA14-infected lungs was inhibited by B12a (Figure S2). Although intranasal application of the sensor appeared to be least invasive, it was not used in this study as it caused vomiting, and thus required a high volume (ca. 200mL) of the sensor in the infected mice (Figure S3). In contrast, direct injection of the sensor in the lung did not cause vomiting and 40mL of the sensor (1 mM) generated the highest signal to noise ratio to bacteriogenic CN (Figure S4).
Long-termin vivo imaging of biogenic CN in lungs of mice infected with PA orB. cepacia
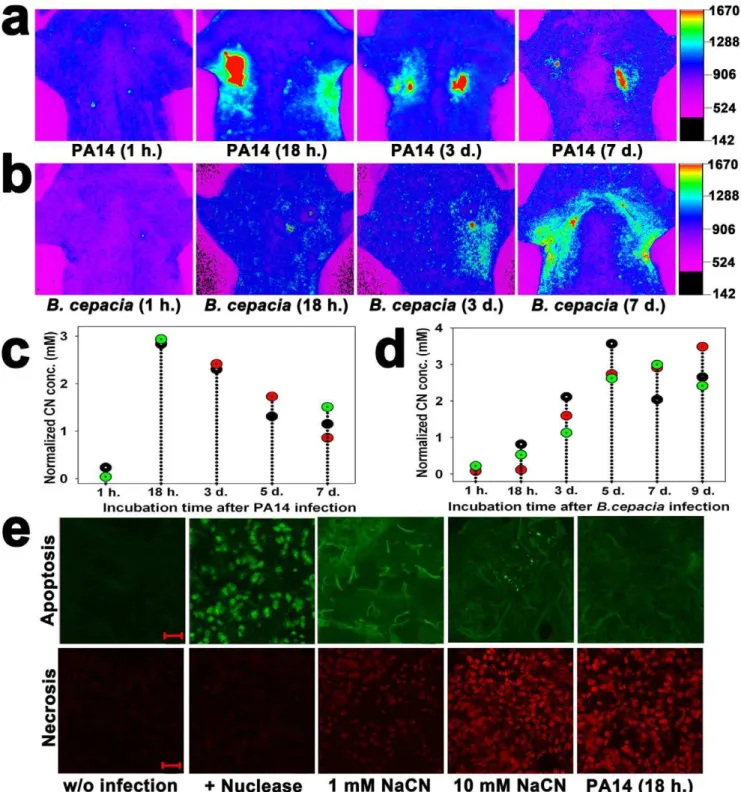
In vivoimaging was used to monitor CN production in the lungs of live mice infected with either wild type PA14 orB. cepaciastrains for up to 9 days. In PA14-infected lungs, CN concentration rapidly increased within 24 hours but gradually decreased over the following days (Fig. 4a,c). In contrast, inB. cepacia-infected lungs, CN concentration slowly increased, reaching a maximum at 5 days, after which it remained constant (Fig. 4b,d). Irrespective of this difference in CN production pattern between PA14 and B. cepacia strains, both strains were able to continuously produce millimolar concentrations of CN in the lung even 7 days after
infection (Fig. 4c,d), indicating that the lungs were chronically infected with the strains.
Tunnel assay showed that the apoptotic signal was stronger than the necrotic signal when lungs were injected with 1 mM NaCN, while the reverse occurred with injection of 10 mM NaCN (Fig. 4e), indicating that the mode of cell death depended on CN concentration. Lung sections of mice infected with PA14 for 18 h. also revealed stronger necrotic signals (Fig. 4e), implying that the CN concentration in the PA14-infected lungs was higher than 1 mM. CN concentration-dependent death mode has been reported in cultured primary rat cortical cells [36]. The ex vivo
imaging results show that the bacteria in the lungs produced a large amount of CN as well as EPS (Figure S5), a major constituent of bacterial biofilm.
In vivoefficacy of antimicrobial compounds against PA andB. cepacia infections
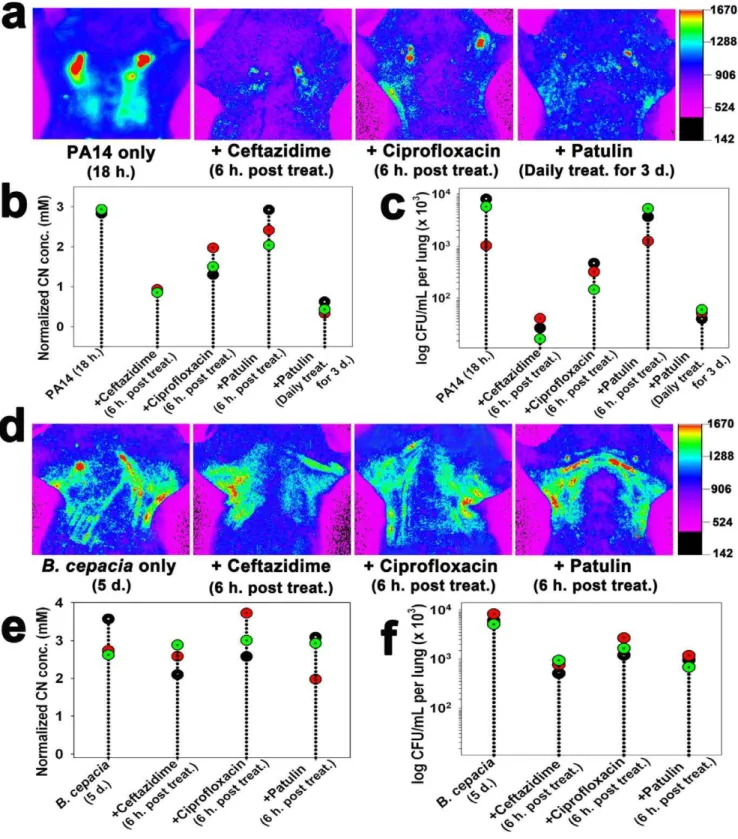
When mice infected with wild type PA14 were treated with either ceftazidime (200 mg/kg) or ciprofloxacin (30 mg/kg) [26] at 18 h. after infection, both CN production (Fig. 5a,b) and bacterial load (Fig. 5c) in the lungs significantly decreased (p,0.0001), indicating that the antibiotic treatments were effective against the lung infection. Both CN production and bacterial loads significantly decreased (p,0.0001) when mice infected with PA14 for 18 h were treated with patulin (50mg) [27], a fungal toxin that inhibits
bacterial communication, for 3 days intraperitoneally, indicating that the toxin was capable of inhibiting the infectionin vivo.
In contrast, the individual antibiotic treatments were not effective againstB. cepacia infection. Neither CN production nor
Figure 3.In vivoandex vivoimages of bacteriogenic CN in the lungs of live mice infected with PA orB. cepaciastrains.(a) Experimental scheme for thein vivoimaging of bacteriogenic CN in the murine lungs. (b)In vivoimages of CN in the lungs at 18 h. after infection. The images in the upper and lower panels are inverted fluorescence images and their corresponding reconstructed color images, respectively. (c) Quantification of the fluorescence intensity in the lungs of the infected mice. Every three mice were used per treatment and each dot in the graph represents a background-subtracted fluorescence intensity from a mouse in each treatment group. ANOVA with Bonferroni post-tests (p,0.0001, n = 15). (d) CLSM images of the cryo-sectioned lung tissue. Before imaging, 20mm thick lung tissue samples were incubated with the sensor (2mM) for 5 min. Scale bar = 50mm.
Figure 4. Long-term monitoring of CN production in the lungs of mice infected with PA14 orB. cepaciaand tunnel assays of the lung sections.(a)In vivoimages of CN at various incubation times (1 h.–7 days) after PA14 infection. (b)In vivoimages of CN at various incubation times (1 h.–7 days.) afterB. cepaciainfection. (c) Quantification of the fluorescence intensity in the PA14-infected lungs. Each dot represents a background-subtracted fluorescence intensity from a mouse in each treatment group, and every three mice were given each treatment (total n = 15). (d) Quantification of the fluorescence intensity in theB. cepacia-infected lungs. Each dot represents a background-subtracted fluorescence intensity from a mouse in each treatment group, and every three mice were given each treatment (total n = 18). (e) CLSM images of the 20mm thick cryo-sectioned lung tissue samples after tunnel assay using a TACSH2 TdT-Fluorin situapoptosis detection kit and incubation with 1.5mM propidium iodide. TACS-nuclease treatment before tunnel assay was used as a positive control. The sections from the murine lungs injected with 1, 10 mM NaCN or infected with PA14 for 18 h. Scale bar = 20mm.
bacterial loads significantly decreased in the infected lungs (Fig. 5d–f), indicating that the B. cepacia strain was resistant to all the antibiotic treatments.
Discussion
The CN sensor was highly specific for CN bothin vitroand in vivo. Only CN induced fluorescence enhancement of fluorescein dicarboxyaldehyde among various anions in aqueous solution (Fig. 1d). This selectivity was attributable to the specific reaction between the aldehyde group of the sensor and CN (Fig. 1a). The aldehyde group allows intramolecular hydrogen bonding, thereby facilitating nucleophilic attack from CN. The specificity of the sensor to CN in aqueous solution was further verified by results showing that its fluorescence response to CN was not affected by either PA14 supernatant or pyocyanin (Fig. 1e), while it was reduced by a CN antidote, B12a [28] (Fig. 1f). Similarly, hcnC
mutant strain did not induce any fluorescent signal in the infected lung (Fig. 3b,c) and B12a was able to interfere with the reaction of the sensor with CN in the lung (Figure S3), demonstrating the
in vivo specificity of the sensor to CN. It is expected that physiological pH (6.9) in the lung [37] would not affect the fluorescence response of the sensor, as there was no significant difference in the fluorescence intensities of the sensor over the pH range 6.0–8.2 (Fig. 1c). Using the sensor and whole animal imaging, concentrations as low as 0.1 mM NaCN were observed in the lung (Fig. 2).
The presence of CN at high concentrations (1.8 to 4 mM) allowed visualization of bacteriogenic CN in the lungs of live mice infected with PA orB. cepaciastrains. These strains in the lung produced more CN than they did in the planktonic culture (Table S1). CN production by PA orB. cepaciastrains might be enhanced by a microaerophilic condition in the infected lungs, where HCN synthases are highly activated [7,9]. The micro-aerophilic condition in the lung might have been contributed by biofilm formation (Figure S5). Especially,B. cepaciais known to produce CN only when it establishes mature biofilm [8]. This may explain why it did not produce detectable amounts of CN in the lung until 2–3 days after infection (Fig. 4b). Once it started to produce CN, its CN production was continued even at 9 day after infection (Fig. 4b,d). These results suggest that CF lung, which is microaerophilic, is suited for the cyanogenic bacteria to produce CN.
Cell death by necrosis (Fig. 4e) indicates the presence of millimolar CN in the infected lungs. It was shown that CN at 1 mM or higher concentrations caused necrosis in epithelial lung cells [38]. Other major virulence factors including pyocyanin in PA are known to apoptosis in the lung [39,40]. The CN concentration (2.9 mM) in the murine lungs infected with PA14 can be converted to be 1.7 mg/kg, a fifth of the lethal dose (8.4 mg/kg) in mice [41]. At this concentration, CN was capable of inhibiting cytochrome oxidase activity by up to 15%, causing unconsciousness in the mice for 10 to 60 min [42]. In fact, many of the infected mice vomited and did not eat for two days, some died (data not shown). Necrosis in the lung has been reported to enhance inflammation at the site of infection [43]. These data suggest that, along with other virulence factors,
biogenic CN in the lungs may have detrimental effects in CF patients.
CN concentration in the lungs was clearly related to the respective bacterial loads (Fig. 5), suggesting that bacteriogenic CN acted as a biomarker of the cyanogenic bacteria in the lungs. Information about the effective route of antibiotic administration, as well as thein vivoefficacy of the antibiotics, was obtained from this correlation (Fig. 5). PA14 was susceptible to b-lactam (e.g., ceftazidime) or fluoroquinolone (e.g., ciprofloxacin) antibiotics as well as patulin (Fig. 5a–c). Patulin inhibits quorum sensing [44], which allows bacteria to produce responses such as virulence factors or biofilm at a critical cell density. PA has been reported to be effectively cleared from mice by treatment with patulin [27]. In contrast,B. cepaciawas resistant to all the antimicrobial treatments (Fig. 5d–f). This is possible because it hasb-lactamase as well as antibiotic efflux system [45]. These results suggest that the current CN imaging method is suitable for testing thein vivo efficacy of antibacterial compounds and CN inhibitors. The method has several advantages in testing antibiotic susceptibility of PA in vivo over the in vivo imaging method using luciferase-tagged isolates [46,47]. Unlike the latter, the former does not require a construction of a strain carrying the luciferase gene and its fluorescence signal is not affected by exhaustion of flavin mononucleotide, which is a substrate of luciferase [46,47].
Collectively, these results suggest that the chemosensor-basedin vivoimaging method is useful for fast and convenient animal testing of drug efficacy against the PA andB. cepaciainfections as well as understanding cyanogenesis in CF lungs. In future, a CFTR-deficient murine model [48] could be used to elucidate the pathological role of biogenic CN in CF patients.
Supporting Information
Figure S1 Representative in vivo inverted fluorescence images and their corresponding reconstructed color images (top and bottom respectively) of the mice that were injected with various concentrations of NaCN (0.1 mM–1 M). Then, 40 uL of the CN sensor (1 mM) were injected into the lung of the mice forin vivo
imaging. (DOCX)
Figure S2 Inhibition of exogenous and bacteriogenic CN by a CN antidote, hydroxocobalamin (B12a). The mice were either injected with 40mL of NaCN (0.1 M) or infected with PA14 for 18 h. Then, 40mL of B12a (70 mg/kg, 24.9 mM) were addition-ally injected into the mice before the imaging.
(DOCX)
Figure S3 In vivoimaging of CN in the lung of PA14-infected mice using the cyanide sensor with the intranasal application. (a) A 24-gauge catheter containing 50mL of the cyanide sensor (1 mM) was introduced into the nostril of the mouse that was not infected with PA14 (control). 50–200mL of the CN sensor (1 mM) was injected into the lung of PA14-infected mice through the intranasal application at 18 h. post infection. (b) Changes in the fluorescence intensity as a function of the volume (50 to 200mL) of the CN sensor that was introduced through the
intranasal application into the lungs of the mice infected with
intraperitoneally administered (i.p.) daily for 5 days after infection. (e) Quantification of the fluorescence intensity in the lungs of theB. cepacia -infected mice treated with antibiotics. Each dot represent a CN concentration from a mouse in each treatment group and three mice were used per each treatment (total n = 12). ANOVA with Bonferroni post-tests (p= 0.8760). (f)B. cepacialoads in the lungs treated with the antibiotics. Each data point represents the mean CFU of four different lung samples from independent mice and three independent experiments were performed per treatment. ANOVA with Bonferroni post-tests (p= 0.1040).
PA14. All of the data are given as the mean 6 s.d. of n independent measurements.
(DOCX)
Figure S4 Effect of the volume of the CN sensor on in vivo
cyanide imaging. (a) Various volumes (0–100mL) of the CN sensor
(1 mM) were injected into the lung of mice infected with PA14. The images in the upper and lower panels are the inverted fluorescence images and their corresponding reconstructed color images, respectively. (b) Changes in the fluorescence intensity as a function of the injected volume of the cyanide sensor in the lung of mice infected with PA14. (c) Signal to noise (S/N) ratio of the fluorescence signal in the mouse lungs with respect to the injected volume of the cyanide sensor. The S/N ratio was defined as the ratio of the fluorescent signal value in the mouse lung infected with PA14 to the signal value without the PA14 infection. All of the data are given as the mean 6 standard deviations (s.d.) of n independent measurements.
(DOCX)
Figure S5 Ex vivoimaging of CN and biofilm in the lungs of the mice infected with PA14 or B. cepacia strains for various times. CLSM images of the 20mm thick cryo-sections incubated with 2mM CN sensor for 5 min and 50mg/mL concanavalin
A-TRITC for 5 min. The surface plot image of merged images was obtained using ImarisTMprogram. Scale bar220mm.
(DOCX)
Table S1 CN production in liquid and solid cultures and murine lungs by PA andB. cepaciastrains. CN in the liquid cultures was determined using the SpectroquantH method* in triplicate (at OD600= 0.9 for PA, 2.6 for B. cepacia). CN in the solid cultures
containing glass beads were trapped in 4 M NaOH and measured using the method described above. Means6standard deviations of three independent experiments are shown (n. d. = not detected). Biogenic CN in the lungs previously infected with PA and B. cepacia was determined from the images using a multimodal-imaging system (IS4000MM, Kodak). The standard curve (Fig. 2b) was used to determine the concentration of biogenic CN in the lungs infected with either PA orB. cepacia. *Detailed description in the methods.
(DOCX)
Author Contributions
Conceived and designed the experiments: SP JY. Performed the experiments: S-WN XC. Analyzed the data: S-WN XC SP JY. Contributed reagents/materials/analysis tools: JL SHK S-TK Y-HC. Wrote the paper: S-WN XC SP JY.
References
1. Ratjen F, Doring G (2003) Cystic fibrosis. Lancet 361: 681–689.
2. FitzSimmons SC (1993) The changing epidemiology of cystic fibrosis. J Pediatr 122: 1–9.
3. Govan JRW, Deretic V (1996) Microbial pathogenesis in cystic fibrosis: mucoid Pseudomonas aeruginosaandBurkholderia cepacia. Microbiol Rev 60: 539–574. 4. Brint JM, Ohman DE (1995) Synthesis of multiple exoproducts inPseudomonas
aeruginosais under the control of RhlR-RhLI, another set of regulators in strain PAO1 with homology to the autoinducer-responsive LuxR-LuxI family. J Bacteriol 177: 7155–7163.
5. Speert DP, Henry D, Vandamme P, Corey M, Mahenthiralingam E (2002) Epidemiology ofBurkholderia cepacia complex in patients with cystic fibrosis, Canada. Emerg Infect Dis 8: 181–187.
6. Isles A, Maclusky I, Corey M, Gold R, Prober C, et al. (1984)Pseudomonas cepacia infection in cystic fibrosis: an emerging problem. J Pediatr 104: 206–210. 7. Castric PA (1994) Influence of oxygen on thePseudomonas aeruginosahydrogen
cyanide synthase. Curr Microbiol 29: 19–21.
8. Ryall B, Lee X, Zlosnik JEA, Hoshino S, Williams HD (2008) Bacteria of the Burkholderia cepaciacomplex are cyanogenic under biofilm and colonial growth conditions. BMC Microbiol 8: 108.
9. Cody WL, Pritchett CL, Jones AK, Carterson AJ, Jackson D, et al. (2009) Pseudomonas aeruginosaAlgR controls CN production in an AlgZ-dependent manner. J Bacteriol 191: 2993–3002.
10. Ryall B, Davies JC, Wilson R, Shoemark A, Williams HD (2008)Pseudomonas aeruginosa, cyanide accumulation and lung function in CF and non-CF bronchiectasis patients. Eur Respir J 32: 740–747.
11. Enderby B, Smith D, Carroll W, Lenney W (2009) Hydrogen cyanide as a biomarker forPseudomonas aeruginosain the breath of children with cystic fibrosis. Pediatr Pulmonol 44: 142–147.
12. Richard J-C, Chen DL, Ferkol T, Schuster DP (2004) Molecular imaging for pediatric lung diseases. Pediatr Pulmonol 37: 286–296.
13. Leevy WM, Serazin N, Smith BD (2007) Optical imaging of bacterial infection models. Drug Discov Today Dis Model 4: 91–97.
14. Leevy WM, Gammon ST, Jiang H, Johnson JR, Maxwell DJ, et al. (2006) Optical imaging of bacterial infection in living mice using a fluorescent near-infrared molecular probe. J Am Chem Soc 128: 16476–16477.
15. Soh N (2006) Recent advances in fluorescent probes for the detection of reactive oxygen species. Anal Bioanal Chem 386: 532–543.
16. Domaille DW, Que EL, Chang CJ (2008) Synthetic fluorescent sensors for studying the cell biology of metals. Nat Chem Biol 4: 168–175.
17. Xu Z, Chen X, Kim HN, Yoon J (2010) Sensors for the optical detection of cyanide ion. Chem Soc Rev 39: 127–137.
18. Ren J, Zhu W, Tian H (2008) A highly sensitive and selective chemosensor for cyanide. Talanta 75: 760–764.
19. Ekmekci Z, Yilmaz MD, Akkaya EU (2008) A monostyryl-boradiazaindacene (BODIPY) derivative as colorimetric and fluorescent probe for cyanide ions. Org Lett 10: 461–464.
20. Lou X, Zhang L, Qin J, Li Z (2008) An alternative approach to develop a highly sensitive and selective chemosensor for the colorimetric sensing of cyanide in water. Chem Commun. pp 5848–5850.
21. Chung S-Y, Nam S-W, Lim J, Park S, Yoon J (2009) A highly selective cyanide sensing in water via fluorescence change and its application toin vivoimaging. Chem Commun. pp 2866–2868.
22. Chen X, Nam S-W, Kim G-M, Song N, Jeong Y, et al. (2010) A near-infrared fluorescent sensor for detection of cyanide in aqueous solution and its application for bioimaging. Chem Commun. pp 8953–8955.
23. Iwata M, Sato A (1991) Morphological and immunohistochemical studies of lungs and bronchus-associated lymphoid tissue in a rat model of chronic pulmonary infection withPseudomonas aeruginosa. Infect Immun 59: 1514–1520. 24. Kukavica-Ibrulj I, Bragonzi A, Winstanley C, Sanschagrin F, OToole G, et al.
(2008)In vivogrowth ofPseudomonas aeruginosastrains PAO1 and PA14 and the hypervirulent strain LESB58 in a rat model of chronic lung infection. J Bacteriol 190: 2804–2813.
25. Wang W, Rusin O, Xu X, Kim KK, Escobedo JO, et al. (2005) Detection of homocysteine and cysteine. J Am Chem Soc 127: 15949–15958.
26. Doring G, Conway SP, Heijerman HGM, Hodson ME, Hoiby N, et al. (2000) Antibiotic therapy againstPseudomonas aeruginosain cystic fibrosis: a European consensus. Eur Respir J 16: 749–767.
27. Rasmussen TB, Skindersoe ME, Bjarnsholt T, Phipps RK, Christensen KB, et al. (2005) Identity and effects of quorum-sensing inhibitors produced by Penicilliumspecies. Microbiology 151: 1325–1340.
28. Howland MA (2006) Antidotes in depth: Hydroxocobalamin. In: Flomenbaum NE, Goldfrank LR, Hoffman RS, Howland MA, Lewin NA, Nelson LS, eds. Goldfrank’s toxicologic emergencies. New York: McGRAW-HILL. pp 1731–1733.
29. McCarthy WF, Thompson DR (2007) The analysis of pixel intensity (myocardial signal density) data: the quantification of myocardial perfusion by imaging methods. COBRA Preprint Series: Article 23.
30. Burdette SC, Walkup GK, Spingle B, Tsien RY, Lippard SJ (2001) Fluorescent sensors for Zn2+ based on a fluorescein platform: synthesis, properties and intracellular distribution. J Am Chem Soc 123: 7831–7841.
31. Lee KS, Kim HJ, Kim GH, Shin I, Hong JI (2008) Fluorescent chemodosimeter for selective detection of cyanide in water. Org Lett 10: 49–51.
32. Smith ER, Hadidian Z, Mason MM (1967) The single-and repeated-dose toxicity of dimethyl sulfoxide. Ann N Y Acad Sci 141: 96–109.
33. Rahme LG, Stevens EJ, Wolfort SF, Shao J, Tompkins RG, et al. (1995) Common virulence factors for bacterial pathogenicity in plants and animals. Science 268: 1899–1902.
34. Heo Y-J, Ko KS, Song J-H, Cho Y-H (2005) Profiling pyocins and competitive growth advantages of variousPseudomonas aeruginosastrains. J Microbiol Biotech 15: 1368–1376.
35. Liberati NT, Urbach JM, Miyata S, Lee DG, Drenkard E, et al. (2006) An ordered, nonredundant library ofPseudomonas aeruginosastrain PA14 transposon insertion mutants. Proc Natl Acad Sci USA 103: 2833–2838.
36. Li L, Prabhakaran K, Mills EM, Borowitz JL, Isom GE (2005) Enhancement of cyanide-induced mitochondrial dysfunction and cortical cell necrosis by uncoupling protein-2. Toxicol Sci 86: 116–124.
38. Vock EH, Lutz WK, Hormes P, Hoffmann HD, Vamvakas S (1998) Discrimination between genotoxicity and cytotoxicity in the induction of DNA double-strand breaks in cells treated with etoposide, melphalan, cisplatin, potassium cyanide, Triton X-100, and gamma-irradiation. Mutat Res 413: 83–94.
39. Muller M (2006) Premature cellular senescence induced by pyocyanin, a redox-activePseudomonas aeruginosatoxin. Free Radic Biol Med 41: 1670–1677. 40. Rajan S, Cacalano G, Bryan R, Ratner AJ, Sontich CU, et al. (2000)Pseudomonas
aeruginosainduction of apoptosis in respiratory epithelial cells: analysis of the effects of cystic fibrosis transmembrane conductance regulator dysfunction and bacterial virulence factors. Am J Respir Cell Mol Biol 23: 304–312. 41. Yamamoto H (1995) Effect of atropine on cyanide-induced acute lethality in
mice. Toxicol Lett 80: 29–33.
42. Schubert J, Brill WA (1968) Antagonism of experimental cyanide toxicity in relation to thein vivoactivity of cytochrome oxidase. J Pharmacol Exp Therap 162: 352–359.
43. Boat TF, Welsh MJ, Beaudet AL (1989) Cystic fibrosis. In: Scriver CR, Beaudet AL, Sly WS, Valle D, eds. The metabolic basis of inherited disease. New York: McGRAW-HILL. pp 2649–2680.
44. Park S, Wolanin PM, Yuzbashyan EA, Silberzan P, Stock JB, et al. (1995) Motion to forms quorum. Science 301: 188.
45. Drevinek P, Holden MTG, Ge Z, Jones AM, Ketchell I, et al. (2008) Gene expression changes linked to antimicrobial resistance, oxidative stress, iron depletion and retained motility are observed whenBurkholderia cenocepaciagrows in cystic fibrosis sputum. BMC Infect Dis 8: 121.
46. Kadurugamuwa JL, Sin L, Albert E, Yu J, Francis K, et al. (2003) Direct continuous method for monitoring biofilm infection in a mouse model. Infect Immun 71: 882–890.
47. Demidova TN, Gad F, Zahra T, Francis KP, Hamblin MR (2005) Monitoring photodynamic therapy of localized infections by bioluminescence imaging of genetically engineered bacteria. J Photochem Photobiol B: Biol 81: 15–25. 48. Teichgraber V, Ulrich M, Endlich N, Riethmuller J, Wilker B, et al. (2008)