“Will it Catch Their Attention?” - Evaluating Situated
and Peripheral Displays in a Personal Context
Florian Güldenpfennig, Roman Ganhör and Geraldine Fitzpatrick
Vienna University of Technology (TU Wien) Argentinierstrasse 8/187, 1040 Vienna, Austria
{florian.gueldenpfennig, roman.ganhoer, geraldine.fitzpatrick}@tuwien.ac.at
Abstract. Connecting people with technology is an important challenge in HCI and ubiquitous computing. Digital photo frames are a popular class of private situated displays particularly aimed at this purpose. However, their evaluation can be challenging as a significant amount of interaction takes place by looking at the device, i.e., without direct user input. In addition, a photo display can effect people’s perception, without it being at the centre of focussed attention. For tracking use without explicit input and getting a sense of the users’ peripheral perception - and hence the users’ potential awareness of situated displays - we therefore propose a lightweight, unobtrusive and affordable method named Trackaware, drawing on advances in camera hardware and software. We are particularly interested in how researchers and study participants engage with this method and what insights they can obtain. We studied Trackaware involving 61 participants, and our findings suggest that Trackaware can be a strong method for complementing existing evaluation techniques, e.g., in a data triangulation strategy. It should be useful for investigating digital photo frames and other visual peripheral displays, particularly in personal contexts.
Keywords: field deployment, evaluation, peripheral awareness, peripheral display, personal context, photo display, privacy, qualitative study, trust;
1 Introduction
Ever since its inception, HCI and ubiquitous computing have been concerned with connecting people through technology. To this end, researchers and designers successfully employed small private situated displays, for example, digital photo frames [1]. We have a particular interest in this area of research and have designed various prototypes incorporating photos to establish a sense of connectedness between people [2, 3]. For example, we have created an application for mobile camera-phones that could be used to capture and send images to a digital photo frame located at some friend’s or family member’s house. In our research, this photo display (we named it
evaluation of these interventions, we faced significant challenges in the assessment due to the nature of interactions and the private spaces in which PhotoFrame was used. Digital photo frames can be regarded as peripheral displays and as such interaction is often ‘non-explicit’ (i.e., no touch interaction etc.) by simply looking at the device and, being in the periphery, often people are not even conscious of the interaction (see related work section for notes on the terminology). There is no mandatory need for explicit interactions such as, for example, touch-screen based user input. While explicit input is relatively easy to evaluate, for example, by recording a log file, interaction without explicit input or with only peripheral perception is disproportionately harder to register, in particular on the longer-term and in natural settings. Still, non-explicit interaction is a crucial component of photo and other peripheral displays. One criteria for (peripheral) perception to occur is being in the vicinity (i.e., being ‘aware’ of the screen to some extent). To unobtrusively monitor and evaluate the potential of our photo displays to attract attention and awareness, we created a lightweight and affordable method we named Trackaware.
Trackaware embodies a technique based on a small camera built into the display frame and draws on image understanding and face detection algorithms. However, the camera does not permanently record photo or film. Rather, the technique can be seen as a ‘smart motion sensor’. We will explain Trackaware in detail in section 3.
Scope and Article Structure: In this article we are interested in how Trackaware can be used as an evaluation method for tracking the users’ potential attention for and awareness of visual (peripheral) displays, and how Trackaware is received by both researchers and participants. Specifically, we designed and implemented this method to support the evaluation of a particular class of digital photo frames that we made (PhotoFrame), where the amount of attention the devices obtained was an important factor in evaluating the success of the design. These PhotoFrame devices were to be populated automatically with photos, which were sent by mobile phones. In this article, the sending of photos is not in scope. Rather, we focus on Trackaware as a method for the evaluation of peripheral situated displays from the perspective of the researchers. We also investigate potential privacy issues and similar reservations from the point of view of the participants.
In summary, we are interested in exploring the specific value of Trackaware for researchers conducting field deployments with situated displays and in the acceptance of the users. Hence, our research questions are (1) what can researchers learn from Trackaware regarding focussed attention and peripheral perception (awareness) in peripheral displays in personal contexts? (2) Howdo the participants experience the method and do they have any particular reservations regarding Trackaware?
group of researchers, and the users of the peripheral displays (PhotoFrame) in general thought that the level of intrusiveness of the method was acceptable.
2 Related Work
The present research is focussed on evaluation techniques, and it is primarily related with two themes in the HCI literature. (1) Most importantly, it refers to and extends research dealing with evaluation methods for different kinds of (mostly visual) displays. Here, techniques for obtaining data under naturalistic conditions are of particular interest. (2) Thematically, our research is also located in the field of peripheral interaction and peripheral perception [4]. We go on to briefly outline the second theme at first, as this order is useful for introducing relevant terms to the reader.
2.1 Peripheral Perception and Peripheral Displays
The notion of peripheral displays has been used for labelling ubiquitous or calm computing technology, which “will move easily from the periphery of our attention, to the center, and back”, quoting Weiser and Brown [5, p.79]. That is, technology that might be embedded into our environment and support us without binding cognitive resources, unless we explicitly want to focus on it. Such displays or designs often rely on sound, light or movement integrated in the surrounding. Digital photo displays as investigated in this article can also be regarded as peripheral displays, given the fact that they do not require focussed attention, but such attention can be paid as people choose to.
For example, Mynatt and colleagues used family portraits to connect distant living family members [1]. These situated portraits served as peripheral displays since their photo frames were animated with certain symbols as dynamic social indicators to give a sense of the activity of the remote older relative. Other screen-based peripheral interfaces were created to be installed in the ‘background’ of conventional Desktop computers or mobile phones [6]. Shuteye [7], for example, was a peripheral glanceable display for supporting sleep hygiene. The application was presented to the users as an unobtrusive wallpaper in the background of the mobile phone interface and contained useful information for improving sleep behaviour and well-being.
While the latter examples were all screen-based, a large number of peripheral displays relied on different modalities. Light or soundscapes [4], as indicated above, are an established means for presenting information at the periphery of attention. In this context, researchers also speak of ambient displays, notification systems, or ambient notification systems [6].
Recently, Bakker, van den Hoven and Eggen [4] collated their experience and learnings about peripheral interaction in a reflective article. In this context, they also revisited Weiser and Brown’s seminal work on calm computing [5]. They noted that most calm technology developed so far was created for peripheral perception
periphery of attention” [4, p.239]. They further summarised that this research agenda was extended recently “by designing not only for the perceptual periphery but also enabling users to physically interact with the digital world in their periphery” [4, p.240]. Thus, they used the term periphery in a broad sense (all mental activities that do not demand ‘full’ mental resources). Still, both peripheral interaction and peripheral perception can involve the users’ full attention by shifting their focus [4] (cf. Weiser’s and Brown’s quote [5]).
Our exemplary peripheral displays, the PhotoFrames, were designed to be situated both in the users’ visual periphery as well as in the center of focussed attention (when looking at the device) as needed. However, when deploying these devices we faced the challenge of evaluating user interaction, given that there was little explicit user input, and the most interesting question was about the amount of attention or awareness the displays received (i.e., both peripheral perception and focussed
peripheral perception). To address this challenge, we created Trackaware.
In the next section, we present existing evaluation techniques, be it for conventional screen-based displays or other peripheral displays. To complement the review, we also look into literature that investigates how public displays, large media facades or digital signage are assessed, to relate it to Trackaware. Note, such public displays are similar but also somewhat different to the displays used in the study of this paper (PhotoFrame; cf. Figure 1), which we refer to as (private) situated displays located in a private context.
2.2 Related Methods for Evaluation
Researchers have responded in various ways to address the challenge of analysing digital displays or screens, and covered the range from explicit user input to minimal/subconscious interaction, both in lab studies and in in-the-wild evaluations. Hausen et al. [8] recently also proposed to complement in-situ evaluations (as commonly used during the assessment of peripheral interaction design) with controlled lab experiments.
Two methods often used during display or screen evaluations are video recording and field research, for example, as employed by Messeter and Molenaar [9]. One problem reported in filming, however, was privacy concerns [10]. In the course of an extensive literature review on public displays, Alt et al. [10] reviewed different evaluation methods and summarised a set of classical techniques to this end, namely “interviews, questionnaires, focus groups, observations, and logging”. Following these authors, the evaluation approach using Trackaware falls both into the category of observations and logging.
Another popular method used in the evaluation of screen-based displays is eye-tracking [11]. However, conventional eye-eye-tracking is rather obtrusive and not so light-weight, since it often requires the participants to wear a set of miniature cameras mounted to their head. Consequently, eye-tracking creates ‘lab situations’, even though the participants might explore a real world context wearing a mobile headset.
shopping windows, etc. That is, the cameras apply image processing algorithms to determine parameters such as the number of people standing in front of the camera, gaze duration, age, or gender. In contrast to Trackaware, however, these systems address commercial as opposed to private (and scientific) contexts, for example, counting customers and calculating the efficiency of product advertisements.
In this article we are interested in the development and scientific grounding of an evaluation method for situated peripheral displays under naturalistic conductions from a more general perspective and for the purposes of research. Certainly, the aforementioned eye-tracking solutions could be employed or adapted to study the design of novel interactive public displays, and there is a history of applications that use off-the-shelf cameras for applications involving gaze tracking, e.g. browsing [15] or “attentive artwork” [16]. However, to the best of our knowledge, there is a lack in research that is looking explicitly at light-weight awareness tracking (focussed attention and unfocussed peripheral perception) from the perspective of (scientific) interaction design to build novel interfaces.
Trackaware utilises the advantages of automatic tracking without affecting privacy issues too much (cf. findings and discussion section). In addition, it can be used unobtrusively for studies in personal contexts outside the lab. As will be explained in the next section, timestamps for detections are written into a database, instead of storing images. Thus, the algorithm can be regarded as some sort of smart motion sensor and therefore serves as an automatic, privacy-aware logging method.
In summary, there is vibrant research in evaluation methods for displays (screen based or different modalities). This comes as little surprise, given the popularity of such devices and because the “design space [of peripheral displays] is large” [6, p.67]. What we currently lack, however, are appropriate techniques for evaluating or approximating the amount of potential attention such displays receive (i.e., focussed or unfocussed peripheral perception), in an unobtrusive fashion so that they can be used in sensitive/private settings. We go on to introduce Trackaware in detail, before we explore this method from the viewpoint of both researchers and participants.
3 The Trackaware Method
We developed Trackaware for Android and ran it on Samsung Galaxy Nexus
mobile phones. Trackaware makes use of the built-in cameras in mobile phones and the provided Android software APIs1 to detect faces captured by the phone's front or
back camera. Filming or video recording is not required and the device does not store any pictures. Each time a user (i.e., a face; see footnote 2) is detected a timestamp is stored into a database for later analysis. These logging events are also uploaded to a server for remote monitoring of display usage frequencies. Technical details are out of scope as our contribution is in proposing Trackaware as a low-cost research method for situated displays and in unpacking its potential through conducted (field) studies. Here, we were not so much interested in making claims about the algorithm’s
1 Application programming interfaces (APIs) provide access to regularly reoccurring
reliability or that we were able to precisely quantify use. Rather, we investigated
approximations for use or awareness (peripheral perception); we were interested in being able to make coarse and internally consistent comparisons between different participants and different periods of time. In doing so, we could still get an idea of when participants potentially looked at the prototypes, what were the popular pictures, and extrapolate about their engagement with the prototypes. As we will see later in this article, Trackaware is meant to be used as part of a data triangulation strategy, that is, we see its potential in particular in complementing existing methods (e.g., using Trackaware in conjunction with user interviews).
Trackaware is based on the assumption that, whenever the camera of the phone or tablet detects a face or multiple faces, there is a strong potential that attention is being paid to the device (or at least to its direct surroundings)2. While a device’s camera is
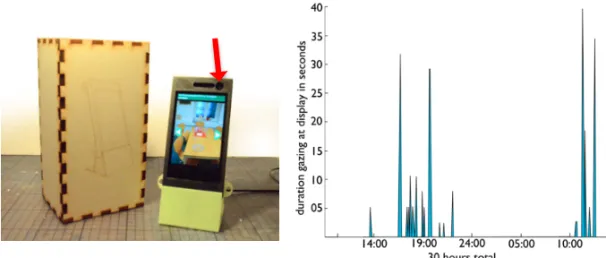
employed for detecting faces by means of Trackaware, the screen can still be used to display information as newer mobile devices have enough capacity for performing multiple tasks simultaneously. Thus, displaying information and quantifying awareness/attention can be done simultaneously with one single device. This is a vital advantage to some of the existing solutions (see related work section) and makes the system a lightweight, inexpensive and easy to use method to conduct unobtrusive field studies for situated peripheral displays, without needing to install additional devices. E.g., the PhotoFrame device of Figure 1 (left) employed in the study made use of Trackaware for measuring peripheral awareness as well as presenting photos.
4 Study
We were interested in what researchers can learn using Trackaware regarding peripheral perception and how Trackaware would also be experienced by participants. To do this we conducted an exploratory user study involving a total of 61 participants over a time period of 21 days to assess the potential of Trackaware for evaluating situated displays such as PhotoFrame in personal settings. The study was part of a university course in ubiquitous computing (led by the first author of this article; students were graded based on the reflective learning experience they demonstrated throughout the course and not on the Trackaware data they recorded or similar), and the ‘researchers’ were 45 advanced master-level interaction design students. The Trackaware study took place at the end of the course, and most of the students had already obtained additional experience from related courses on user research methods or from their part-time jobs as interaction designers. They worked in 16 groups of 2-3 students and each group recruited one participant to use the
2 We evaluated the optical properties of conventional mobile phone cameras. Under lab
PhotoFrame application in their homes. Hence, the study featured 45 ‘participant-researchers’, who used Trackaware, and 16 ‘participant-participants’, who operated PhotoFrame (and an associated mobile phone app). For better readability, we will call the first participant group researchers (n=45) and the second group PhotoFrame users
(n=16) in the remainder of this paper. The study conducted by the researchers and involving the PhotoFrame users will be named the display trial. We, the authors, again studied the researchers using Trackaware and the PhotoFrame users ‘from a distance’, and we could also draw on our own experiences with Trackaware from using the technique in other field trials.
4.1 Procedure and Methodology
The present study was organised in four phases. (1) We started off with a training phase for all researchers explaining the objective of the display trial they had to conduct. Complementing these explanations, we provided written instructions as a study plan or guideline. (2) During the second phase, the researchers recruited PhotoFrame users from their social networks and conducted the actual display trial over the course of 2 weeks (the display was in use for 14 days). This also included
interviews between researchers and PhotoFrame users at the beginning and end of the trials (we will call these trial interviews). These trial interviews were audio recorded and the participants gave their written informed consent. As part of a triangulation strategy, the researchers also employed Trackaware to study PhotoFrame use during this period. That is, the researchers were interested in how often their participants used the frames for inspecting the photos, and how many images were sent to these devices. Hence, their primary research interest was in exploring in an open-ended fashion how their participants employed the devices and how this knowledge could inspire future designs. At the end of the display trial, PhotoFrame users were also
asked to fill in a survey based on a five point Likert scale (see Figure 2) (3) After the display trial, the researchers analysed their collected data (trial interviews, Trackaware log data, PhotoFrame user photos, surveys), created a summary and reported this data. These reports were also audio (in some instances video) recorded. (4) Phase 4 was optional. The researchers could choose Trackaware as their topic for a class reflective essay, to be discussed with the first author (7 essays were submitted in the end). Throughout the study we were in close contact with the researchers and held informal interviews and took notes.
In summary, the study procedure as outlined above resulted in six data sources we used for the evaluation of Trackaware: Trackaware log data, trial interviews, researcher reports, informal interviews with the researchers, surveys, and the reflective essays by the researchers. We analysed this data using a thematic analysis approach [17], that is, we exposed ourselves to the collected material – video, audio, written notes, photos, etc. – and qualitatively as well as iteratively investigated the data for underlying patterns. Through this approach we identified a set of salient themes from the observations, which were particularly interesting with regard to the research questions (what will researchers get out of Trackaware and do the participants have any reservations?). These themes will be used as a guide for presenting the findings in the next section.
5 Findings
Figure 1 (right) illustrates exemplary log file content as recorded by Trackaware. On the right side, we can see a graph as used by the researchers during the display trials. During these trials the researchers were provided with the associated tools for creating such graphs. In Figure 1 we can observe four peak values ‘around’ the 19:00 and 10:00 mark. This can be interpreted as corresponding to focussed attention towards the PhotoFrame, because in this period the cumulated time of attention exceeds a
Fig. 2. Survey for PhotoFrame users (n=16) and results (-2 = don’t agree at all; 0 = neutral; 2 = totally agree):
1. I did often intentionally look at PhotoFrame (M=0.5; STD=1.03) 2. I glanced at PhotoFrame when passing (M=0.2; STD=1.11)
3. I would allow a video camera to be deployed during a study (M=-1.56; STD=0.89) 4. I felt observed by Trackaware (M=-0.375; STD=1.41)
specific threshold3 (15s) for each peak. In contrast, there was no activity (perception)
during the night, and the numerous smaller spikes other than the four main peaks can be interpreted as indicating phases of peripheral perception without focussed attention (a person is in reach of the device and causes the spikes, but she takes only short glances at the display at most). In addition, the researchers had online access for monitoring the PhotoFrames in real-time via a web interface to the Trackaware timestamps. This capability leads to the first theme or category of observations we made during our study.
5.1 Trackaware from the Perspective of Researchers
Patterns of Use and ‘Reassurance’: The researchers4 reported that Trackaware was
an appropriate tool for monitoring and analysing patterns of use as evident from, for example, this quote: “[Our participant] mostly checked the frame in the evening for new pictures or browsed old pictures … The highest peak in the [Trackaware] graph is at 8pm, but [the participant] also looked at the frame at 12am several times.”[R16] This helped the researchers to “find certain patterns or abnormalities” [R4]. For this reason, the researchers valued Trackaware for its support in studying participants in their personal context and “outside of the controlled zone” [R10]. The technique was considered particularly appropriate for the purpose of studying visual peripheral displays like PhotoFrame: “How do we otherwise tell how often they look at the display? The software [Trackaware] provides us with a tool for at least having an approximation of use and learning if it will catch their attention” [R9]. Moreover, they observed that “real users have unpredictable behaviour” [R10].
In addition, the method was “helpful for checking whether the device was still running” [R1] and “controlling the progress of the study” [R4].
Validating Paricipants’ Accounts – Inaccurate Memories: Another interesting observation related to the fidelity of the PhotoFrame users’ accounts. Two groups of researchers recognised that the report of their participants did not match the Trackaware log files. When asking them about this incident, the corresponding PhotoFrame users realised that, while they thought they were pretty sure about their use, they had in fact inaccurate memories or had made incorrect assumptions regarding their daily routines: “This was some very interesting insight … First, we thought it a bit weird, but thinking about it, it is less surprising that users can get confused with their actual usage. Even they might not be aware that their actual use is different in reality, this might have important implications for design.” [R14]
Elicitation: Carefully confronting the PhotoFrame users with their inaccurate memories was an interesting tool during the interviews. In general, the Trackaware
3 This threshold was determined in several experiments. It depicts a parameter that can be
(re)adjusted before and during analysis, and it changes with the width of the cumulated time window. The threshold reflects the researchers’ interpretation of (un)focussed attention/perception, study setup (e.g., screen size of the display) and research questions.
graphs were considered a good basis for discussion and supported the researchers in guiding their dialogue with the participants. The approach elicited interesting feedback from the participants, similar to using photos during an interview, and was therefore appreciated in particular by less experienced researchers as an aid.
Precision: While most researchers understood and accepted that Trackaware was an
approximation for quantifying (un)focussed attention/perception and created for uncovering hidden patterns by interpretation and data triangulation, one group of researchers criticised the data as currently being too “unstructured”, “uncorrelated”, and “uninformative” [R1]. They suggested that Trackaware should incorporate more elaborated data mining algorithms. In fact, this suggestion was implemented by two other groups on their own initiative when they further processed the Trackaware raw data. By defining their custom data accumulations and intervals (time windows for aggregation) they improved their understanding of PhotoFrame use.
In general, besides some criticisms and suggestions for improvements, Trackaware was valued by the researchers. We now go on to describe Trackaware from the perspective of the PhotoFrame users.
5.2 Trackaware from the Perspective of Participants
Our second research question was concerned with the PhotoFrame users’ experience of Trackaware and whether they would accept it at all. To address this question, we designed a survey with a five point Likert scale for the users, and the researchers also interviewed them, focussing on Trackaware (cf. section 4.1). The results of the surveys are displayed in Figure 2. In summary, Trackaware was well accepted by the PhotoFrame users (n=16) with two exceptions (PhU12, PhU16). While the participants5 in general had an academic background with an affinity to technology,
these two exceptions described themselves as being extremely interested in and aware of privacy issues in the context of technology. In their everyday life, they passionately refused to provide any personal information if possible and rejected any form of surveillance (see also below). To the other PhotoFrame users, the invasiveness of Trackaware was acceptable, as outlined in the following sections.
Trackaware regarded as being unobtrusive: As evident from the survey, PhotoFrame users stated (on average) that they did not really feel observed by Trackaware, if at all, and this was not uncomfortable to them (cf. survey items 4 and 5). While Trackaware was acceptable, however, 12 out of 16 participants stated that having an additional camera during the study for later video analysis was not an option at all (item 3). In other words, the PhotoFrame users were not indifferent to their privacy matters; they simply did not regard Trackaware as being too intrusive: “For this kind of study, face tracking is a reasonable method to track the user behaviour, however I wouldn’t agree to use of video or photo recordings [where faces could be identified and captured].” [PhU3]
5 The sample consisted of universtiy graduates and universtiy students, recruited by the
Another participant, perhaps on the extreme side of acceptance, put it like this: “Having it [Trackaware] in the restroom or shower, I couldn’t bother less!” [PhU1]
Trackaware, Privacy, and sceptical Users: At the other end of the spectrum, we identified two PhotoFrame users (PhU12, PhU16) who strongly rejected Trackaware. “I knew that each time I looked at the screen my face was scanned so I always had some doubts” [PhU12]. However, these users too stated that as time passed by, they increasingly ignored Trackaware and finally accepted the technology more easily. This phenomenon was also evident from the reactions of the remaining (and more ‘positive’) participants, as we will see in the next paragraph. Interestingly, there were no reflections by the researchers or PhotoFrame users regarding possible privacy issues as introduced by recording use patterns over a period of time. At least in this sample, recording such digital ‘footprints’ was not an issue.
Forgetting about Trackaware: Item 6 and 7 of the survey asked the participants whether they were able to forget about Trackaware after some time passed and whether our technology felt like a conventional camera for filming to them. Interestingly, the survey in conjunction with the interviews clearly showed that they indeed forgot about Trackaware (“At first sceptical but fast acceptance of [Trackaware]”[R1]). In addition, they did not have the feeling of being filmed. Rather, Trackaware was interpreted as some sort of intelligent motion sensor. As indicated in the above section, this also held true for the more sceptical PhotoFrame users: “… in the beginning I was feeling a bit uncomfortable because I was not used to it and I had a feeling like I was being watched all the time, but as the time was passing by I got used to it.” [PhU3]
In summary, all participants except the two ‘sceptics’ did not regard Trackaware as an intrusive evaluation technology. On the contrary, while some users showed a healthy amount of caution, we also found some of the participants being surprisingly permissive regarding Trackaware. We go on to discuss our findings.
6 Discussion
Here we have been exploring the potential of Trackaware to address the challenge of evaluating private situated photo displays where no explicit user input is involved. The study findings indicate that Trackaware was experienced as a valuable tool for augmenting the evaluation of peripheral photo display use, as it could be operated at little extra cost on conventional Android devices, which at the same time run the primary photo sharing application. While the output of the Trackaware algorithm must be interpreted as an approximation of focussed attention or awareness, it nevertheless enabled the researchers to monitor their deployments in realtime, to capture such data without overt intrusion into personal contexts, to use it as a complementary method for data triangulation, and to confirm anticipated or to reveal unexpected use of technology.
6.1 Strengths and Weaknesses of Trackaware
While computation on off-the-shelf mobile phones allows real-time face-tracking as a background service, eye-tracking is not yet feasible – hence Trackaware cannot determine exactly where the user looks. Thus, the algorithm provides an
approximation for tracking attention. Nevertheless, we suggest that this restriction doesn’t necessarily have to be a drawback in our case (in the case of evaluating visual peripheral displays and peripheral perception). As briefly outlined in section 3, Trackaware uses the simple heuristic or assumption that if the camera is able to ‘see’ a human face, then this user is also potentially able to take a glance at the device’s screen. Since we are interested in the evaluation of peripheral displays and (un)focussed attention/perception (i.e., awareness), this inaccuracy can also be seen as a feature, because we want the algorithm to be triggered in such a situation.
Peripheral perception can (a) involve focussed attention or (b) it can take place in the periphery of perception. Shifts between both modes can be performed easily [4]. Trackaware performs particularly well in (a) detecting focussed attention towards a situated display (cf. the four peaks in Figure 1 right). (b) Estimating (the potential for) unfocussed peripheral perception is more tricky, however we suggest that this mode of attention is still reflected in a graph through a greater number of small spikes. This indicates a person being present but not pausing in front of the device.
Further, the data derived from Trackaware is only one input to the evaluation and can be a good grounding for later discussions with users through which the patterns can be clarified and explained (or contested).
6.2 Limitations: Participants, Trust
Besides promising results from our survey (Figure 2), we must keep in mind that our sample size was restricted to 16 PhotoFrame users, and two of those participants felt observed by the device. In addition, we investigated a rather specific group of people (with an affinity to technology). It might well be the case that other and more diverse user groups might accept Trackaware equally well, however, this cannot be guaranteed. More work is needed to investigate the sensitive domain of surveillance and to develop strategies for establishing trust when deploying Trackaware. As PhU5 put it, “trust in the researcher is crucial for such tracking devices”.
In addition to the 16 participants who used the PhotoFrames, 45 students acted as researchers in this article. We acknowledge that due to their lack in experience, they could have reacted and acted differently than more senior interaction designers. It would be interesting in future research to study senior researchers using Trackaware. Until then, however, we argue that the constellation in the present research is also beneficial and brings its own interesting perspectives. The 45 student-researchers who used Trackaware were studied by the authors of this article as senior researchers. Thus, the judgement of the researchers was interpreted by the authors, who also had practical experience with Trackaware to draw from during this process.
7 Conclusion and Future Work
In this article, we have introduced Trackaware as a lightweight and inexpensive method for evaluating peripheral displays and peripheral perception (focussed and unfocussed attention), in particular when deployed in personal contexts. We investigated whether researchers would find it useful and whether this technique was acceptable to the users. After running a study involving a total of 61 participants (researchers and PhotoFrame users) we found that Trackaware was considered valuable by researchers and largely unobtrusive by participants (PhotoFrame users). While the technique provided insight into the use of photo displays, for example, by revealing unexpected patterns, it did not impair the users in their daily routines. Therefore, we conclude that Trackaware is an appropriate and interesting method for complementing the repertoire of existing evaluation techniques for in-situ displays.
References
1. Mynatt, E.D., Rowan, J., Craighill, S., Jacobs, A.: Digital Family Portraits: Supporting Peace of Mind for Extended Family Members. Proceedings of CHI'01, pp. 333-340. ACM, Seattle, Washington, USA (2001)
2. Güldenpfennig, F., Fitzpatrick, G.: Towards Rapid Technology Probes for Senior People. Proc of SouthCHI’13, 664-671. Springer, Heidelberg (2013) 3. Güldenpfennig, F., Nunes, F., Ganglbauer, E., Fitzpatrick, G.: Making Space
to Engage: An Open-ended Exploration of Technology Design with Older Adults. Accepted by Int J of Mobile Human Computer Interaction (2016) 4. Bakker, S., van den Hoven, E., Eggen, B.: Peripheral Interaction:
Characteristics and Considerations. Pers Ubiquit Comput 19, 239-254 (2015) 5. Weiser, M., Brown, J.S.: The Coming Age of Calm Technology. Beyond
Calculation, pp. 75-85. Springer New York (1997)
6. Pousman, Z., Stasko, J.: A Taxonomy of Ambient Information Systems: Four Patterns of Design. Proceedings of the Working Conference on Advanced Visual Interfaces, pp. 67-74. ACM, Venezia, Italy (2006)
7. Bauer, J.S., et al.: ShutEye: Encouraging Awareness of Healthy Sleep Recommendations with a Mobile, Peripheral Display. Proceedings of CHI'12, pp. 1401-1410. ACM, Austin, Texas, USA (2012)
8. Hausen, D., Tabard, A., Thermann, A.v., Holzner, K., Butz, A.: Evaluating Peripheral Interaction. Proc of TEI'13, pp. 21-28. ACM, Munich (2013) 9. Messeter, J., Molenaar, D.: Evaluating Ambient Displays in the Wild:
Highlighting Social Aspects of Use in Public Settings. Proceedings of DIS'12, pp. 478-481. ACM, Newcastle Upon Tyne, United Kingdom (2012) 10. Alt, F., Schneegaß, S., Schmidt, A., Müller, J., Memarovic, N.: How to
Evaluate Public Displays. Proceedings of PerDis'12, pp. 1-6. ACM, Porto, Portugal (2012)
11. Dalton, N.S., Collins, E., Marshall, P.: Display Blindness?: Looking Again at the Visibility of Situated Displays using Eye-tracking. Proceedings of CHI'15, pp. 3889-3898. ACM, Seoul, Republic of Korea (2015)
12. https://aimsuite.intel.com/ last accessed 30 Oct 2015 13. http://www.quividi.com/ last accessed 30 Oct 2015 14. http://www.xuuk.com/eyebox2/ last accessed 30 Oct 2015
15. Zhang, Y., Bulling, A., Gellersen, H.: SideWays: A Gaze Interface for Spontaneous Interaction with Situated Displays. Proceedings of CHI'13, pp. 851-860. ACM, Paris, France (2013)
16. Holman, D., Vertegaal, R., Sohn, C., Cheng, D.: Attentive Display: Paintings as Attentive User Interfaces. CHI '04 Extended Abstracts on Human Factors in Computing Systems, pp. 1127-1130. ACM, Vienna, Austria (2004) 17. Braun, V., Clarke, V.: Using Thematic Analysis in Psychology. Qualitative
Research in Psychology 3, 77-101 (2006)
18. Nielsen, J.: First Rule of Usability. www.nngroup.com accessed 30 Oct 2015 19. Andersen, T., Bjørn, P., Kensing, F., Moll, J.: Designing for Collaborative