3D BUILDING EVACUATION ROUTE MODELLIN AND VISUALIZATION
Wendel Chan and Costas ArmenakisGeomatics Engineering, GeoICT Lab
Department of Earth and Space Science and Engineering, Lassonde School of Engineering York University, Toronto, Ontario, M3J 1P3 Canada
{wendelc},{armenc}@yorku.ca
Technical Commission II
KEY WORDS: building evacuation route modelling, multicriteria decision making, analytical hierarchy process, 3D visualization
ABSTRACT:
The most common building evacuation approach currently applied is to have evacuation routes planned prior to these emergency events. These routes are usually the shortest and most practical path from each building room to the closest exit. The problem with this approach is that it is not adaptive. It is not responsively configurable relative to the type, intensity, or location of the emergency risk. Moreover, it does not provide any information to the affected persons or to the emergency responders while not allowing for the review of simulated hazard scenarios and alternative evacuation routes. In this paper we address two main tasks. The first is the modelling of the spatial risk caused by a hazardous event leading to choosing the optimal evacuation route for a set of options. The second is to generate a 3D visual representation of the model output. A multicriteria decision making (MCDM) approach is used to model the risk aiming at finding the optimal evacuation route. This is achieved by using the analytical hierarchy process (AHP) on the criteria describing the different alternative evacuation routes. The best route is then chosen to be the alternative with the least cost. The 3D visual representation of the model displays the building, the surrounding environment, the evacuee’s location, the hazard location, the risk areas and the optimal evacuation pathway to the target safety location. The work has been performed using ESRI’s ArcGIS. Using the developed models, the user can input the location of the hazard and the location of the evacuee. The system then determines the optimum evacuation route and displays it in 3D.
1. INTRODUCTION
According to the United Nations, the urban population has surpassed rural population for the first time in history since 2008. More efficient designs, developments and services will be required for such urban environments and its infrastructure. Disasters such as earthquakes, building fires, or chemical spills can cause massive disorder in urban environments and turmoil leading to inefficient evacuation strategies. The most common building evacuation approach currently applied is to have evacuation routes planned prior to these emergency events. These routes are usually simply the path from each building room to the closest exit. There are several issues with this approach. The route path is neither adaptive nor changes relative to the type, intensity, or location of the emergency risk Further it does not provide any information to the affected persons neither provides any information to the emergency responders and it does not allow reviewing of simulated hazards scenarios and alternative evacuation routes.
A proposed solution to the evacuation problem is to adopt a systems approach to the problem of determining the optimal evacuation routes. First, a system must be defined. A system is defined as a co llection of elements which are connected and organized in order to achieve a goal by receiving input and performing processing using resources and information fed into the system. The systems approach is a technique to solve a problem which is logical and systematic. The goals, objectives, and the criteria are defined and specified in order to emphasize efficiency and performance (Simonovic, 2011).
Using this approach, a s ystem is created which models and visualizes the disaster situation. The system is adaptive, thus the characteristics of the disaster can be modified and
configured to model the disaster situation. The system can also model the dynamic evacuee’s location. The system then uses these characteristics to find the optimal evacuation route for the evacuee in that particular situation using multi-objective analysis using multiple criteria and multiple alternatives. Since the system is capable to model the disaster using input from the user; the information required includes the building floor plans, the location and impact of the hazardous event, as well as the location of the evacuee.
The objective of this study is to improve on t he current evacuation methods by developing faster, safer, and more efficient building evacuation strategies. By implementing this approach, first responders or emergency crews can have real time updates on the emergency situation. The hazardous situation can be modeled and visualized while taking input from all the users. The users can be the evacuees themselves, observers, or the emergency crews. The real-time input can be any geotagged or georeferenced data such as photos or descriptions which can enhance the modelling process allowing for updated solutions to determine the optimal evacuation route. The 3D visualization can also help the first responders to quickly and easily visualize and comprehend the situation as it evolves. Various evacuation scenarios and simulations can be developed and applied. The simulations provide ways of forecasting evacuation times and their visualization supports the study and understanding of the people’s movements within a building and identifies potential obstacles.
the base station. The base station then processes the data from all users’ inputs and models and visualizes the emergency situation. It then can send the 3D visualization of the situation as well as the optimal evacuation routes to all users.
1.1 Current Methods
Currently used methods for evacuation include pre-planned evacuation routes for each floor posted on the walls. These are mostly used as exit plans in case of fire emergencies. More advanced emergency infrastructure includes automatic detection systems with sensors at known spatial location in the building detecting fire, heat, as well as smoke. Current methods can also inform the building occupants of the presence of an emergency through alarm systems; these include sirens or built-in intercom announcements. Another way to relay information to the building occupants is through emergency lighting system which illuminates the paths to the exits guiding the evacuees.
There are several issues that arise from the current emergency evacuation methods. Most of these issues are due to the fact that there is very little to no real-time information communication to and from the building occupants during an evacuation scenario. These methods are non-adaptive; evacuees can only follow preset or pre-planned plans which do not change. In reality, emergencies are caused by various types of hazards which have different behaviours. Preset plans cannot be the best solution for all types of emergency scenarios. Another issue that arises is that there are no simulations for these types of methods; the results of certain procedures cannot be predicted.
1.2 Related Research Works
Relevant research in the field includes the use of a g rid graph-based model where grids representing cellular units are overlaid on top of a 2D floor plan. The free space is represented by the grid graph network and paths are created from that network. The shortest route is then determined and used as the solution to the evacuation. This research work is limited as it d etermines the best route only by determining the shortest path (Sun and Li, 2011).
Another related research work uses a h ybrid model combining a geometry model and a logical model for an emergency scenario. It uses a node network to model rooms, points of interests, as well as the escape points. The route calculation algorithm uses the logical model which is evaluated by four criteria being completeness, time complexity, space complexity, and optimality. This method does not incorporate real time user inputs for updating the model (Pu and Slatanova, 2005).
Choi and Lee, 2009 have used building evacuation simulation based on 3D geometric network extraction and an agent-based model. The internal structure of the building is represented by 3D geometric network, used by agent-based models employing the shortest path for evacuation.
The EXODUS building evacuation model has been developed for predicting a range of information data such as occupant drive, occupant location, exit flow capacity, exit size, occupant response times and geometry definition (Gwynne et al., 2005). EXODUS is a suite of software tools designed to simulate the evacuation of large numbers of people from a variety of building types. It is developed by the
Fire Safety Engineering Group of the University of Greenwich in UK.
2. METHODOLOGY
The proposed research approach involves spatial decision analysis. This comprises of a set of systematic procedures for complex spatial problems. The strategy taken is to analyze small parts or subsystems and then integrate them into a solution. The two components used in the spatial decision analysis approach are the Geographic Information System (GIS) and the Multicriteria Decision Making (MCDM) component (Malczewski, 1999). The GIS part is used for the data acquisition, storage, manipulation and processing. The MCDM component is used for aggregating the data for analysis and decision making (Karnatak et al., 2007).
The spatial decision analysis approach is used because it deals with multiple alternatives and multiple criteria in order to reach a goal. This approach can allow real-time decision making by considering real time inputs and performing sensitivity analysis. Simulations can be conducted on the model used to predict the changes in the results from a specific course of action. These actions include changing the inputs and variables such as the weights on the criteria, the set of alternatives, or the criteria themselves. Optimization can be also performed on t he system by finding better solutions through simulations which reduce errors, making the system more robust.
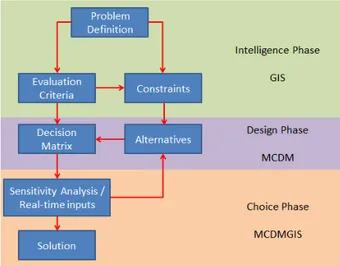
A three phase approach is used in the research illustrated in Figure 1.
2.1 Intelligence Phase
The first phase is the intelligence phase where the Geographic Information System (GIS) is used. It starts with the problem definition; in this case, the problem that is the determination of the optimal evacuation route. Once the problem has been specified, the set of alternatives can be identified; these are the possible solutions to the problem which are spatially defined by the evaluation criteria. There are multiple criteria used in the analysis; they can be conflicting and they can be quantitatively and/or qualitatively measured.
The intelligence phase is the information gathering phase; most of the spatial information is gathered during this phase, and normally it does not get altered in later phases.
2.2 Design Phase
The design phase then starts by incorporating the alternatives and the evaluation criteria corresponding to them into a decision matrix. Multicriteria Decision Making (MCDM) is the method used to generate this matrix allowing the decision making process to begin. The decision matrix shows the relationship between the alternatives and the evaluation criteria. A solution can be determined using the decision matrix as the tool.
2.3 Choice Phase
By performing sensitivity analysis, and if available importing real-time inputs, the decision matrix can be updated and potentially changing the alternatives and the criteria which could result in a different solution. This is an iterative process and an optimal solution can be determined. This is the phase where MCDM and GIS are integrated.
Figure 1. Multicrititeria decision making flowchart
3. IMPLEMENTATION
3.1 Data Set
The research has been conducted using the York University Keele campus area for the initial application of concepts and implementation of the system. Specifically, the Petrie Science and Engineering Building (PSEB) is used for implementing and testing the proposed methodology (Fig. 2). The data sets obtained for this area include detailed digital floor plans, orthoimagery, 3D Google Sketchup models, and digital elevation map data (Armenakis and Sohn, 2009). These data sets are georeferenced and are all in the same reference coordinate system (UTM Zone 17N).
This data set was chosen as the datasets were easily available and the initial concepts are easier to implement on a geometrically simple building design.
Figure 2. PSEB floor plan
3.2 Multicriteria Decision Making (MCDM)
Following the aforementioned decision flowchart, the first phase is the Intelligence phase. The problem definition was already defined as findind the optimal evacuation route. The objectives placed on the system are used to determine the criteria of minimizing evacuation time and minimizing risk which are used as the constraints to be respected. The evaluation criteria currently used in this study are the distance, the congestion, and the spatial risk level. These criteria are determined by examining what attributes can describe the possible solutions affected by the constraints. The possible solutions are also called the alternatives in the intelligence phase.
Once the problem, the criteria, the constraints, and the alternatives are defined, a decision process can be established. This is the start of the design phase where Multicriteria Decision Making (MCDM) system is employed. Figure 3 shows the decision process created by the MCDM.
Figure 3. MCDM decision process
3.3 Analytic Hierarchy Process (AHP)
With multiple alternatives and multiple criteria describing them, an efficient way to determine the best alternative out of the set of alternatives is to assign a single cost value to each of the alternatives. The cost value is the average weighted value of the criteria. The weights of the different criteria are determined using the Analytic Hierarchy Process (AHP) (Saaty, 2008). Generally, it is used to determine the importance of each element in a s et of elements. There are multiple methods under the AHP; the method used for this research is the Pairwise Comparison method. This method is used with all the criteria being compared against one another resulting in a normalized weight for each of the criteria. One limitation of using this method is that it only considers the preference of one decision maker. Different decision makers can have different preferences resulting in different calculated weights.
The Pairwise Comparison Matrix is shown on Table 1; it defines the importance between the criteria according to the decision maker’s preferences. For example, Distance is considered to be seven times more important than Congestion.
matrix. The values are then averaged in each row to determine the weight of each criterion. The weights for the design parameters Distance, Risk level, and Congestion are 29%, 65%, and 6% respectively in this case.
Pairwise Comparison Matrix
Criterion Distance Risk Level Congestion
Distance 1 1/3 7
Risk Level 3 1 9
Congestion 1/7 1/9 1
Sum 4.14 1.44 17.00
Table 1. Pairwise comparison matrix
Synthesising Matrix
Distance Risk level Congestion Weight
0.24 0.23 0.41 0.29
0.72 0.69 0.53 0.65
0.03 0.08 0.06 0.06
1.00 1.00 1.00 1.00
Table 2. Synthesising matrix
3.4 Implementation
The approach was implemented using ESRI’s ArcGIS software; specifically the ArcScene component. ArcScene allows for the research to be modelled and visualized in 3D. ArcGIS supports the collection, processing, manipulation, and output of 3D spatial data. Spatial data refers to data with incorporated location attributes. ArcGIS has a v ariety of useful built-in tools and toolboxes for spatial data analysis and manipulation. It can be used to create, and import already existing spatial data. The Model Builder function of ArcGIS allows users to integrate built-in tools as well as user created tools in order to perform higher complexity operations. The objective of the modelling is to create a 3 D vector path network representing the possible paths which an evacuee can take.
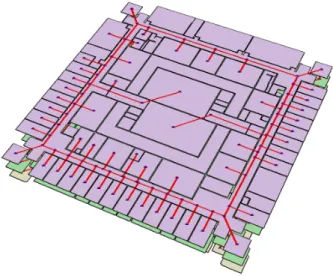
The initial data is the 2D floor plans of the PSE building. The floor plans are in shapefile (.shp) format; these include additional information such as the room numbers and the room types. A required data set which was initially unavailable was the vector data set representing the hallways for each floor. This data set was manually created using the built-in 3D shapefile creator in ArcScene. Figure 4 shows the initial data with the floor plans and hallways.
Initially a node network with two components was created. The first component is the set of nodes representing the rooms where occupants are possibly located. This set was created by generating centroids of room polygons that are of certain types such as offices, laboratories, and classrooms. The second component is the set of junctions which are points in the hallways where an evacuee can turn and change directions.
Figure 4. 3D floor plans and hallways of PSEB
In the second step the vector network is created by connecting the room centroids to the junctions which results in a full vector network connecting all the rooms to the hallways. A vector stair set was created manually to connect all the floors at the appropriate locations. The vector network was divided into smaller segments separated by the nodes to allow each segment to have different criteria values. This completes the geometry of the 3D vector network. Figure 5 shows the vector network as well as the node network with the floor plans in 3D.
Figure 5. Vector and node network
The distance criterion is assigned to the vector network based on the geometric lengths of the path vectors. ArcScene has built-in tools to assess the geometry of the features which makes the process easier.
The values of the spatial risk level criterion are determined by performing a check on which path segments intersect with each of the hazard radial buffers. The risk level for path segments outside of the hazard buffers are given a minimum value while the pathways which are intersected with the buffers are given risk level values inversely proportional to the distance from the hazard point source. The risk level values are classified based on the radial distance values of the buffers.
The last criterion, which is congestion, requires some data manipulation before it can be modelled. The initial 2D floor plan data contained room types but not room occupants. Using the room types, the room occupancy attribute was added to the floor plan. Offices were given occupancy of one person while laboratories and classrooms were given occupancy of ten people. The congestion is then calculated per path segment by first creating a b uffer around each segment and calculating the mean of the occupancies of the rooms which are intersected by the path segment buffers.
The criteria are then normalized to a value from 0 to 1 and using the weights determined from the pairwise comparison method of AHP, the final cost value for each path segment can be determined. The final cost value is the average weighted value of the normalized criteria assigned to each segment. With this, the 3D vector network is complete for the particular hazard situation. The values for the criteria and for the cost function need to be recalculated if the hazard location and intensity are changed.
4. RESULTS
Once the 3D network is complete, the user can input the evacuees’ location via room number. The evacuee’s starting point will then be placed on the node network at the centre of the room. Similarly, the user can enter the hazard location and its intensity. The following three scenarios demonstrate how the system determines the optimal solution for different inputs.
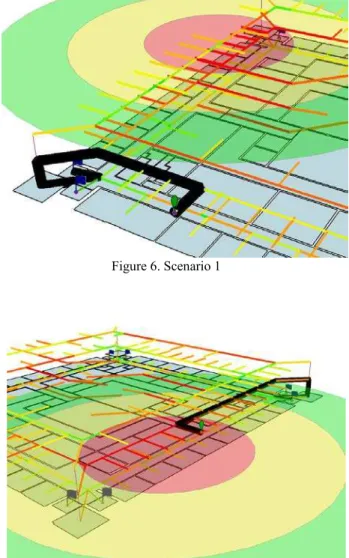
4.1 Scenario 1
In the first test scenario, the hazard location and its area of influence is shown by the radial buffers. The evacuee’s starting location is shown as a green pin and the possible exits are shown as blue flags (Figure 6). The weights of the criteria used in this scenario are 29% for distance, 65% for risk level, and 6% for congestion. The evacuee’s starting location was placed outside the hazard area of influence. The evacuation system determined the optimal path to be the one with the shortest distance to an exit point.
4.2 Scenario 2
In this scenario, both the hazard source point and the evacuee’s starting location are located on the second floor. This scenario uses the same criteria weights as in the first scenario. The system did not choose the exit with the shortest route because the hazard location was in its path. Instead, the system selects as optimal route the one with the least cost
Figure 6. Scenario 1
Figure 7. Scenario 2
which happens to be not the same as the shortest route (Fig. 7).
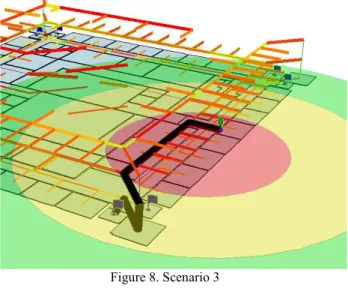
4.3 Scenario 3
The objective of this scenario was to perform a s imple sensitivity analysis on how different weights can affect the solution of the evacuation model. In this scenario the hazard and the evacuee’s locations are placed at the same locations as in scenario 2. However, different criteria weights are used. The weights used for distance, risk, and congestion were 80%, 14%, and 6%, respectively. Since the distance criterion has a much higher weight compared to the other two criteria, the system infers that the optimal path be the route with the shortest distance to an exit (Fig. 8).
4.4 3D Visualization
Figure 8. Scenario 3
Figure 9. 3D Visualization of evacuation routes using Google Earth KML
5. CONCLUDING REMARKS
A 3D building evacuation route modelling and visualization has been developed. The optimal evacuation route is determined among a s et of alternatives described by evaluation criteria. A multicriteria decision making (MCDM) approach has been applied to model the risk and select the optimal evacuation route. The analytical hierarchy process (AHP) has been used to assess and rank the criteria describing the different alternative evacuation routes. The best route is then chosen to be the alternative path with the least cost value. The evacuation routes were generated by a 3D network linking the locations of the occupants to the exits of the building. In this study the location of the hazard and the hazard impact zone were static. The building, the surrounding environment, the evacuee’s location, the hazard location, the risk areas and the optimal evacuation pathway to the target safety location were visualised in 3D using the ArcScene software module of ArcGIS and the Google Earth browser. Future work will include the aspects of indoor navigation as related to the path risks (e.g., Vanclooster et al., 2013) and the two way communication between the building occupants and their location, and the emergency base station, aiming at providing real-time situation awareness and spatial intelligence to both evacuees and emergency responders.
6. RERFERENCES
Armenakis C., Sohn, G. 2009. iCampus: 3D modeling of York University Campus, In Proceedings of the 2009 Annual Conference of the American Society for Photogrammetry and Remote Sensing, Baltimore, MA, USA.
Choi J., Lee J. 2009. 3D geo-network for agent-based building evacuation simulation, In 3D Geo-information Sciences, J Lee and S. Zlatanova (Eds.), pp. 283-299.
Gwynne S., Galea E.R., Owen M,. Lawrence P.J, Filippidis L. 2005. A systematic comparison of building EXODUS predictions with experimental data from the Stapelfeldt trials and the Milburn House evacuation, Applied Mathematical Modelling, 29, pp. 818–851.
Karnatak H.C., Saran S., Bhatia K., Roy P.S. 2007. Multicriteria Spatial Decision Analysis in Web GIS Environment, Geoinformatica, 11, pp. 407-429.
Malczewski J. 1999. GIS and Multicriteria Decision Analysis, Wiley, pp. 182-187.
Pu S., Zlatanova S. 2005. Evacuation route calculation of inner buildings, In Geo-information for Disaster Management, P. van Oosterom, S. Zlatanova, E.M. Fendel (Eds), Springer, pp. 1143-1161.
Saaty T.L. 2008. Decision making with the analytic hierarchy process, Int. J. Services Sciences, Vol. 1, No. 1, pp. 83-98.
Simonovic S. 2011. Systems Approach to Management of Disasters. Hoboken: John Wiley & Sons Inc., pp. 53-84.
Sun J., Li X. 2011. Indoor evacuation routes planning with a grid graph-based Model, IEEE 19th International Conference on Geoinformatics.
Vanclooster A., Viaene P., Van de Weghe N., Fack V., De Mayer Ph. 2013. Analyzing the applicability of the least risk path algorithm in indoor space, ISPRS Annals of the Photogrammetry, Remote Sensing and Spatial Information Sciences, Volume II-4/W1.
7. ACKNOWLEDGENT