A Systematic Analysis on mRNA and
MicroRNA Expression in Runting and Stunting
Chickens
Li Zhang1,2☯, Ying Li1,3☯, Xiujuan Xie1☯, Haiping Xu1
, Zhenqiang Xu1, Jinge Ma1, Bixiao Li1, Shudai Lin1, Qinghua Nie1, Qingbin Luo1, Xiquan Zhang1
*
1Guangdong Provincial Key Lab of Agro-animal Genomics and Molecular Breeding and Key Lab of Chicken Genetics, Breeding and Reproduction, Ministry of Agriculture, South China Agricultural University,
Guangzhou, 510642, P.R. China,2Agricultural College, Guangdong Ocean University, Zhanjiang, 524088, P.R. China,3Institute of Animal Science, Guangdong Academy of Agricultural Sciences, Guangzhou, 510640, P.R. China
☯These authors contributed equally to this work. *[email protected]
Abstract
Runting and stunting syndrome (RSS), which is characterized by lower body weight, wide-ly occurs in broilers. Some RSS chickens simpwide-ly exhibit slow growth without pathological changes. An increasing number of studies indicate that broiler strains differ in susceptibili-ty to infectious diseases, most likely due to their genetic differences. The objective of this study was to detect the differentially expressed miRNAs and mRNAs in RSS and normal chickens. By integrating miRNA with mRNA expression profiling, potential molecular mechanisms involved in RSS could be further explored. Twenty-two known miRNAs and 1,159 genes were differentially expressed in RSS chickens compared with normal chick-ens (P<0.05). qPCR validation results displayed similar patterns. The differentially ex-pressed genes were primarily involved in energy metabolism pathways. The antisense transcripts were extensively expressed in chicken liver albeit with reduced abundance. Dual-luciferase reporter assay indicated that gga-miR-30b/c directly targetCARSthrough binding to its 30UTR. The miR-30b/c:CARSregulation mainly occurred in liver. In thigh
muscle and the hypothalamus, miR-30b/c are expressed at higher levels in RSS chickens compared with normal chickens from 2 to 6 w of age, and notably significant differences are observed at 4 w of age.
Introduction
Runting and stunting syndrome (RSS), which is characterized by low body weight, mainly oc-curs in broilers, and the condition is incredibly complicated [1–3]. Previous reports indicate that both genetic and environmental factors, such as diseases and feeding, are implicated in arrested development [4,5]. The body weights of RSS chickens are significantly reduced compared with normal chickens. RSS generally occurs early in life and always results in
OPEN ACCESS
Citation:Zhang L, Li Y, Xie X, Xu H, Xu Z, Ma J, et al. (2015) A Systematic Analysis on mRNA and MicroRNA Expression in Runting and Stunting Chickens. PLoS ONE 10(5): e0127342. doi:10.1371/ journal.pone.0127342
Academic Editor:Guy Brock, University of Louisville, UNITED STATES
Received:May 11, 2014
Accepted:April 14, 2015
Published:May 26, 2015
Copyright:© 2015 Zhang et al. This is an open access article distributed under the terms of the
Creative Commons Attribution License, which permits unrestricted use, distribution, and reproduction in any medium, provided the original author and source are credited.
Data Availability Statement:All relevant data are within the paper and its Supporting Information files.
considerable economic losses, particularly in the commercial broiler industry. Previous reports indicated that RSS chickens are frequently associated with viral infections, such as avian leuko-sis virus [6], reticulo endothelioleuko-sis virus [7], digestive tract disease [8], and astroviruses [3]. Currently, no effective commercial vaccine available for the control of this disease exists, pri-marily owing to the absence of known etiologic agents. In addition, some RSS chickens grow slowly without pathological changes. These chickens typically survive until sold. An increasing number of studies indicate that broiler strains differ in susceptibility to infectious diseases, most likely due to their genetic differences [9–11].
RNA sequencing (RNA-seq) technology holds great potential for disease diagnosis and ge-netic differences analyses [12]. So far, large-scale mRNA expression analysis in RSS chickens is lacking. Additionally, an increasing number of reports indicate that microRNAs (miRNAs), such as let-7b, miR-1, miR-133 and miR-206 [13,14], function in animal growth by regulating their target genes. Therefore, an integrative analysis of miRNA and mRNA interaction in RSS chickens was conducted to investigate the genetic differences between RSS and normal chick-ens and identify potential markers for growth.
In the present study, we identified differentially expressed miRNAs and mRNAs. These genes were mainly enriched in energy metabolism pathways, and these genes could serve as candidate genes for RSS chickens. The data from this study provide a combined analysis of miRNAs and mRNAs and shed new light on the fine-tuning process of growth.
Results
2.1 RSS chicken classification
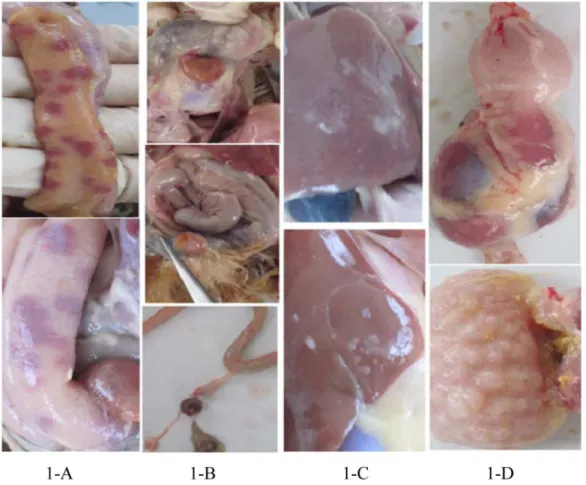
In the experiment, we dissected a total of 400 RSS chickens and 24 (6%) of them exhibited no pathological changes except for lower body weight. The remaining chickens showed various symptoms, such as intestinal bleeding, yolk malabsorption, perihepatitis and proventriculitis (Figs1and2). All the 24 RSS individuals were ALV and REV virus negative. Five negative RSS chicken and 5 normal healthy individuals were used for Solexa and Digital Gene Expression (DGE) sequencing.
2.2. Differentially expressed miRNAs between the livers of RSS and
normal chickens
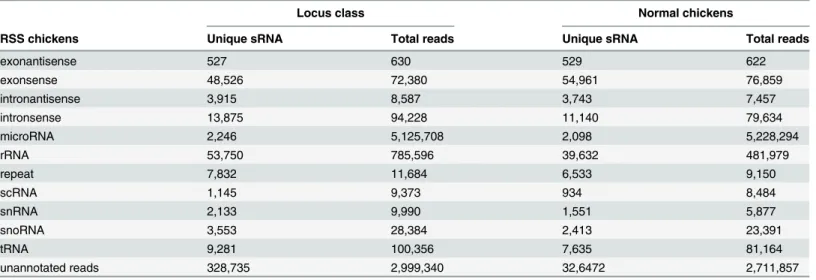
From Solexa miRNA sequencing, we obtained a total of 9,246,256 and 8,714,768 small RNA high quality reads in RSS and normal chicken livers, respectively. Length distribution analysis showed that most reads ranged from 21–23 nt with the percentage of the three types of reads being 77.18% and 79.10% for the two libraries, respectively (Fig 3). The high quality reads were subsequently annotated to different classes of RNA categories using different databases such as miRBase (V19.0), from Rfam (10.1) and Genbank to identify miRNAs, repeats-asso-ciated RNA, rRNA, tRNA, snRNA, snoRNA, etc. In total, 6,246,916 and 6,002,911 reads were annotated and the most abundant RNA species in the two libraries was classified as miRNAs (Table 1).
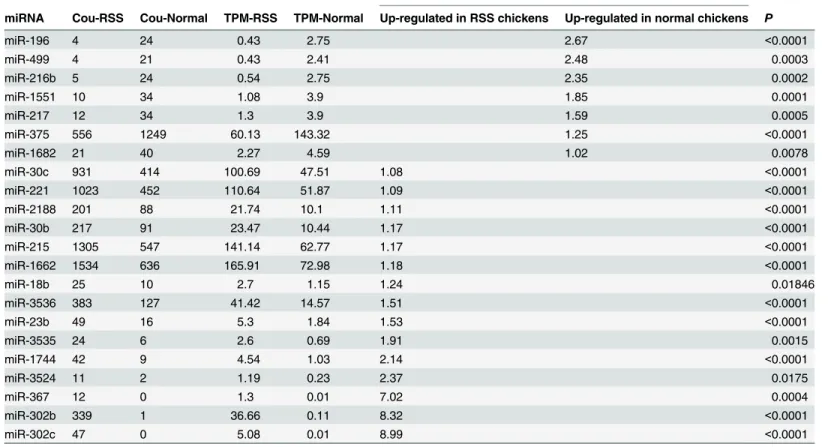
In this study, 202 and 194 known miRNAs were detected in RSS and normal chickens, re-spectively. Among these known miRNAs, 22 were differentially expressed (P<0.05 and Fold-change1) (Table 2). Four up-regulated miRNAs (miR-221, miR-30b, gga-miR-30c and gga-miR-215) and 1 down-regulated miRNA (gga-miR-375) in RSS chicken were chosen randomly to validate the Solexa sequencing results using RT-qPCR. Our results indicated that the miRNA expressions displayed patterns similar to those observed using Solexa analysis (Table 3).
Fig 1. Pathologic changes of RSS chicken.1-A, intestinal bleeding; 1-B, yolk malabsorption; 1-C, perihepatitis; 1-D, proventriculitis. doi:10.1371/journal.pone.0127342.g001
Fig 2. The types and incidences of RSS chicken.
2.3. Differentially expressed genes between RSS and normal chicken
livers
DGE-sequence obtained 3,768,716 and 3,632,492 high quality clean tags in RSS and normal chicken livers, respectively. In the obtained clean tags, 2,134,676 (56.64%) and 1,900,218 (52.31%) tags were mapped to 11,627 and 11,381chicken genes. Compared with normal chick-ens, a total of 1,159 genes (605 up-regulated and 554 down-regulated) were differentially ex-pressed (P<0.05 and Fold-change1) in RSS chickens.
To verify the DGE sequencing results, two up-regulated genes (CKAP2LandTBPL1)and six down-regulated genes (MAP2K1,KDR,CARS,MAP3K7IP2,MAP3K5andLARP7) were se-lected for qPCR analysis. The qPCR results displayed patterns similar to DGE sequencing (Table 4). Of the differentially expressed sequences, six genes (LOC415662,C1orf78,ZZEF1,
Fig 3. Length distribution of small RNA after quality trimming and adaptor removal.
doi:10.1371/journal.pone.0127342.g003
Table 1. Distribution of the genome-mapped sequence reads in small RNA libraries.
Locus class Normal chickens
RSS chickens Unique sRNA Total reads Unique sRNA Total reads
exonantisense 527 630 529 622
exonsense 48,526 72,380 54,961 76,859
intronantisense 3,915 8,587 3,743 7,457
intronsense 13,875 94,228 11,140 79,634
microRNA 2,246 5,125,708 2,098 5,228,294
rRNA 53,750 785,596 39,632 481,979
repeat 7,832 11,684 6,533 9,150
scRNA 1,145 9,373 934 8,484
snRNA 2,133 9,990 1,551 5,877
snoRNA 3,553 28,384 2,413 23,391
tRNA 9,281 100,356 7,635 81,164
unannotated reads 328,735 2,999,340 32,6472 2,711,857
CEBPA,LOC418836andFOXP2) were unique in RSS chickens, whereas 5 genes (CINP, MYH3,EEF1A2,MAP3K13andIMMP1L) were unique in normal chickens. Several immune related genes,MAP3K7IP2, T-cell immune regulator 1 (TCIRG1),MAP2K1,STAT5B,SOCS2, CSF1R,EXTL3andGAMTwere also differentially expressed in RSS versus normal chickens. Notably,MAP3K7IP2andTCIRG1are related to the T cell receptor (TCR) signaling pathway,
Table 2. miRNAs differentially expressed in the livers of RSS and normal chickens.
Fold-change(|log2 TPM Normal/TPM RSS|)
miRNA Cou-RSS Cou-Normal TPM-RSS TPM-Normal Up-regulated in RSS chickens Up-regulated in normal chickens P
miR-196 4 24 0.43 2.75 2.67 <0.0001
miR-499 4 21 0.43 2.41 2.48 0.0003
miR-216b 5 24 0.54 2.75 2.35 0.0002
miR-1551 10 34 1.08 3.9 1.85 0.0001
miR-217 12 34 1.3 3.9 1.59 0.0005
miR-375 556 1249 60.13 143.32 1.25 <0.0001
miR-1682 21 40 2.27 4.59 1.02 0.0078
miR-30c 931 414 100.69 47.51 1.08 <0.0001
miR-221 1023 452 110.64 51.87 1.09 <0.0001
miR-2188 201 88 21.74 10.1 1.11 <0.0001
miR-30b 217 91 23.47 10.44 1.17 <0.0001
miR-215 1305 547 141.14 62.77 1.17 <0.0001
miR-1662 1534 636 165.91 72.98 1.18 <0.0001
miR-18b 25 10 2.7 1.15 1.24 0.01846
miR-3536 383 127 41.42 14.57 1.51 <0.0001
miR-23b 49 16 5.3 1.84 1.53 <0.0001
miR-3535 24 6 2.6 0.69 1.91 0.0015
miR-1744 42 9 4.54 1.03 2.14 <0.0001
miR-3524 11 2 1.19 0.23 2.37 0.0175
miR-367 12 0 1.3 0.01 7.02 0.0004
miR-302b 339 1 36.66 0.11 8.32 <0.0001
miR-302c 47 0 5.08 0.01 8.99 <0.0001
doi:10.1371/journal.pone.0127342.t002
Table 3. RT-qPCR validation of miRNA expression (RSSVs. Control).
Fold-change (|log2 TPM RSS/TPM Normal|) (Solexa sequencing)
Fold-change (|log2 relative expression in RSS/in Normal|) (RT-qPCR)
miRNA Up-regulated in RSS chicken
Down-regulated in RSS chicken
Up-regulated in RSS chicken
Down-regulated in RSS chicken
Trends
gga-miR-221
2.13 3.21 identical
gga-miR-30b
2.25 2.34 identical
gga-miR-30c
2.12 2.31 identical
gga-miR-215
2.25 1.97 identical
gga-miR-375
2.38 2.46 identical
which has important functions in animal immunity [15]. Both genes exhibited significantly dif-ferent expression in RSS versus normal chickens (P<0.001).
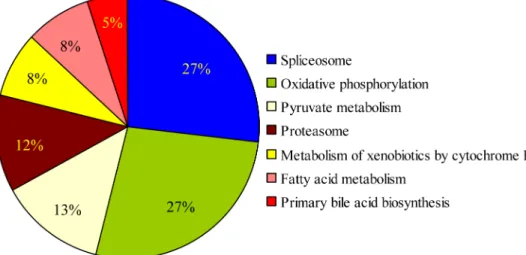
To explore the biological meaning of the differentially expressed genes, DAVID v6.7 (http:// david.abcc.ncifcrf.gov/), MAS3.0 (http://bioinfo.capitalbio.com/mas3/) and BGI-Cloud (http:// bgiamericas.com/data-analysis/bioinformatics-software/) functional annotation tools were em-ployed. Ninety-two known genes were successfully annotated with confident matches, and these genes were involved in 7 pathways, including fatty acid metabolism, oxidative phosphor-ylation, etc. (Fig 4).
2.4. Antisense transcription
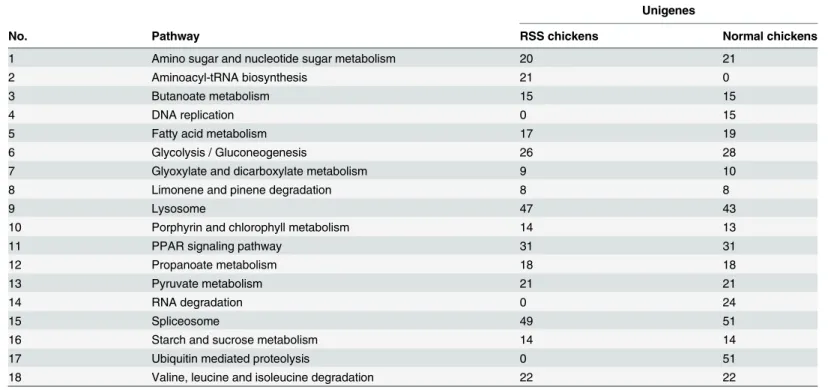
In the present study, 7,237 genes in RSS and 7,363 genes in normal chickens were found to pos-sess antisense transcripts, thereby indicating that the antisense transcripts were extensively ex-pressed in chicken liver. The majority of the antisense tags were exex-pressed in lower abundance than their corresponding sense tags. KEGG analysis of the genes with antisense tags implied that these genes were notably enriched in 15 pathways in RSS chickens and 17 pathways in
Table 4. RT-qPCR validation of DGE results (RSSVs. Control).
Fold-change (DGE) (|log2 TPM RSS/TPM Normal |) Fold-change(RT-qPCR) (|log2 relative expression in RSS/ in Normal|)
Gene Up-regulated in RSS chicken
Down-regulated in RSS chicken
Up-regulated in RSS chicken
Down-regulated in RSS chicken
Trends
CKAP2L 14.16 2.18 identical
TBPL1 7.67 1.7 identical
MAP2K1 4.6 1.03 identical
KDR 9.55 1.1 identical
CARS 2.11 1.48 identical
MAP3K7IP2 2.36 1.91 identical
MAP3K5 6.21 1.80 identical
LARP7 1.25 1.44 identical
doi:10.1371/journal.pone.0127342.t004
Fig 4. The distribution of matches to gene ontology categories.In total, 1159 differentially expressed genes, identified using the DAVID v6.7, MAS3.0 and BGI-Cloud annotation tools, were enriched in seven pathways.
normal chickens (P<0.05,Table 5). The amino acyl-tRNA biosynthesis pathway was particu-larly enriched in RSS chickens, whereas DNA replication, RNA degradation and ubiquitin-me-diated proteolysis pathways were enriched in normal chickens (Table 5).
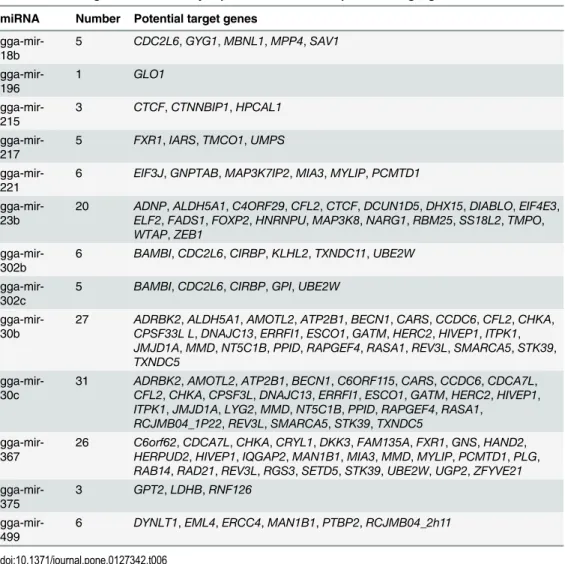
2.5. Integrative analysis of miRNA and mRNA expression data
The target genes of 22 differentially expressed miRNAs were predicted using Targetscan (http://www.targetscan.org/), Microcosm (http://www.ebi.ac.uk/enright-srv/microcosm/ htdocs/targets/v5/info.html), miRDB (http://mirdb.org/miRDB/) and RNAhybrid (http:// bibiserv.techfak.uni-bielefeld.de/rnahybrid/). The overlapping genes obtained from the four programs were considered candidate target genes. Consequently, 149 coordinated genes, which displayed differentially expressed mRNAs and were also potential targets of miRNAs, were identified (Table 6). Several genes, such as cysteinyl-tRNA synthetase (CARS), were related to development. CARS has various biological functions, such asATPbinding and tRNA binding. The humanCARSgene is located on chromosome band 11p15.5, and chromosomal rearrange-ments in the region are associated with Silver-Russell syndromes [16] and Beck with-Wiede-mann syndromes [17].
2.6. gga-miR-30b/c directly target
CARS
through binding to its 3
0UTR
Previous studies reported that gga-miR-30b/c were involved with growth and development
[18–22]. The inhibitory relationship between gga-miR-30b/c and their predicted target gene
CARSwas verified using luciferase reporter assays. The wild-type and mutated target sequences ofCARS30UTR were introduced into pmirGLO vector (Promega Biotech Co., Ltd., China), We co-transfected 200 ng pmirGLO-CARS or pmirGLO-CARS mutant, with 600 ng
pCDNA3.1-miR-30b/c plasmid, into DF-1 cells. Thirty-six hours later, the cells were lysed, and
Table 5. The involvement of antisense genes in pathways predicted by KEGG enrichment analysis.
Unigenes
No. Pathway RSS chickens Normal chickens
1 Amino sugar and nucleotide sugar metabolism 20 21
2 Aminoacyl-tRNA biosynthesis 21 0
3 Butanoate metabolism 15 15
4 DNA replication 0 15
5 Fatty acid metabolism 17 19
6 Glycolysis / Gluconeogenesis 26 28
7 Glyoxylate and dicarboxylate metabolism 9 10
8 Limonene and pinene degradation 8 8
9 Lysosome 47 43
10 Porphyrin and chlorophyll metabolism 14 13
11 PPAR signaling pathway 31 31
12 Propanoate metabolism 18 18
13 Pyruvate metabolism 21 21
14 RNA degradation 0 24
15 Spliceosome 49 51
16 Starch and sucrose metabolism 14 14
17 Ubiquitin mediated proteolysis 0 51
18 Valine, leucine and isoleucine degradation 22 22
the luciferase activity was measured using the Dual Luciferase Assay according to the manufac-turer’s protocol (Promega Biotech Co., Ltd., China). Compared with the cells that were trans-fected with pmirGLO-CARS mutant, the luciferase activity ofCARS30UTR wild-type was significantly decreased. Also, the luciferase activity of the mock transfection was higher than that of the wild-type group (Fig 5). These results indicated thatCARS30UTRwas directly tar-geted by miR-30b/c.
2.7. Temporal and spatial expression of miR-30b/c and
CARS
gene in
RSS chickens
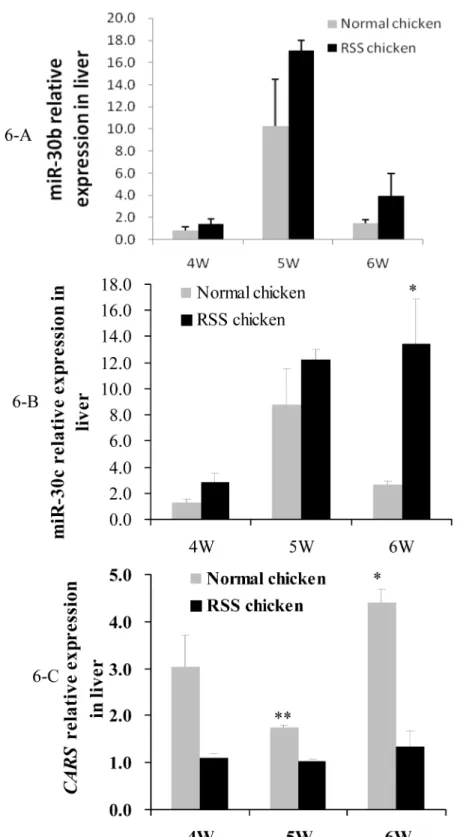
We firstly compared the miR-30b/c andCARSexpression between normal and RSS chicken liv-ers at three time points (Fig 6). qPCR results indicated that miR-30b/c were expressed in a higher level in RSS chicken than in the normal chickens, whileCARSshowed in an inversed trend. The differences of miR-30c andCARSbetween the two types of chickens reached a sig-nificant level at 5 or 6 w of age (Fig6-Band6-C) (P<0.05). P value of miR-30b at 6 w of age was 0.08, very close to the statistically significant level (Fig 6-A).
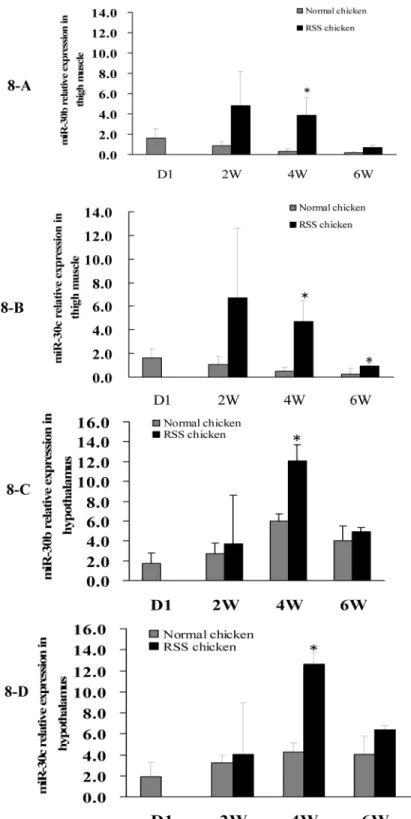
Secondly, we detected the miR-30b/c andCARSexpression in pectoral muscle, thigh muscle, liver, hypothalamus and pituitary of chicken at 7 w of age and found that miR-30b in thigh
Table 6. The integrative differentially expressed miRNAs and potential target genes.
miRNA Number Potential target genes
gga-mir-18b
5 CDC2L6,GYG1,MBNL1,MPP4,SAV1
gga-mir-196
1 GLO1
gga-mir-215
3 CTCF,CTNNBIP1,HPCAL1
gga-mir-217
5 FXR1,IARS,TMCO1,UMPS
gga-mir-221
6 EIF3J,GNPTAB,MAP3K7IP2,MIA3,MYLIP,PCMTD1
gga-mir-23b
20 ADNP,ALDH5A1,C4ORF29,CFL2,CTCF,DCUN1D5,DHX15,DIABLO,EIF4E3,
ELF2,FADS1,FOXP2,HNRNPU,MAP3K8,NARG1,RBM25,SS18L2,TMPO,
WTAP,ZEB1
gga-mir-302b
6 BAMBI,CDC2L6,CIRBP,KLHL2,TXNDC11,UBE2W
gga-mir-302c
5 BAMBI,CDC2L6,CIRBP,GPI,UBE2W
gga-mir-30b
27 ADRBK2,ALDH5A1,AMOTL2,ATP2B1,BECN1,CARS,CCDC6,CFL2,CHKA,
CPSF33L L,DNAJC13,ERRFI1,ESCO1,GATM,HERC2,HIVEP1,ITPK1,
JMJD1A,MMD,NT5C1B,PPID,RAPGEF4,RASA1,REV3L,SMARCA5,STK39,
TXNDC5
gga-mir-30c
31 ADRBK2,AMOTL2,ATP2B1,BECN1,C6ORF115,CARS,CCDC6,CDCA7L,
CFL2,CHKA,CPSF3L,DNAJC13,ERRFI1,ESCO1,GATM,HERC2,HIVEP1,
ITPK1,JMJD1A,LYG2,MMD,NT5C1B,PPID,RAPGEF4,RASA1,
RCJMB04_1P22,REV3L,SMARCA5,STK39,TXNDC5
gga-mir-367
26 C6orf62,CDCA7L,CHKA,CRYL1,DKK3,FAM135A,FXR1,GNS,HAND2,
HERPUD2,HIVEP1,IQGAP2,MAN1B1,MIA3,MMD,MYLIP,PCMTD1,PLG,
RAB14,RAD21,REV3L,RGS3,SETD5,STK39,UBE2W,UGP2,ZFYVE21
gga-mir-375
3 GPT2,LDHB,RNF126
gga-mir-499
6 DYNLT1,EML4,ERCC4,MAN1B1,PTBP2,RCJMB04_2h11
muscles andCARSin hypothalami were differentially expressed between RSS and normal chickens (Fig 7). Hypothalamic-pituitary system can regulate hormone secretion and further affect animal growth. In addition, thigh muscle weight was an important economic trait in live-stock production. Subsequently, qPCR was conducted to compare the expression of miR-30b/c andCARSin thigh muscle and hypothalami between RSS and normal chickens at various de-velopmental stages (1 d, 2w, 4wand 6w of age). From 2 to 6 w, miR-30b/c expression was in-creased in the thigh muscles and hypothalami of RSS chickens compared with normal chickens, and it is notable that significant differences (P<0.05) appeared at 4 w of age (Fig 8). CARSexpression varied inversely with miR-30b/c expression at 4 w and 6 w of age, although the differences did not attain to statistical significance (P>0.05) (Fig 9).
2.8. Variation analysis of 3
’
UTR of
CARS
gene
We hypothesized thatCARSgene variation most likely evened the expression differences be-tween RSS and normal chickens. The 3’UTR of theCARSgene was amplified to detect varia-tions in RSS or normal chicken DNA samples. However, the nucleotide sequence alignments indicated no nucleotide mutations in the amplified fragment.
2.9. Western blot analysis CARS protein in thigh muscle
Both in normal and in RSS chicken, CARS protein showed an increasing trend along with chicken development. But no obvious differences were observed in thigh muscles as compared normal with RSS chickens at the same stage because of individual differences (Fig 10).
Fig 5. Dual-luciferase reporter assay for the 30UTR ofCARSas the target site of miR-30b/c in vitro.pCDNA3.1-miR-30b/c plasmid were cotransfected with the pmirGLO-CARS30UTR, pmirGLO-CARS30UTR mutation, or the control plasmid into DF-1 cells. The relative luciferase activities were measured.
Fig 6. Comparison of the miR-30b/c andCARSexpression in livers of RSS and normal chickens at 4, 5 and 6 w of age.6-A, comparison of miR-30b expression in livers. 6-B, comparison of miR-30c expression in livers. 6-C, comparison ofCARSmRNA expression in livers.
Fig 7. Comparisons ofCARSmRNA and miR-30b/c in various tissues between RSS and normal chickens at 7 w of age.7-A, miR-30b expression profile comparison; 7-B, miR-30c expression profile comparison; 7-C,CARSmRNA expression profile comparison.“*”represents miR-30b/c orCARSwas differentially expressed between RSS and normal chickens (P<0.5).
Fig 8. Comparison of miR-30b/30c expression in thigh muscles and hypothalami of RSS and normal chickens at day 1 (D1), 2, 4 and 6 w of age.Quantitative RT-PCR assays of miR-30b and miR-30c expression using total RNA isolated from the chicken thigh muscle and hypothalamus at day1 (D1), 2, 4 and 6 w of age.“*”represents miR-30b or c was differentially expressed between RSS and normal chickens (P<0.5).
Discussion
An increasing number of studies indicate that broiler strains differ in susceptibility to infectious diseases, most likely due to their genetic differences [9–11]. In this study, we found 6% RSS chickens exhibiting no pathological changes except for lower body weight. And further we ob-served significant differences in mRNA and miRNA profiles between RSS and normal chick-ens. qPCR results of the randomly selected miRNAs and mRNAs displayed good consistency with deep sequencing. In total, 1,159 genes were differentially expressed according to the DGE sequence. Of particular note, six genes (LOC415662,C1orf78,ZZEF1,CEBPA,LOC418836and FOXP2) were specifically expressed in RSS chickens, whereas 5 genes (CINP,MYH3,EEF1A2, MAP3K13andIMMP1L)were exclusively detected in the livers of normal chickens.
MAP3K7IP2, also known as TAB2, is a member of the IL-1 signal transduction pathway, which is a central regulator of immune and inflammatory responses. Moreover, TAB2 is also involved in NF-kappaB activation in the TCR signaling pathway, which plays a key role in the adaptive immune response [23,24]. Previous cDNA microarray results indicated that im-mune-related genes were differentially expressed in the intestines of malabsorption syndrome broilers compared with control [10]. Malabsorption syndrome broilers exhibited growth retar-dation and weight gain depression, and these symptoms are similar to those observed in RSS chickens. Additionally, intestinal cell-mediated immunity also plays a crucial role in broiler de-velopment [25]. In short, immunity plays important roles in chicken growth and could be in-volved in RSS in chickens.
Pathway analysis revealed that the aforementioned genes were involved in 7 pathways at a significant level. It was notable that the enriched pathways were mainly related to energy me-tabolism, including oxidative phosphorylation, pyruvate meme-tabolism, fatty acid metabolism and primary bile acid biosynthesis pathways. Previous comparative analyses indicated that meat-type chickens, which display a very rapid growth rate, have a higher oxidative phosphory-lation efficiency compared with laying-type chickens [26]. In the current study, most genes in the oxidative phosphorylation pathway, such as NADH dehydrogenase (ubiquinone) 1 alpha subcomplex family genes, are expressed at lower levels in RSS chickens compared with normal chickens. Moreover, chickens displaying pale bird syndrome symptoms exhibit a substantial reduction in utilized dietary energy and absorbed lipids compared with normal birds from the commercial farm [27], thereby suggesting that energy metabolism is important in chicken growth.
Identification of the complicated regulation mechanisms among natural antisense transcripts, miRNAs and mRNAs in animal growth and human health is a great challenge. The latest re-sults on antisense transcription provide an important clue; through an RNA-RNA pairing in-teraction, the PTENpg antisense transcript affects PTEN protein output by altering PTENpg stability and miRNA sponge activity [30].
Twenty-two differentially expressed miRNAs from liver were identified from Solexa se-quencing results. The integration of global profiling of miRNAs and mRNA expression poten-tially provides a unique opportunity in understanding animal growth [31,32]. Gga-miR-30b and gga-miR-30c share the same seed regions and belong to the gga-miR-30 family. Members of the miR-30 family function in osteoblast differentiation, adipogenic differentiation, angio-genesis, myocardial matrix remodeling and cell apoptosis by targeting various pathways [18–
22,33]. In this study, gga-miR-30b/c expression was increased in liver in RSS chickens
com-pared with normal chickens. TheCARSgene was proven as the target of miR-30b/c. gga-miR-30b/c andCARSin liver showed inversed expression trends, especially at age of 6w (P<0.05). Also, gga-miR-30b/c expression was increased in the thigh muscle and hypothalamus in RSS chickens compared with normal chickens at the indicated time points. The differences achieved statistical significance at 4 w of age when the maximum gap of body weight was observed
Fig 9. Comparison ofCARSgene expression in thigh muscles and hypothalami of RSS and normal
between RSS and control chickens [10]. But in the two tissues, theCARSmRNA and protein expression did not demonstrate marked differences. In short, abnormal expression of gga-miR-30b/c andCARSmight lead to RSS chickens by affecting liver metabolism and function.
In addition, variation analysis indicates that no mutations were present in the 3’UTR of this gene. Recent studies showed that the post-transcription regulation mechanism was far more complicated than we expected, and increased dark matters, such as long noncoding RNA, have been confirmed to function in growth and health [34]. Hence, further studies are needed to clarify the role of miR-30b/c in regulating muscle development.
Materials and Methods
4.1. Ethics statement
The Animal Care Committee of South China Agricultural University (Guangzhou, People's Re-public of China) approved this study (approval number SCAU#0017). Animals involved in this study were humanely sacrificed as necessary to ameliorate suffering.
4.2. Sample collection
Four hundred female RSS yellow-feathered broiler chickens were dissected at 52 d of age. The ones, exhibiting no obvious pathological changes except for lower body weight, were selected for ALV and REV viruses detection. Five negative RSS chickens and 5 normal healthy individu-als were used for Solexa and DGE sequencing.
4.3. Liver DNA and RNA extraction
Genomic DNA samples were used for ALV and REV virus detection and isolated from livers by a phenolic extraction protocol. Total RNA was extracted from 5 RSS and 5 normal chicken livers using Trizol (Invitrogen, Carlsbad, CA, USA) following the manufacturer’s protocol.
Fig 10. Comparison of CARS protein in thigh muscle between RSS and normal chicken at 2, 4 and week 6.Western blot was conducted to monitor CARS protein differentiation between RSS and normal chickens at 2 (10-A), 4 (10-B) and 6 (10-C) w of age. N1–N3 were normal chickens while R1–R3 were RSS individuals.
Total RNA was tested via agarose electrophoresis, Qubit-fluorometer and Agilent 2100. The five RNA samples isolated from each type of chicken were pooled with equal amounts from individual chickens.
4.4. Solexa sequencing of miRNA and Q-RT-PCR validation
The small RNAs (sRNA) were enriched from chicken livers to construct libraries for Solexa se-quencing according to previous report [35]. Briefly, 18–40 base pair long RNA fragments were isolated from total RNA using a Novex 15% TBE-Urea gel (Invitrogen). Then, a 5' and 3' adap-tor (Illumina, San Diego, CA, USA) were ligated to purified small RNAs followed by purifica-tion of ligapurifica-tion products on a Novex 15% TBE-Urea gel. These ligapurifica-tion products were subsequently reverse transcribed and PCR amplified. The purified DNA fragments were used for sequencing using an Illumina Genome Analyzer at the Beijing Genomics Institute, Shen-zhen, China. After removing the adaptor/acceptor sequences, filtering the low quality tags and cleaning up the contamination formed by the adaptor-adaptor ligation, the occurrence of each unique sequence reads was counted as sequence tags. We compared the miRNA expression be-tween two kinds of sample and found out the differentially expressed miRNAs according to previous report [36,37]. Briefly, we normalized the expression of miRNA in two samples (RSS and normal chicken) to get the expression of transcript per million (TPM-Normal and TPM-RSS) at first. Secondly, we calculated fold-change andP-value from the normalized ex-pression. According to previous research, denote the number of unambiguous clean tag from gene A asx, as every gene's expression occupies only a small part of the library, thep(x) is in the Poisson distribution [36,37].
pðX¼xÞ ¼e llx
x!
(λrepresents the population mean tag number ofx; The capital X represents random variables
for the read counts.)
The probability of gene A expressed equally between two samples can be calculated with:
pðY ¼yjxÞ ¼ N2
N1
y ð
xþyÞ! x!y!ð1þN2
N1Þ ðxþyþ1Þ
(The total clean tag number of the sample 1 isN1, and total clean tag number of sample 2 is N2; gene A holdsxtags in sample1 andytags in sample2; Thexandyare not normalized. The capital Y represents random variables for the read counts)
To compute the confidence intervals, we made use of the cumulative distributions:
CðyyminjxÞ ¼
Xyymin
y¼0 pðyjxÞandDðyymaxjxÞ ¼
X1 yymaxp
ðyjxÞ
which allow the computation of an interval [ymin,ymax]εand serve as a significance test when
comparing [36,37]. The intervals are given for the 95% (2ε= 0.05) and 99% (2ε= 0.01) confi
-dence levels and theP-value can be calculated as follows when the transcript countyandxof one gene between the two samples were compared:Without loss of geneality, assume thaty>x
p value¼2PðYyjxÞ ¼XPðY ¼
yyyjxÞ
according to previous report [38] because we decide that the error ratio "Q = V/R" must stay below a cutoff (e.g. 0.1%).
For sequencing data, fold change was calculated according to the following formula,
Fold change ¼jlog2Ratioj¼ jlog2ðTPM Normal= TPM RSSÞ j
One miRNA will be considered as differentially expressed between two types of samples when P<0.05 and fold change1. The differentially expressed miRNAs were selected to verify the results of Solexa sequencing using a miScript Reverse Transcription Kit and miScript SYBR GreenPCR Kit (Qiagen).
4.5. Digital gene expression sequencing of mRNA and Q-RT-PCR
validation
DGE sequencing of mRNA was documented previously [28]. Briefly, cDNA was digested with NIaIII to obtain a cDNA fragment from the most 3' CATG to the poly(A)-tail. Subsequently, GEX adapter 1 was ligated to the free 5' end of the RNA, and the construct was digested with MmeI, which cuts 17 bp downstream of the CATG site. PCR was performed with primers to enrich the desired fragments. A preprocessed database of all possible CATG+17nt tag se-quences was formed using the chicken genome and transcriptome.
One gene will be considered as differentially expressed between two types of samples when P<0.05 and fold change1. The false discovery rate (FDR) was analyzed according to the method reported by Benjamini Yekutieli [38]. P value and fold change were calculated with for-mulas listed above. Eight differentially expressed genes were selected to confirm the results of DGE sequencing by Q-RT-PCR (ReverTraAce qPCR RT Kit).
4.6. Pathway analysis
Three pathway annotation tools, including DAVID v6.7 (http://david.abcc.ncifcrf.gov/), MAS3.0 (http://bioinfo.capitalbio.com/mas3/) and BGI-Cloud (http://bgiamericas.com/data-analysis/bioinformatics-software/), were used to analyze the differentially expressed genes. Pathways withP<0.05 and FDR0.05 were considered as significantly enriched in these genes.
4.7. Dual-luciferase activity assay
The wild-type and mutated target sequences ofCARS30UTR predicted as target of gga-miR-30b/c was amplified by PCR from chicken cDNA and inserted into the downstream of lucifer-ase reporter gene in the pmirGLO vector (Promega Biotech Co., Ltd., China) (pmirGLO-CARS). The pri-miR-30b/c and the flanking sequences, obtained by PCR from chicken DNA, were inserted into pCDNA3.1+ expression vector (Invitrogen) and subsequently were de-scribed as pCDNA3.1-miR-30b/c. pmirGLO-CARS and pCDNA3.1-miR-30b/c plasmids were cotransfected into chick DF-1 cell lines with lipofectamine 3000 reagent (Invitrogen). The rela-tive luciferase activity was detected 36 hours later according to the manufacturing protocol of dual luciferase reporter gene assay kit (Promega Biotech Co., Ltd., China).
4.8. Western blot
fluoride membranes. After blocked in 5% nonfat dry milk in TPBS (0.1% Tween 20 in PBS) for 1 h, membranes were incubated with monoclonal anti-CARS antibody (ab83256, Abcam, SA, USA) overnight at 4°C. After five washes in 5% milk/TPBS 5 min each, membranes were incu-bated in goat anti-rabbit IgG conjugated with horseradish perioxidase for 1 h followed by two washes in 5% nonfat milk in TPBS, TPBS and PBS 5 min each, respectively. The signals were developed in BeyoECL Plus (Beyotime Institude of Biotech, China). The protein levels were normalized to GAPDH.
4.9. Variation analysis of
CARS
gene
PCR and sequencing methods were conducted to analyze variations in the 3’UTR ofCARS (GenBank accession No. NC_006092) gene.
4.10. Statistical analysis
T-test was used to make miR-30b/c andCARStemporal and spatial expression comparisons between RSS and normal chickens.
Supporting Information
S1 Table. Differentially expressed genes between RSS and normal chickens.(XLSX) (XLSX)
S2 Table. The differentially expressed genes in the enriched pathways.(DOCX) (DOCX)
S3 Table. Primers for REV and ALV viruses detection.(DOCX) (DOCX)
S4 Table. Primers for miRNA Real-time PCR.(DOCX) (DOCX)
S5 Table. Primers for mRNA Real-time PCR.(DOCX) (DOCX)
S6 Table. Primers used for amplifying 3’-UTR ofCARSand pri-miR-30b/c.(DOCX)
(DOCX)
S7 Table. Primers used for variation analysis ofCARSgene.(DOCX)
(DOCX)
Acknowledgments
This work was supported by the Chinese Postdoctoral Science Foundation (2012M521611, 2013T60808), the National Natural Science Foundation (31301958), the Guangdong Provincial Natural Science Foundation (S2013010013382) and the China Agriculture Research System (CARS-42-G05).
Author Contributions
References
1. Rebel JM, Balk FR, Boersma WJ. Cytokine responses in broiler lines that differ in susceptibility to mal-absorption syndrome. Br Poult Sci. 2005; 46: 679–686. PMID:16428110
2. Kouwenhoven B, Davelaar FG, Van Walsum J. Infectious proventriculitis causing runting in broilers. Avian Pathol. 1978; 7: 183–187. PMID:18770369
3. Kang KI, El-Gazzar M, Sellers HS, Dorea F, Williams SM, Kim T, et al. Investigation into the aetiology of runting and stunting syndrome in chickens. Avian Pathol. 2012; 41: 41–50. doi:10.1080/03079457. 2011.632402PMID:22845320
4. Otto P, Liebler-Tenorio EM, Elschner M, Reetz J, Lohren U, Diller R. Detection of rotaviruses and intes-tinal lesions in broiler chicks from flocks with runting and stunting syndrome (RSS). Avian Dis. 2006; 50: 411–418. PMID:17039842
5. Rebel JM, van Dam JT, Zekarias B, Balk FR, Post J, Flores Miñambres A, et al. Vitamin and trace min-eral content in feed of breeders and their progeny: effects of growth, feed conversion and severity of malabsorption syndrome of broilers. Br Poult Sci. 2004; 45: 201–209. PMID:15222417
6. Hellal KY, Bourogaa H, Gribaa L, Scott-Algara D, Ghram A. Molecular characterization of avian reovirus isolates in Tunisia. Virol J. 2013; 10: 12. doi:10.1186/1743-422X-10-12PMID:23289825
7. Bolisetty MT, Dy G, Tam W, Beemon KL. Reticuloendotheliosis virus strain T induces miR-155, which targets JARID2 and promotes cell survival. J Virol. 2009; 83: 12009–12017. doi:10.1128/JVI.01182-09 PMID:19759154
8. Winstead CS, Meinecke CF, Miller A, Beasley JN, Skeeles K, Stephenson EL. Factors related to the in-cidence of the malabsorption syndrome. Poult Sci. 1985; 64: 499–501. PMID:3991423
9. Zekarias B, Songserm T, Post J, Kok GL, Pol JM, Engel B, et al. Development of organs and intestinal mucosa leukocytes in four broiler lines that differ in susceptibility to malabsorption syndrome. Poult Sci. 2002; 81: 1283–1288. PMID:12269605
10. van Hemert S, Hoekman AJ, Smits MA, Rebel JM. Differences in intestinal gene expression profiles in broiler lines varying in susceptibility to malabsorption syndrome. Poult Sci. 2004; 83: 1675–1682. PMID:15510552
11. Kaiser MG, Wing T, Lamont SJ. Effect of genetics, vaccine dosage, and postvaccination sampling inter-val on early antibody response to Salmonella enteritidis vaccine in broiler breeder chicks. Poult Sci. 1998; 77: 271–275. PMID:9495492
12. Costa V, Aprile M, Esposito R, Ciccodicola A. RNA-Seq and human complex diseases: recent accom-plishments and future perspectives. Eur J Hum Genet. 2013; 21: 134–142. doi:10.1038/ejhg.2012.129 PMID:22739340
13. Lin S, Li H, Mu H, Luo W, Li Y, Jia X, et al. Let-7b regulates the expression of the growth hormone re-ceptor gene in deletion-type dwarf chickens. BMC Genomics. 2012; 13: 306. doi: 10.1186/1471-2164-13-306PMID:22781587
14. Townley-Tilson WH, Callis TE, Wang D. MicroRNAs 1, 133, and 206: critical factors of skeletal and car-diac muscle development, function, and disease. Int J Biochem Cell Biol. 2010; 42: 1252–1255. doi: 10.1016/j.biocel.2009.03.002PMID:20619221
15. Shi M, Deng W, Bi E, Mao K, Ji Y, Lin G, et al. TRIM30 alpha negatively regulates TLR-mediated NF-kappa B activation by targeting TAB2 and TAB3 for degradation. Nat Immunol. 2008; 9: 369–377. doi: 10.1038/ni1577PMID:18345001
16. Hu J, Sathanoori M, Kochmar S, Madan-Khetarpal S, McGuire M, Surti U. Co-existence of 9p deletion and Silver-Russell syndromes in a patient with maternally inherited cryptic complex chromosome rear-rangement involving chromosomes 4, 9, and 11. Am J Med Genet A. 2013; 161A: 179–184. doi:10. 1002/ajmg.a.35658PMID:23225375
17. Choufani S, Shuman C, Weksberg R. Molecular findings in Beckwith-Wiedemann syndrome. Am J Med Genet C Semin Med Genet. 2013; 163C: 131–140. doi:10.1002/ajmg.c.31363PMID:23592339
18. Duisters RF, Tijsen AJ, Schroen B, Leenders JJ, Lentink V, van der Made I, et al. miR-133 and miR-30 regulate connective tissue growth factor: implications for a role of microRNAs in myocardial matrix re-modeling. Circ Res. 2009; 104: 170–178, 6p–178p. doi:10.1161/CIRCRESAHA.108.182535PMID: 19096030
19. Wu T, Zhou H, Hong Y, Li J, Jiang X, Huang H. miR-30 family members negatively regulate osteoblast differentiation. J Biol Chem. 2012; 287: 7503–7511. doi:10.1074/jbc.M111.292722PMID:22253433
21. Zaragosi LE, Wdziekonski B, Brigand KL, Villageois P, Mari B, Waldmann R, et al. Small RNA sequenc-ing reveals miR-642a-3p as a novel adipocyte-specific microRNA and miR-30 as a key regulator of human adipogenesis. Genome Biol. 2011; 12: R64. doi:10.1186/gb-2011-12-7-r64PMID:21767385
22. Bridge G, Monteiro R, Henderson S, Emuss V, Lagos D, Georgopoulou D, et al. The microRNA-30 fam-ily targets DLL4 to modulate endothelial cell behavior during angiogenesis. Blood. 2012; 120: 5063–
5072. doi:10.1182/blood-2012-04-423004PMID:23086751
23. Ma Q, Zhou L, Shi H, Huo K. NUMBL interacts with TAB2 and inhibits TNFalpha and IL-1beta-induced NF-kappaB activation. Cell Signal. 2008; 20: 1044–1051. doi:10.1016/j.cellsig.2008.01.015PMID: 18299187
24. O'Neill LA, Greene C. Signal transduction pathways activated by the IL-1 receptor family: ancient sig-naling machinery in mammals, insects, and plants. J Leukoc Biol. 1998; 63: 650–657. PMID:9620655
25. Songserm T, Engel B, van Roozelaar DJ, Kok GL, Pijpers A, Pol JM, et al. Cellular immune response in the small intestine of two broiler chicken lines orally inoculated with malabsorption syndrome homoge-nates. Vet Immunol Immunopathol. 2002; 85: 51–62. PMID:11867167
26. Toyomizu M, Kikusato M, Kawabata Y, Azad MA, Inui E, Amo T. Meat-type chickens have a higher effi-ciency of mitochondrial oxidative phosphorylation than laying-type chickens. Comp Biochem Physiol A Mol Integr Physiol. 2011; 159: 75–81. doi:10.1016/j.cbpa.2011.01.020PMID:21300168
27. Lilburn MS, Edwards HJ, Jensen LS. Impaired nutrient utilization associated with pale bird syndrome in broiler chicks. Poult Sci. 1982; 61: 608–09. PMID:7088815
28. Li JT, Zhang Y, Kong L, Liu QR, Wei L. Trans-natural antisense transcripts including noncoding RNAs in 10 species: implications for expression regulation. Nucleic Acids Res. 2008; 36: 4833–44. doi:10. 1093/nar/gkn470PMID:18653530
29. Sissler M, Delorme C, Bond J, Ehrlich SD, Renault P, Francklyn C. An aminoacyl-tRNA synthetase paralog with a catalytic role in histidine biosynthesis. Proc Natl Acad Sci U S A. 1999; 96: 8985–8990. PMID:10430882
30. Johnsson P, Ackley A, Vidarsdottir L, Lui WO, Corcoran M, Grandér D, et al. A pseudogene long-non-coding-RNA network regulates PTEN transcription and translation in human cells. Nat Struct Mol Biol. 2013; 20: 440–446. doi:10.1038/nsmb.2516PMID:23435381
31. Wang Y, Brahmakshatriya V, Lupiani B, Reddy SM, Benham AL, et al. Integrated analysis of microRNA expression and mRNA transcriptome in lungs of avian influenza virus infected broilers. BMC Genomics. 2012; 13: 278. doi:10.1186/1471-2164-13-278PMID:22726614
32. Zhou L, Chen J, Li Z, Li X, Hu X, Huang Y, et al. Integrated profiling of microRNAs and mRNAs: micro-RNAs located on Xq27.3 associate with clear cell renal cell carcinoma. PLoS One. 2010; 5: e15224. doi:10.1371/journal.pone.0015224PMID:21253009
33. Yu F, Deng H, Yao H, Liu Q, Su F, Song E. Mir-30 reduction maintains self-renewal and inhibits apopto-sis in breast tumor-initiating cells. Oncogene. 2010; 29: 4194–4204. doi:10.1038/onc.2010.167PMID: 20498642
34. Michalik KM, You X, Manavski Y, Doddaballapur A, Zornig M, Braun T, et al. The Long Noncoding RNA MALAT1 Regulates Endothelial Cell Function and Vessel Growth. Circ Res. 2014; 113: 303265.
35. Zhang L, Nie Q, Su Y, Xie X, Luo W, Jia X, et al. MicroRNA profile analysis on duck feather follicle and skin with high-throughput sequencing technology. Gene. 2013; 519: 77–81. doi:10.1016/j.gene.2013. 01.043PMID:23384715
36. Gu L, Xu T, Huang W, Xie M, Sun S, Hou S. Identification and profiling of microRNAs in the embryonic breast muscle of pekin duck. PLoS One. 2014; 9: e86150. doi:10.1371/journal.pone.0086150PMID: 24465928
37. Audic S, Claverie JM. The significance of digital gene expression profiles. Genome Res. 1997; 7:986–
995. PMID:9331369