www.atmos-chem-phys.net/13/6741/2013/ doi:10.5194/acp-13-6741-2013
© Author(s) 2013. CC Attribution 3.0 License.
Atmospheric
Chemistry
and Physics
Geoscientiic
Geoscientiic
Geoscientiic
Geoscientiic
Scorched Earth: how will changes in the strength of the vegetation
sink to ozone deposition affect human health and ecosystems?
L. D. Emberson1, N. Kitwiroon2, S. Beevers2, P. B ¨uker1, and S. Cinderby1
1Stockholm Environment Institute, Environment Dept., University of York, York, UK 2Kings college, London University, UK
Correspondence to:L. D. Emberson (l.emberson@york.ac.uk)
Received: 4 July 2012 – Published in Atmos. Chem. Phys. Discuss.: 23 October 2012 Revised: 21 May 2013 – Accepted: 24 May 2013 – Published: 18 July 2013
Abstract.This study investigates the effect of ozone (O3)
de-position on ground level O3concentrations and subsequent
human health and ecosystem risk under hot summer “heat wave” type meteorological events. Under such conditions, extended drought can effectively “turn off” the O3
vegeta-tion sink leading to a substantial increase in ground level O3
concentrations. Two models that have been used for human health (the CMAQ chemical transport model) and ecosystem (the DO3SE O3deposition model) risk assessment are
com-bined to provide a powerful policy tool capable of novel in-tegrated assessments of O3risk using methods endorsed by
the UNECE Convention on Long-Range Transboundary Air Pollution. This study investigates 2006, a particularly hot and dry year during which a heat wave occurred over the sum-mer across much of the UK and Europe. To understand the influence of variable O3 dry deposition three different
sim-ulations were investigated during June and July: (i) actual conditions in 2006, (ii) conditions that assume a perfect veg-etation sink for O3 deposition and (iii) conditions that
as-sume an extended drought period that reduces the vegetation sink to a minimum. The risks of O3 to human health,
as-sessed by estimating the number of days during which run-ning 8 h mean O3concentrations exceeded 100 µg m−3, show
that on average across the UK, there is a difference of 16 days exceedance of the threshold between the perfect sink and drought conditions. These average results hide local vari-ation with exceedances between these two scenarios reaching as high as 20 days in the East Midlands and eastern UK. Esti-mates of acute exposure effects show that O3removed from
the atmosphere through dry deposition during the June and July period would have been responsible for approximately 460 premature deaths. Conversely, reduced O3 dry
deposi-tion will decrease the amount of O3taken up by vegetation
and, according to flux-based assessments of vegetation dam-age, will lead to a reduction in the impact of O3on vegetation
across the UK. The new CMAQ-DO3SE model was
evalu-ated by comparing observation vs. modelled estimates of var-ious health related metrics with data from both urban and ru-ral sites across the UK; although these comparisons showed reasonable agreement there were some biases in the model predictions with attributable deaths at urban sites being over predicted by a small margin, the converse was true for rural sites. The study emphasises the importance of accurate esti-mates of O3deposition both for human health and ecosystem
risk assessments. Extended periods of drought and heat wave type conditions are likely to occur with more frequency in coming decades, therefore understanding the importance of these effects will be crucial to inform the development of ap-propriate national and international policy to mitigate against the worst consequences of this air pollutant.
1 Introduction
Strong connections exist between ozone (O3) dry
deposi-tion and atmospheric O3concentrations. Globally the
reduc-tion of atmospheric O3 concentrations through dry
deposi-tion processes is equivalent to ∼20 % of tropospheric O3
Fowler et al., 2001, 2009). During spring and summer pe-riods, when vegetation is physiologically most active, high stomatal conductance (gsto)will result in high dry
deposi-tion rates thereby increasing the O3loss from the lower
at-mosphere and decreasing atmospheric O3concentrations at
ground level (Colbeck and Harrison, 1985). Conversely, dur-ing periods of extended hot, dry weather conditions the veg-etation can become stressed by high temperatures and soil moisture deficits (SMDs). These conditions will see plants reducegsto in an effort to limit water loss with subsequent
reductions in dry deposition which can lead to maintained high atmospheric O3concentrations (Pio et al., 2000). This
effect has been investigated in a number of studies concerned with understanding the importance of O3 deposition on
at-mospheric O3concentrations. Vieno et al. (2010) found that
“turning-off” the dry deposition increased O3concentrations
by∼20 to 35 ppb on most days during the August heat wave period of 2003. The Royal Society (2008) also investigated the effects of altered dry deposition on O3concentrations
us-ing bespoke European model simulations; they found that “turning-off” surface deposition caused a 31 % increase in episodic peak O3concentrations and a 19 % increase in
an-nual mean daily maximum 1 h O3concentrations. These
re-sults were in broad agreement with the regional modelling of Solberg et al. (2008) which determined the key drivers of peak O3concentration during the height of the 2003
Eu-ropean heat wave by assessing the sensitivity of the mod-elled results to various parameter changes. Reducing the O3
deposition term to zero produced the largest effect with av-erage maximum hourly O3 concentrations of eight surface
measurement sites across Europe increasing from∼75 ppb to over 90 ppb.
The conditions that are likely to reduce dry deposition (i.e. extended periods of hot dry sunny weather) are the same con-ditions that are likely to result in the build-up of high O3
con-centrations. The association of poor air quality and extremely warm weather is well established (Lee et al., 2006; Filleul et al., 2006) and is due to a combination of meteorologi-cal effects, atmospheric chemimeteorologi-cal interactions and changes to both the rates and types of terrestrial emissions which occur at elevated temperatures. For example, in the case of UK O3concentrations, high summer time concentrations of
>90 ppb are almost always associated with anticyclonic con-ditions and temperatures in excess of 28–30◦C (Lee et al., 2006) when limited mixing and dilution along with synop-tic transport pathways often brings already highly polluted air from mainland Europe to the UK (Jenkin et al., 2002). Increases in biogenic volatile organic carbon (VOC) emis-sions are also likely to occur with higher temperatures (al-though the more extreme levels of temperature and drought stress may lead to decreases in biogenic VOC emissions) with such changes being non-linear and species dependant. For example, Lee et al. (2006) found that during the Euro-pean heat wave of 2003 daytime isoprene concentrations of greater than 1600 ppt were observed in South East England;
such concentrations are more typical of high emitting tropi-cal forested regions and were considered likely to, at least in part, have been due to increases in biogenic emissions.
Such conditions were experienced during the late summer heat wave of 2003 which affected much of Western Europe, especially Switzerland, France and southern England. In the UK the heat wave lasted for a 2 week period between 4 to 13 August, during which time temperatures peaked at a new record of 38.5◦C. Stedman (2004) investigated the associa-tion of this heat wave with excess deaths caused by air pollu-tion using established dose–response relapollu-tionships and found that between∼225 and 595 excess deaths were associated with elevated O3in the UK during the August 2003 episode
as compared with the same period in 2002 (with∼95 % of deaths occurring in England and Wales). These figures repre-sented∼10 to 30 % of the UK Office for National Statistics reported total excess deaths. The ranges given are based on estimates made assuming either a zero threshold or a thresh-old of 50 ppb for O3 effects on human health respectively,
based on COMEAP (1998). Across Europe, it was estimated that the 2003 heat wave was responsible for 22,000 prema-ture deaths (Sch¨ar and Jendritzky, 2004) leading to losses of an estimated £7bn. Of the deaths occurring in European cities, between ∼2.5 to 80.0 % could be attributed to O3
based on data analysis from a study of major French cities (Filleul et al., 2006). The occurrence of such heat wave con-ditions is likely to increase in the future with climate mod-els suggesting the probability of exceeding 35◦C in the UK will increase from 0.6 % under current conditions to 6 % by 2080 (Schar et al., 2004; Stott et al., 2004). The likelihood that such conditions will co-occur with high O3
concentra-tions will depend on how the UK and European air pollution emission reduction policy develops in coming years.
At the same time as increased atmospheric O3
concentra-tions may be causing impacts on human health, the reduction of O3deposition to vegetation may be viewed as protecting
ecosystems from O3damage (Fuhrer, 2009; Matyssek et al.,
2007). However, the assessment of vegetation risk will be ex-tremely dependent upon the metric used to estimate effects (Ashmore et al., 2004). In Europe, within the United Nations Economic Commission for Europe (UNECE) Convention on Long-Range Transboundary Air Pollution (LRTAP), use of the flux based metric to assess O3impacts on ecosystems is
now firmly accepted (LRTAP Convention, 2010). This met-ric is capable of taking into account the influence of envi-ronmental conditions on the sensitivity of the vegetation to O3and hence is suitable for risk assessment under conditions
representative of future, warmer and drier climates (Harmens et al., 2007).
The likely increases in the occurrence of future heat wave events across Europe will lead to a combination of condi-tions (increases in biogenic O3 precursor emissions;
condi-tions favouring O3formation and conditions likely to reduce
O3deposition) that are very likely to substantially increase
interactions of these factors requires the development and application of coupled models capable of predicting both O3 concentration as well as O3 deposition at fine
resolu-tion. In the study presented here this is achieved by combin-ing the Community Multiscale Air Quality (CMAQ) chem-ical transport model (CTM) with the Deposition of Ozone for Stomatal Exchange (DO3SE) O3 dry deposition model.
The CMAQ model can be applied using nested grids down to rather fine horizontal resolutions, desirable for human health assessments; in this study we use a 9 km resolution determined by the spatial resolution of the input land cover dataset. The CMAQ model has been found to provide reli-able estimates of O3concentrations in both rural and urban
settings across the UK (Carslaw, 2012; Chemel et al., 2010; Yu et al., 2008; Sokhi et al., 2006).
The DO3SE model is the only regionally parameterised O3
dry deposition model that has been developed specifically to estimate damage to vegetation (Emberson et al., 2001; Simp-son et al., 2007). The advantage of this scheme is that the surface resistance component, and particularly thegsto
algo-rithm, have been parameterised, evaluated and used to assess damage for a wide range of species grown across Europe (Emberson et al., 2001; Tuovinen et al., 2004; Simpson et al., 2003; Emberson et al., 2007; LRTAP Convention, 2008). Therefore, as well as providing an estimate of O3deposition
that is likely to better incorporate the influence of European vegetation on O3 mass balance, the DO3SE dry deposition
module can also be used to estimate effects on vegetation across the region.
Due to these advantages, the DO3SE deposition
mod-elling scheme was integrated into CMAQ, thus creating the “CMAQ-DO3SE” model. The resulting model is used in this
study to assess risk and impacts (i) to human health, based on UK air quality objectives and methods to estimate prema-ture mortality due to acute exposure to O3(e.g. COMEAP,
1998); and (ii) to ecosystems following methods proposed by the LRTAP Convention (LRTAP Convention, 2008). The study focuses on the heat wave of 2006 which was preceded by a hot dry summer causing extensive drought coupled with high O3concentrations across the UK and Europe (Doherty
et al., 2009). This study provides a first quantification of the importance of the vegetation sink in determining O3dry
de-position, atmospheric O3concentrations, and associated
im-pacts on human health and ecosystems.
2 Methods
2.1 Modelling O3photochemistry and dry deposition
The UK O3 concentration fields used in this study were
generated using the USEPA Models-3/CMAQ model, with the central CMAQ model being a third-generation CTM (Byun and Ching, 1999; available online at http://www. cmaq-model.org). The other two components are a
meteoro-logical model (the Weather Research and Forecasting model, WRF), and an emissions processor, typically used by CMAQ users called the Sparse Matrix Operator Kernel Emissions (SMOKE) model. These three components are coupled by an interface called the Meteorology-Chemistry Interface Pro-cessor (MCIP) model. CMAQ version 4.6 was used within this study.
CMAQ ordinarily uses one of two different O3dry
depo-sition schemes within the MCIP: the surface exchange aero-dynamic method (Pleim et al., 2001) or the RADM dry de-position algorithm (Wesely, 1989); both use an electrical re-sistance approach to estimate dry deposition. Since such an approach is common to most O3deposition modelling
meth-ods, including the DO3SE model, it was relatively
straight-forward to substitute the DO3SE deposition model, described
in Emberson et al. (2000, 2001) and Simpson et al. (2012), into CMAQ’s MCIP.
A particularly unique feature of the DO3SE model is the
method for estimating surface resistance (Rsur)described in
Eq. (1).
Rsur=
1
LAI
rsto +
SAI
rext +
1
Rinc+Rgs
, (1)
whereRsuris calculated as a function of stomatal and
non-stomatal canopy resistances, the latter including external plant surface (rext), within-canopy (Rinc) and ground
sur-face/soil (Rgs)resistances for which empirical methods and
constants are employed based on published literature as de-scribed in Simpson et al. (2003). Stomatal (rsto)and external
(rext)resistances to O3deposition are defined at a leaf/needle
level (denoted by a lower caser)and scaled according to leaf and surface area indices (LAI and SAI, respectively) to pro-vide canopy scale estimates (denoted by an upper caseR).
To estimategsto(the inverse ofrsto)which represents the
stomatal control of O3 uptake to the sites of O3 damage
within the leaves/needles of plants, the DO3SE model
em-ploys a multiplicative algorithm, based on that first developed by Jarvis (1976) and modified for O3stomatal flux estimates
(Emberson et al., 2000, 2007) according to Eq. (2).
gsto=gmax·[min(fphen, fO3)]·flight (2)
·max{fmin(fT·fD·fSWP)},
where the species-specific maximumgsto(gmax)is modified
within a limit set by a minimum daytimegstovalue (fmin)and
by functions (scaled from 0 to 1) to account forgsto variation
with leaf/needle age (fphen) or O3induced early senescence
(fO3) over the course of the growing season and the functions
flight, fT,fD and fSW relating gsto to irradiance (PPFD),
temperature (T), vapour pressure deficit (D), and soil water status (SW). The influence of SW ongsto(fSW)is modelled
energy as well as atmospheric D. For this study the SWP (soil water potential) model was used with root depth varying between 0.1 and 1 m as appropriate for different land cover types. The model has been extensively evaluated for condi-tions across Europe and is shown to perform well against observed data (B¨uker et al., 2012). Further details of these methods are given in the Supplement.
The DO3SE model is parameterised for both broad land
cover types (Simpson et al., 2003) and individual forest, crop and grassland species (LRTAP Convention, 2008) such that European parameterisation currently exists for 10 land cover types, 7 forest tree species, 5 crop species and 2 grassland species. Some of the forest species have climate-specific pa-rameterisations that account for the different species eco-types (LRTAP Convention, 2008). When DO3SE is used in
combination with regional photochemical models, the broad land cover parameterisations are used to determine O3
depo-sition whilst the species-specific parameterisations are used to assess O3risk and vegetation damage. The
parameterisa-tions of the cover types and species used in this UK based study are given in Table S1. Six broad land cover types: coniferous, deciduous and mixed forests; croplands; produc-tive grasslands and heathlands were used for total deposition estimates since these were considered to represent dominate land cover types in the UK landscape; the ecosystem risk as-sessment investigated three species: beech, wheat and pro-ductive grasslands.
2.2 Land cover data
Land cover data for the UK were obtained from the UN-ECE LRTAP Convention harmonised land cover map (Cin-derby et al., 2007). These data were compiled specifically for use in assessing the impacts of air pollutants on Euro-pean ecosystems and agriculture from a mixture of existing digital and paper sources including the European Environ-ment Agency (EEA) Corine Land Cover 2000, the SEI Land European Cover Map (2002 Revision), the FAO Soil Map of the World and the EEA European Biogeographical re-gions (2005). These land cover data were aggregated from 1 km×1 km resolution to the 9 km×9 km UK grid used by CMAQ.
2.3 Meteorological and emissions data
The meteorological driver for CMAQ-DO3SE is the WRF
model (Skamarock et al., 2008). The lateral conditions for WRF are provided by the National Centres for Environ-mental Prediction (NCEP) FNL (Final) Global Tropospheric Analyses at 1◦grid spacing and 6 h temporal resolution (http: //rda.ucar.edu/datasets/ds083.2/). The initial and boundary conditions for CMAQ were derived from the UK Meteo-rological Office CTM (STOCHEM). Annual anthropogenic emissions (CO, NOx, NH3, SO2, NMVOC and PM10)data
for 2006 were obtained from a number of sources
includ-ing the European Monitorinclud-ing and Evaluation Programme (EMEP; http://www.ceip.at) at a grid resolution of 50 km and the UK National Atmospheric Emissions Inventory (NAEI; http://naei.defra.gov.uk) at a grid resolution of 1 km. The emissions from point sources were derived from the Euro-pean Pollutant Release and Transfer Register (E-PRTR) and the NAEI databases. The emissions from EMEP were used in CMAQ-DO3SE domain 1 (EU 81 km grid) and 2 (EU/UK
27 km) and domain 3 (UK 9 km grid) used the emissions from NAEI.
The annual primary emissions were disaggregated into model chemical species using source specific model species speciation profiles. The profiles for NMVOC were estimated by mapping the UK VOCs emissions (Passant, 2002) with the model chemical species in the USEPA emissions speciation database (http://www.epa.gov/ttn/chief/software/speciate).
These species were then disaggregated into hourly emis-sions using temporal profiles for 11 CORINAIR/UNECE emission source categories from the City-Delta project (http: //aqm.jrc.ec.europa.eu/citydelta/). The biogenic emissions, isoprene and terpene, were estimated using 100 m grid res-olution CORINE land cover data, incoming shortwave radi-ation and surface temperature, using methods described by Guenther et al. (1995) and Sanderson et al. (2003).
2.4 Estimating O3effects on human health
The human health risk from O3 pollution was
as-sessed according to (i) exceedances of the UKs national air quality objective (http://uk-air.defra.gov.uk/air-pollution/ uk-eu-limits). This states that the 8 h mean O3concentration
should not exceed 100 µg m−3(DM100)on any more than 10
days per year; and (ii) estimates of the attributable mortali-ties (or deaths brought forward) due to short-term exposure to O3. This was estimated using a concentration-response
func-tion derived from the WHO (2004) meta-analysis of time-series studies of 15 cities in France, Italy, the Netherlands, Spain and the UK. The time-series study reported a risk es-timate of 0.3 % increase in daily all natural cause mortality (95 % confidence interval (CI) 0.1 to 0.4 %) per 10 µg m−3 daily maximum 8 h O3 concentration. This figure is
with-out a threshold and can be translated into the relative risk (RR) of 1.003 (95 % CI 1.001 to 1.004). The concentration response coefficient (β)is a slope of the log-linear relation-ship between RR and concentrations (RR=expβ1X)and is estimated as ln(RR) /10.
To calculate the acute premature deaths, the fraction of the disease burden attributable to the risk factor (AF) when the daily maximum 8 h mean was greater than a threshold (a level below which O3has no effect on mortality) was calculated as
shown in Eq. (3).
AF=1−expβ1X, (3)
where1X is the change in daily maximum 8 h O3
The attributable deaths for the days that concentrations were above the threshold were then estimated using the fol-lowing expression (Eq. 4):
1Mort=AF·yo·Pop/365, (4)
whereyo is the baseline mortality rate (i.e. annual natural
cause mortalities per million population), Pop is the annual size of the exposed population. Due to the lack of daily popu-lation and mortality rate, these annual values were divided by 365. The annual attributable deaths were then estimated as an accumulation of1Mort for the entire year. The attributable deaths during the June to July period were also calculated to quantify the contribution of the peak O3 heat wave period.
The uncertainty in these estimates associated with the dose– response relationship is given in Table 2 that shows estimated values within the 95 % confidence interval of the relation-ship. However, it is acknowledged that there will be other uncertainties that are not quantified such as those associated with O3precursor emissions, meteorology, atmospheric O3
modelling and population estimates, all of which will add to the uncertainty of modelled values.
The 2006 baseline natural cause mortality rate, derived from ONS (2008), was 11 581 per million population. Popu-lation data at a spatial resolution of 100 m was taken from the European Environment Agency web site (EEA, http:// dataservice.eea.europa.eu/) and based upon the Eurostat cen-sus 2001. As a consequence we have assumed no significant changes in UK population between 2001 and 2006. These population data were aggregated to the 9 km×9 km CMAQ grid.
It is recognised that the confidence in the existence of as-sociations between O3 exposures and the health outcomes
decrease as concentrations decrease (IGBP, 2007). The es-timates of effects were made at concentrations greater than 35 ppb daily maximum 8 h mean based on recommendations by WHO (2004) and UNECE (2004). However, using this cut-off is recognised to underestimate the O3effects;
there-fore, estimates were also made without a threshold to indicate an upper estimate of the attributable effects of O3on
mortal-ity, although it is recognised that such high mortalities would be extremely unlikely. Further discussion of the uncertainties related to the use of this index, with and without threshold, is provided in Sect. 4.
2.5 Estimating O3effects on ecosystems
The flux-based method recommended by the UNECE LR-TAP Convention is used in this study to assess O3 risk to
ecosystems during 2006 (LRTAP Convention, 2008). This method requires an estimate of the flux metric PODy
(Phyto-toxic Ozone Dose over a thresholdy) for the three different representative species: beech, wheat and grasslands. The re-spective critical levels for the PODy metric (CL) represent
levels below which damage would not be expected to occur
and are provided in Table 1 and based on data described in LRTAP Convention (2008).
The calculation of PODyrequires estimates of stomatal O3
flux (Fst)which is performed according to the methods
pro-vided by LRTAP Convention (2008).Fst(nmol O3m−2
pro-jected leaf area (PLA) s−1)is calculated according to Eq. (5) which accounts for deposition to the cuticle through incorpo-ration of the leaf surface resistance (rc)and boundary layer
resistance (rb)terms:
Fst=c (z1)·gsto·
rc
rb+rc
, (5)
where c(z1) is the concentration of O3 at the top of the
canopy (nmol m−3) at height z
1 (m), gsto is in m s−1, rb
is the leaf quasi-laminar resistance andrc the leaf surface
resistance, both given in s m−1. For further details on the re-sistance scheme see LRTAP Convention (2008). The accu-mulatedFstabove an O3stomatal flux threshold ofy, given
in nmol m−2s−1provides the PODyindex and is calculated
according to Eq. (6). PODy=Xn
i=1
Fsti−y
forFsti≥ynmol m
−2PLA s−1 (6)
In Eq. (6),Fsti is the hourly mean O3flux in nmol O3m
−2
PLA s−1, andnis the number of hours within the accumula-tion period. The values for the thresholdyvary by species as described in Table 1.
The Fst accumulation period aims to define that part of
the growth period when the species is most sensitive to O3
and varies for different species. For all species except wheat this is assumed to be equivalent to the period between the start (SGS) and end (EGS) of the growing season, given in the Supplement. For wheat, the accumulation period is con-sidered to be shorter than the entire growth period since ev-idence shows that the period around wheat grain filling is more sensitive to O3 (Younglove et al., 1994; Soja et al.,
2000). Full methods are again provided in the Supplement. 2.6 CMAQ-DO3SE model simulations
The CMAQ-DO3SE model was applied to simulate O3
con-centrations and deposition across the UK for the year 2006; this year was chosen as during the last couple of weeks of July much of the UK experienced a heat wave that resulted in extreme weather conditions and high O3 concentrations
that came at the end of an extended period of drought. The CMAQ-DO3SE model was run for three
alterna-tive model scenarios for the whole of 2006; a “reference” scenario for which O3 deposition was modelled using the
DO3SE model method described above; and two scenarios
based upon forced alterations to the dry deposition model during the months of June and July 2006. These were achieved by altering Eq. (2); the first of the two scenar-ios assumed a minimum limitation to gsto calculated by
gmax·fphen·flight(referred to as the “no stress” scenario; for
Table 1.PODybased critical levels (CL) for O3risk on wheat, beech and grasslands (LRTAP Convention, 2008).
Vegetation Canopy PODy Time period for Critical level Effect Note
height (m) value index accumulation (CL) (mmol O3m−2)
Wheat 1 POD6 55 days 1 Grain yield (5 %) Based on wheat
Beech 20 POD1.6 Latitude defined growth period 4 Biomass reduction (5 %) Based on birch and beech
Grassland 1 POD1.6 Year round – – –
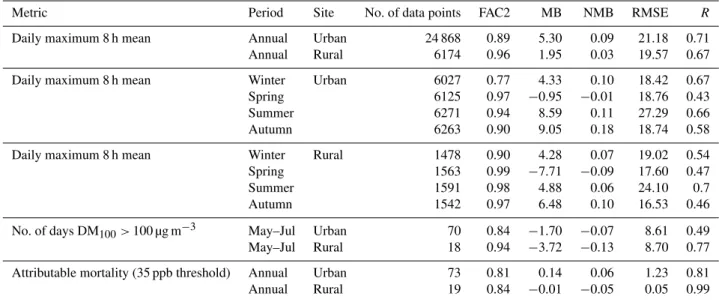
Table 2.Statistical measures of model performance in predicting O3metrics associated with human health at 19 rural and 73 urban sites in
the UK for 2006. The reliability of the different metrics are compared for different periods (annual, winter, spring, summer and autumn) and by location (urban and rural).
Metric Period Site No. of data points FAC2 MB NMB RMSE R
Daily maximum 8 h mean Annual Urban 24 868 0.89 5.30 0.09 21.18 0.71
Annual Rural 6174 0.96 1.95 0.03 19.57 0.67
Daily maximum 8 h mean Winter Urban 6027 0.77 4.33 0.10 18.42 0.67
Spring 6125 0.97 −0.95 −0.01 18.76 0.43
Summer 6271 0.94 8.59 0.11 27.29 0.66
Autumn 6263 0.90 9.05 0.18 18.74 0.58
Daily maximum 8 h mean Winter Rural 1478 0.90 4.28 0.07 19.02 0.54
Spring 1563 0.99 −7.71 −0.09 17.60 0.47
Summer 1591 0.98 4.88 0.06 24.10 0.7
Autumn 1542 0.97 6.48 0.10 16.53 0.46
No. of days DM100>100 µg m−3 May–Jul Urban 70 0.84 −1.70 −0.07 8.61 0.49
May–Jul Rural 18 0.94 −3.72 −0.13 8.70 0.77
Attributable mortality (35 ppb threshold) Annual Urban 73 0.81 0.14 0.06 1.23 0.81
Annual Rural 19 0.84 −0.01 −0.05 0.05 0.99
assumed to be that for clear sky to avoid limitations togsto
from overcast conditions. Since the stomatal response to light saturates at rather low light levels (∼25 % of clear sky con-ditions), overcast conditions would not be expected to cause much limitation togsto). The second scenario assumed full
limitation togstocalculated bygmax·fmin(referred to as the
“stress” scenario).
3 Results
3.1 Performance of the CMAQ-DO3SE model
3.1.1 O3concentrations and metrics
The predictive performance of the CMAQ-DO3SE model
was assessed by comparing the modelled and measured val-ues of a number of O3 metrics associated with assessing
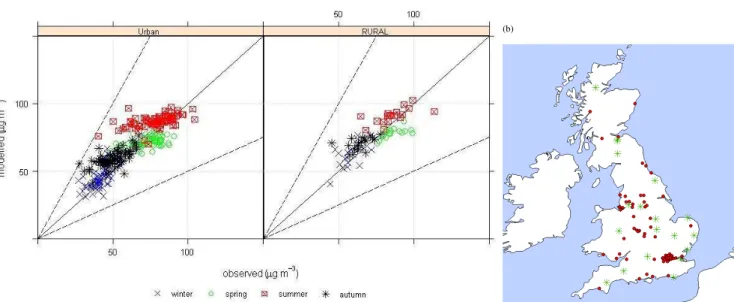
risk to human health. This was done using both scatter plots (Fig. 1) and statistical measures described in Chang and Hanna (2004) and Builtjes (2005), including factor of 2 of the observations (FAC2), mean bias (MB), normalised mean bias (NMB), root mean square error (RMSE) and correlation coefficient (R) (Table 2). Comparisons of these metrics were made both between rural and urban locations as well as
dif-ferent time periods (annual as well as winter, spring, summer and autumn). These metrics include daily 8 h mean O3
con-centrations, number of days of exceedance of the DM100and
the attributable premature mortality that would be associated with the prevailing O3concentrations. Measured values were
derived from hourly O3concentrations collected from 73
ur-ban sites and 19 rural sites across the UK during 2006; these data were collected from sites that the UK Department of environment, food and rural affairs (Defra) consider suitable for evaluation of UK CTMs (Derwent et al., 2010). Figure 1 shows both the location of these sites as well as a modelled vs. observed comparison of the daily 8 h mean O3
concen-trations by season for urban and rural locations. Table 2 and Fig. 1 show that the CMAQ-DO3SE model is able to describe
these human health risk metrics reasonably well. Overall, the FAC2 values indicate>75 % of modelled data are in within a factor of 2 of the measurements. Although the model has ten-dency to over predict the DM100by approximately 5 µg m−3
at urban sites and 2 µg m−3 at rural sites, the NMB values
show both annual and seasonal model data are well within the±0.2 range considered acceptable (Derwent et al., 2010). Despite positive biases of the DM100, the model slightly
un-der predicts the number of days that DM100is exceeded, i.e.
(a)
(b)
Fig. 1. (a)Scatter plot of observed vs. modelled daily maximum 8 h mean O3concentration by season (winter, spring, summer and autumn) for 2006 and(b)the UK location of the 73 urban sites (comprising 19 urban centres, 13 suburban and 41 urban background; red dots) and 19 rural sites (green stars) from which the observed data were collected.
rural sites respectively for the period May to July. The at-tributable deaths at urban sites are over predicted by a small margin due to the tendency of over predicting DM100. The
at-tributable deaths at rural sites are marginally under predicted which is likely to be driven by the negative bias of the DM100
in spring.
3.1.2 Soil moisture status
Central to this study is the CMAQ-DO3SE model’s ability
to predict SMD and subsequent influence on stomatal O3
flux and deposition. To assess the former the SMD results of CMAQ-DO3SE are compared with equivalent estimates
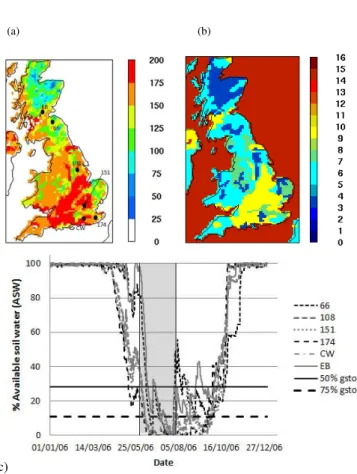
made by the Met Office Rainfall and Evaporation calculation system (MORECS) model described in the National Hydro-logical Monitoring programmes review for 2006. This re-view provides estimates of SMDs for the end of July for a grassland cover type over the UK (Marsh et al., 2008). These data showed widespread drought conditions, partic-ularly across almost all of England and the south and east of Scotland (Northern Ireland not shown). Based on an aver-age available water content (AWC) assumed in the MORECS model (Hough and Jones, 1997) these drought areas had less than 25 % of (AWC) remaining. By comparison, the CMAQ-DO3SE model estimates a similar pattern of drought across
England by the end of July 2006 (shown in Fig. 2) with soils having less than 30 % of AWC remaining. In Scotland CMAQ-DO3SE estimates the drier areas to the west of the
country rather than the east which seems most likely driven by soil texture (see also Fig. 2). However, the area of
dis-crepancy is relatively small and on the whole the CMAQ-DO3SE model simulates the same spatial distribution and
relative magnitude of reduced plant water availability. Im-portantly, the CMAQ-DO3SE model captured the high July
SMDs. These were attributed to the very limited rainfall be-tween November 2005 to February 2006 which allowed sig-nificant SMD to be carried through the winter in parts of eastern, central and southern England, this was followed by sharp increases in SMD in April 2006, which were unable to recover in spite of a wet May and which were followed by a steep and more sustained rise in SMD during June (Marsh et al., 2008). Figure 2c shows the seasonal profile of % ASW for a number of grids across the modelling domain. Also shown are the thresholds at which % ASW will cause a 50 % and 75 % reduction in gsto. This figure clearly shows that
modelled soil water stress is high for rather extended periods around June and July suggesting the estimated reductions in O3deposition are rather insensitive to model uncertainty in
the soil water status calculation.
3.2 O3effects on human health
Table 3 provides estimates of the exceedance of DM100 for
Table 3.UK exceedance of number of days when 8 h mean O3concentration>100 µg m−3and attributable mortalities due to short-term O3
exposure using two different thresholds (0 and 35 ppb), presented for both the entire annual period and the June to July period in 2006 for all three scenarios. The 95 % confidence intervals for estimates of attributable death brought forwards are shown in brackets.
Scenario Reference No stress Stress
Number of days when 8 h mean O3concentration>100 µg m−3
Annual 25 13 29
June to July 20 8 24
Deaths brought forward due to short-term exposure to O3
Annual (no threshold) 16140 (5425–21 420) 15725 (5285–20 880) 16230 (5460–21 545)
Annual (35 ppb threshold) 1880 (630–2500) 1510 (505–2010) 1965 (660–2615)
June to July (no threshold) 3480 (1175–4620) 3070 (1030–4070) 3575 (1205–4740)
June to July (35 ppb threshold) 880 (295–1170) 510 (170–680) 970 (325–1285)
(a) (b)
(c)
Fig. 2. (a)Soil moisture deficits (SMD, mm) estimated for the
end of July for a grassland cover-type using the CMAQ-DO3SE
model;(b)the corresponding dominant soil type at the 9 km×9 km grid resolution used within the modelling and(c)seasonal profiles
of CMAQ-DO3SE modelled %ASW for grasslands from 6 sites
(shown as black dots ona) in relation to the threshold for 50 % (solid line) and 75 % (dashed line) of reduction ingsto. The shaded
area highlights the June to July period. N.B. The major soil types in UK include clay loam (9), loam (6) and sandy loam (3).
concentration > 100 μg m for (i) “reference”; (ii) “no stress” and (iii) “stress” scenarios.
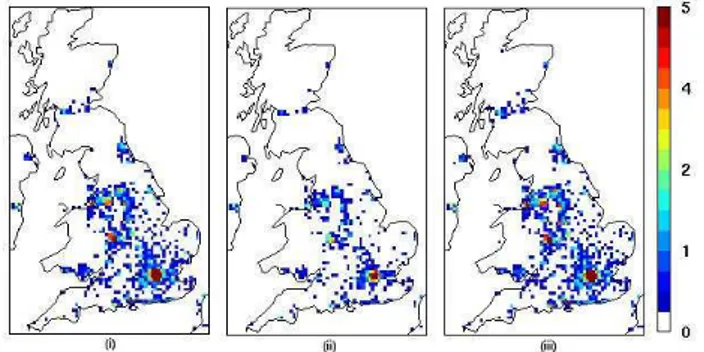
Fig. 3.Number of days when daily maximum 8 h average O3
con-centration>100 µg m−3during the June to July period in 2006 for (i) “reference”, (ii) “no stress” and (iii) “stress” scenarios.
The exceedance of this air quality objective varies across the UK as seen in Fig. 3 which describes the DM100during
the June and July period across the UK for all three scenar-ios. This variation is driven by the north/south gradient of O3 concentrations with higher concentrations in the south
resulting from stronger photochemistry, higher UK temper-atures and increased long-range transport of O3 from
out-side the UK in southern England (Lee et al., 2006). Differ-ences in annual mean 24 h O3 concentrations between the
“no stress” and “stress” scenario were on average 2.5 ppb across the whole of the UK. However, for the June–July pe-riod these differences increased to 8 ppb (data not shown). These variations in O3concentration translate into
geograph-ically variable human health risk. The “reference” results in Fig. 3 show the existence of a north-to-south DM100
gradi-ent, with south east England having the highest number of days (between 30 and 35), exceeding 100 µg m−3. These re-sults are mirrored by those for the full annual period (data not shown). By contrast the “no stress” scenario is very different, with the southern part of England tending to have only 12 days on average during which the DM100is exceeded; for this
Fig. 4.Number of deaths brought forward due to short-term expo-sure to O3with a threshold values of 35 ppb for June–July period for (i) “reference”, (ii) “no stress” and (iii) “stress” scenarios.
less important in relation to the total number of days of ex-ceedance for the entire year (Table 3) which is likely due to less extreme conditions during this high summer period.
Table 3 shows the estimates of deaths brought forward due to acute O3 exposure both with and without a threshold of
35 ppb for the “reference”, “no stress”, and “stress” scenarios (the merits of including estimates made without a threshold are discussed in Sect. 4). The upper level of premature annual mortalities for the “reference” case, assuming no threshold, is just above 16 000 (5425–21 420) in which approximately 20 % of excess deaths are attributed to the June–July period. In contrast, the estimate of premature annual mortalities with a 35 ppb threshold is much smaller at approximately 1900 (630–2500) with almost 50 % associated with the June–July period. The estimates with the threshold show greater differ-ences between the annual and June–July periods due to the fact that outside of this high summer period, concentrations are more likely to drop below the threshold.
The influence of altered O3 deposition on mortality can
be inferred from the results presented in Table 3 by com-paring the number of attributable deaths between scenarios. The number of UK mortalities in 2006 estimated for the “ref-erence” scenario assuming no threshold increases under the “stress” scenario by∼90 (35–125) premature deaths and is reduced under the “no stress” scenario with∼415 (140–540) premature deaths avoided. Similar results are found using the 35 ppb threshold with the number of premature deaths in 2006 being reduced by∼370 (125–490) under the “no stress” condition and with∼90 (30–115) additional prema-ture deaths estimated under the “stress” scenario. The uncer-tainties associated with the dose–response relationship sug-gest that the estimates are tending towards the higher end of the range in premature deaths.
Figure 4 shows the June–July premature mortalities due to O3exposure under the “reference”, “no stress”, and “stress”
scenario using the 35 ppb cut-off. The numbers of deaths brought forward are higher in and around urban areas asso-ciated with large human populations in polluted areas. This spatial distribution pattern is similar to that found for the
an-Fig. 5.The PODyin mmol m−2for beech, wheat and grasslands
(with associated critical levels of 4 and 1 mmol m−2 (currently there is no flux critical level established for grasslands) under the “reference” scenario for 2006.
nual assessment and that estimated without a threshold hence these data are not shown here. The main differences between perfect sink and drought conditions occur over populated ar-eas with the “no stress” scenario reducing premature mortali-ties in and around these urban centres by approximately 40 % during the June–July period.
3.3 O3effects on ecosystems
The O3effects on ecosystems have been assessed using the
flux based PODymetric. Under the “reference” scenario
de-scribed in Fig. 5 the modelling suggests that beech is at risk from O3 as POD1.6 values exceed the critical level across
most of the country, with more than double the exceedance across approximately half the geographical area. For wheat, the POD6index is not exceeded under the “reference”
situa-tion (data not shown); a POD0value is shown in Fig. 5 to give
an indication of the geographical variation in O3flux though
the index suggests such low fluxes would not be damaging. For grasslands, there is currently no flux based critical level for the LRTAP Convention (2008) parameterisation used in this study although recently established flux based critical levels of 1 mmol O3m−2(LRTAP Convention, 2010) would
suggest likelihood of a threat from O3across all of the UK.
The results in Table 2 suggested a slight overestimate of mod-elled daily 8 h mean O3concentrations in rural areas during
the summer with a MB value of 4.88 µm−3which suggests these POD values might be overestimated, especially since the accumulated nature of this index will enhance any model bias.
Under the different scenarios the values recorded for each of these vegetation indices changes quite substantially. The magnitude of risk between the “reference” and “scenario” runs associated with the flux metric can be most easily com-pared by showing relative exceedances for each, i.e. scaling exceedance by the respective critical level for each index as suggested in Simpson et al. (2007). Figure 6 shows these rel-ative exceedances (RCLe) for beech; a RCLe >1 denotes an exceedance of the PODycritical levels. The PODyRCLe
6750“stress” scenario for 2006. L. D. Emberson et al.: Scorched Earth
Fig. 6.The relative critical level exceedance (RCLe) using PODy
metrics for beech under the (i) “reference”, (ii) “no stress” and (iii) “stress” scenario for 2006.
between 5 and 8 times the CL across the UK, with the highest values in the south of England. By comparison, the “refer-ence” scenario shows very low exceedances, predominantly between 0 and 3 extending to 4 times the CL in southern Eng-land; under the “stress” scenario the CL is not exceeded (i.e. values are less than 1) for the whole of the UK.
The variation in O3 flux to vegetation (in part described
by PODy) is related to total O3deposition and hence O3loss
from the atmosphere; higher fluxes will equate to higher O3
deposition rates and reductions in atmospheric O3
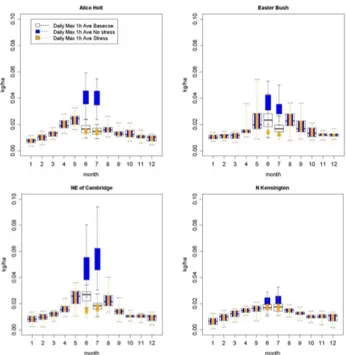
concen-tration. Deposition rates vary with land cover; the influence of vegetation type on deposition during the growing season can be seen in Fig. 7 which investigates the influence of the three scenarios on the monthly trends of daily maximum 1 h O3deposition for four different sites dominated by
particu-lar land cover types common in the UK: Easter Bush (grass-lands), NE Cambridge (wheat), Alice Holt (forest) and Lon-don North Kensington (urban). The results are presented as monthly mean box and whisker plots showing the maximum and minimum O3deposition rate as well as the inter-quartile
range.
At all locations for the “no stress” scenario O3deposition
increases from a minimum in winter (∼0.01 kgO3ha−1 for
all land cover types) to a maximum during the summer; the influence of land cover is apparent for these maximum depo-sition rates with the urban locations showing the least O3
de-position (∼0.025 kgO3ha−1) compared with the agricultural
land cover type of NE Cambridge which sees deposition of up to 0.06 kgO3ha−1. The effect of reduced sink strength is
apparent during June and July where there is a notable dif-ference in the O3 deposition for both the “reference” and
“stress” scenarios for the three vegetated land cover types. Forests show a reduced O3 deposition already by June for
the “reference” scenario which may be due to a more rapid drying of the soil for this vegetation type. By July, the period of hot dry sunny weather has continued for long enough that all land cover types have dried out the soil so that the “refer-ence” and “stress” scenarios record the same level of reduced O3deposition. As such, the land cover type and the degree
of stress to which the land cover is exposed will both
influ-Fig. 7.Monthly variation of daily maximum 1 h average of O3
de-position (kg ha−1) at Alice Holt, Easter Bush, NE of Cambridge, and North Kensington for all three scenarios.
ence the O3deposition and hence remaining atmospheric O3
concentration.
4 Discussion
The results presented in this paper have quantified the likely influence of extreme meteorological events on O3 dry
de-position, subsequent O3concentration and ultimately human
health and ecosystem effects. This study focussed on a heat wave period that occurred across the UK and much of Europe during June–July of 2006. The study clearly demonstrated the substantial influence that a drought limited vegetation sink had on atmospheric O3concentrations, increasing 24 h
mean values by approximately 8 ppb as an average over the entire UK over the June–July period. Under such conditions, the human health risk, quantified by the DM100 index, was
increased by almost two thirds (see Table 3). The increased ground level O3concentrations resulted in∼460 additional
premature deaths for the June to July period assuming a dam-age threshold under the “stress” drought scenario compared to the “no stress” perfect O3sink scenario, with the largest
differences in the estimated premature deaths of the differ-ent scenarios reaching 40 % in and around the urban cen-tres. In contrast to the risk to human health, the occurrence of drought reduces stomatal O3flux to vegetation as plants
close stomata in an attempt to conserve water. The result-ing reduction in O3dose means that under the dry “stress”
O3damage with RCLe being halved across much of the UK
when compared with the “no stress” conditions.
There are of course uncertainties associated with these cal-culations. In relation to the dose–response relationships used to assess premature mortalities under heat wave events there are two main issues: firstly, the question of whether a thresh-old for O3effects on human health exists; and secondly, what
is the likely confounding influence of other co-occurring en-vironmental (and socio-economic) factors on the health im-pact results.
Due to uncertainties in the shape of the dose–response function at very low O3 concentrations, a threshold for the
effects of O3 on mortality is likely to exist. Although there
is insufficient evidence for identifying such a threshold, a range of values have been assumed in previous studies such as 50 ppb (COMEAP, 1998 and Stedman et al., 1997) and 35 ppb (WHO, 2004 and UNECE, 2004). The 35 ppb cut-off was recommended by UNECE (2004) and was used in this study as it is more relevant to the European seasonal variation and geographical distribution of background O3
concentra-tions and importantly, the range of concentraconcentra-tions for which most CTMs provide reliable data. It is recognised that the hu-man health effects estimated using this threshold are likely to underestimate the real effects of O3; as such, estimates
without a threshold were also made to indicate the upper es-timate of the attributable effects of O3 on mortality though
this is considered extremely unlikely to occur. The choice of threshold makes a substantial difference to absolute estimates of premature deaths. Over the entire year, assuming a zero threshold gave estimates of∼16 140 premature deaths due to O3compared with the 35 ppb threshold value of∼1880.
These estimates can be compared with a study conducted for the entire EU which estimated∼22 000 premature mortal-ities for the year 2000 assuming a 35 ppb threshold (EEA, 2007) suggesting the zero threshold estimates are extremely exaggerated. However, the difference in estimates of prema-ture deaths between the “no stress” and “stress” scenarios was similar irrespective of the use of a zero or 35 ppb thresh-old with values of ∼505 and 460, respectively. Therefore, the importance of the O3 deposition term on the magnitude
of the human health risk, at least in absolute terms, is largely independent of the threshold value chosen.
In terms of confounding effects it is widely recognised that due to the processes governing O3formation, it is likely that
high O3concentrations will often co-occur with high
tem-peratures. The singular effects of O3 (e.g. Stedman, 2004)
and temperature stress (e.g. Johnson et al., 2005) on hu-man health have been investigated frequently with results clearly showing that both stresses can cause substantial im-pacts when acting individually. However, there have only been a small number of studies investigating both stresses acting together. Those studies that have been conducted have shown the importance of geographical variation (perhaps due to the frequency of air conditioning use, personal activity and pollution exposure levels, and environmental conditions) as
determinants of the O3-heat mortality effects (Filleul et al.,
2006; Ren et al., 2008). Doherty et al. (2009) performed sim-ulations for three years (2003, 2005 and 2006) for 15 UK conurbations and found that overall the number of deaths as-sociated with O3 appeared to be slightly higher than those
attributable to heat and that proportionately more O3deaths
occurred during periods of very high temperature. The work presented here suggests that similar studies to that by Do-herty et al. (2009), which also specifically address issues re-lated to variable O3deposition under climate change, should
be performed in the future complimenting efforts that have tended to focus only on improving our understanding of how O3transport and formation vary under climate change (Royal
Society, 2008).
In terms of O3 impacts on vegetation our results suggest
a reduced risk under the extreme meteorological events. The findings presented here for the “reference” scenario provide the first national level PODyassessments that have
incorpo-rated the influence of drought (soil water stress) on stom-atal O3 flux; these follow the methods described in B¨uker
et al. (2012) and are consistent with methods recommended by the LRTAP Convention (2008). Previously, regional mod-elling of O3effects on vegetation has assumed non-limiting
soil water and hence could only provide a “worst case” as-sessment of O3 risk to vegetation (Simpson et al., 2007).
The results of Simpson et al. (2007) showed a range of 4 to 12 mmol O3m−2for POD1.6values for forests across the
UK with a north–south gradient from low to high values. The “no stress” scenario of this study mimics this geographical pattern though the magnitude of O3flux is higher (with
val-ues frequently reaching the 25 mmol O3m−2across parts of
southern England) as would be expected given the higher O3
levels of this 2006 study year and the near unlimited stomatal conductance to O3of the scenario run.
In contrast, the “reference” case has a similar range of POD1.6values (4 to 12 mmol O3m−2)across the UK but the
spatial gradient is the opposite with highest values occurring across Scotland and lowest values in southern England. This pattern is driven by soil moisture and highlights the impor-tance of incorporating the influence of soil moisture in esti-mates of both stomatal O3flux for ecosystem risk assessment
but also for accurate estimates of O3deposition.
However, it should be noted that enhanced SMD will not only affect stomatal O3fluxes; increased SMD will also
make any attempt to quantify changes in yield or biomass loss that might result from altered O3flux due to changes in
stomatal O3deposition; our study can only indicate changes
in O3risk.
Although this is the first time that the influence of dry de-position has been related to health effects for ground level O3, this is not the case for other pollutants. A number of
studies have investigated the relationship between particu-late matter deposition to vegetated surfaces and human health (Tiwary et al., 2009). Recognition of the important role that vegetation (especially trees in urban centres) plays in im-proving urban air quality has even led to the development of planning policies to help control exposure of citizens to this toxic pollutant (McDonald et al., 2007).
To truly understand the implications of changes in O3
de-position for human health and ecosystem risk assessment the tools employed in the assessment must be “fit for purpose”. CMAQ has been used in a number of previous modelling studies across the UK and has shown good agreement with observations in both urban and rural areas (Carslaw, 2012; Chemel et al., 2010; Yu et al., 2008; Sokhi et al., 2006). In this study, good agreement between model results and mea-surements over rural locations is observed. Although there is a tendency for CMAQ to overestimate O3concentrations (as
is the case for many O3CTMs, Carslaw, 2012), the positive
biases at most sites are below 10 % and as such the estimates of the effects of O3on human health and ecosystems are
ex-pected to be overestimated only by a small margin.
The ability of the DO3SE model to estimate SMD is an
important component of the modelling performed here; com-parisons with MORECS modelled estimates of SMD (Marsh et al., 2008) confirmed the DO3SE model’s estimate of high
SMD across most of England and Wales. However, it is the influence of SMD on stomatal O3flux that is the direct
driver of O3deposition. A recent evaluation paper by B¨uker
et al. (2012) provides some evidence that this term is be-ing modelled with reasonable accuracy. However, more test-ing of the module is required to ensure appropriate capture of the influence of SMD on O3deposition to different land
cover types over the course of the growing season. This will be important for future O3deposition simulations given
ob-servations that suggest an increasing frequency of hot sum-mers followed by winter rainfall deficits over southern Eu-rope (Vautard et al., 2007).
In addition to SMD there are other recognised uncertain-ties in the estimates of O3deposition, which include aspects
of the non-stomatal deposition with evidence that this can vary with environmental conditions, such as surface wet-ness and temperature (Fowler et al., 2009). As such, the use of constant deposition terms to these non-stomatal sinks as-sumed in the DO3SE model would benefit from a rigorous
re-view. Additionally, efforts to re-formulate and parameterise the stomatal component of the DO3SE model may benefit
from a focus on the incorporation of more process orientated algorithms that can account for changes in photosynthetic
ca-pacity and hence atmospheric CO2concentrations, especially
under changing climates; such methods have been developed and trialled (B¨uker et al., 2007) but are yet to be used to esti-mate critical levels and hence are not yet available for use in O3risk assessment.
Finally, it is also recognised that under extreme meteoro-logical conditions mechanisms other than O3deposition will
affect O3concentrations. For example, the NOxor VOC
lim-itation to O3 formation was found to change during spring
and summer O3 episodes occurring in 1995 across the UK
with implications for NO scavenging and subsequent O3
assessments (Strong et al., 2010). Vieno et al. (2010) also described the importance of capturing changes in temper-ature and subsequent biogenic isoprene emission that will occur under heat wave conditions. This is important due to the role of isoprene as an O3radical source both due to its
short lifetime (∼5 h) as well as the temperature dependence of its emissions with isoprene concentrations having been shown to increase rapidly according to a non-linear relation-ship with temperature during heat wave O3 episodes (Lee
et al., 2006). If these biogenic emissions are underestimated whilst NOxemissions remain high then less local O3
produc-tion would be simulated (Vieno et al., 2010). Similar effects would also be caused by underestimating temperature as this would favour peroxyacetyl nitrate (PAN) formation tying up NOxthat would otherwise lead to O3formation (Vieno et al.,
2010). An additional consideration is the deposition of other pollutants that follow the same pathway as O3, for example,
NOxdry deposition may also be reduced by stomatal closure,
and may lead to increased chemical titration of O3within the
plant canopy (Fares et al., 2012). Further, capturing the wind direction accurately is extremely important for assessment of background O3concentrations upon which local O3
produc-tion relies; for example, in the UK many O3 episodes can
be attributed to long-range transport arising from precursors originating over continental Europe (Vieno et al., 2010). This also means that the trajectory pathway of these plumes will be affected by O3 chemistry in the atmosphere and O3
de-position; an understanding of the influence of these factors along trajectories is fundamental to accurate assessments of O3concentrations downwind of major sources.
5 Conclusions
The study clearly showed the importance of the O3
absorb-ing capacity of vegetation in determinabsorb-ing human health risk through alterations in ground level O3 concentrations. For
extreme meteorological events characterised by heat wave conditions lasting only a few weeks, the model estimates that the effect of reducing O3dry deposition due to drought
are estimated to exceed ∼460 excess deaths in the UK in a worst case scenario, though there is some uncertainty in the absolute value of these numbers. At the same time, O3
acknowledged that the NPP is also likely to be decreased by drought stress. As such, not only is it important to improve our understanding of how emissions and meteorology couple to influence O3 formation, but also how seasonal
environ-mental conditions will affect the physiological activity and hence O3sink strength of the underlying vegetation.
Under-standing how these factors are likely to interact under those conditions, most likely to lead to high O3episodes in the
fu-ture under changing climates, will provide valuable informa-tion to help inform policy decisions on emission reducinforma-tions that can alleviate the worst effects of O3pollution both to
hu-man health as well as vegetation and subsequent ecosystem services.
Acknowledgements. We acknowledge support provided by the UK Department of Environment and rural affairs (Defra) under contract AQ0106 for the provision of funds for this study. We also thank the two anonymous reviewers for their useful comments which improved the quality of this manuscript.
Edited by: L. Ganzeveld
Supplementary material related to this article is
available online at: http://www.atmos-chem-phys.net/13/ 6741/2013/acp-13-6741-2013-supplement.pdf.
References
Ashmore, M., Emberson, L., Karlsson, P. E., and Pleijel, H.: New Directions: A new generation of ozone critical levels for the pro-tection of vegetation in Europe, Atmos. Environ., 38, 2213–2214, 2004.
Builtjes, P.: Review of Methods for Assessing Air Quality at the Re-gional/Continental Scale, The 6th Framework programmes: Air quality assessment for Europe: from local to continental scale, 2005.
B¨uker, P., Emberson, L. D., Ashmore, M. R., Cambridge, H. M., Jacobs, C. M. J., Massman, W. J., M¨uller, J., Nikolov, N., Novak, K., Oksanen, E., Schaub, M., and de la Torre, D.: Comparison of different stomatal conductance algorithms for ozone flux mod-elling, Environ. Pollut., 146, 726–735, 2007.
B¨uker, P., Morrissey, T., Briolat, A., Falk, R., Simpson, D., Tuovi-nen, J.-P., Alonso, R., Barth, S., Baumgarten, M., Grulke, N., Karlsson, P. E., King, J., Lagergren, F., Matyssek, R., Nunn, A., Ogaya, R., Pe˜nuelas, J., Rhea, L., Schaub, M., Uddling, J., Werner, W., and Emberson, L. D.: DO3SE modelling of soil moisture to determine ozone flux to forest trees, Atmos. Chem. Phys., 12, 5537–5562, doi:10.5194/acp-12-5537-2012, 2012. Byun, D. W. and Ching, J. K. S.: Science algorithms of the
EPA models-3 Community Multiscale Air Quality (CMAQ) modelling system, available from: http://www.epa.gov/asmdnerl/ CMAQ/CMAQscienceDoc.html, 1999.
Carslaw, D.: Defra Phase 2 regional model evaluation,
avail-able from: www.erg.kcl.ac.uk/downloads/Policy Reports/
regionalPhase2.pdf, 2012.
Chang, J. C. and Hanna, S. R.: Air quality model performance eval-uation, Met. Atmos. Phys., 87, 167–196, 2004.
Chemel, C., Sokhi, R. S., Yu, Y., Hayman, G. D., Vincent, K. J., Dore, A. J., Tang, Y. S., Parin, H. D., and Fisher, B. E. A.: Eval-uation of a CMAQ simulation at high resolution over the UK for the calendar year 2003, Atmos. Environ., 44, 2927–2939, 2010. Ciais, P., Reichstein, M., Viovy, N., Granier, a, Og´ee, J., Allard, V.,
Aubinet, M., Buchmann, N., Bernhofer, C., Carrara, A., Cheval-lier, F., De Noblet, N., Friend, A. D., Friedlingstein, P., Grun-wald, T., Heinesch, B., Keronen, P., Knohl, A., Krinner, G., Loustau, D., Manca, G., Matteucci, G., Miglietta, F., Ourci-val, J. M., Papale, D., Pilegaard, K., Rambal, S., Seufert, G., Soussana, J. F., Sanz, M. J., Schulze, E. D., Vesala, T., and Valentini, R.: Europe-wide reduction in primary productivity caused by the heat and drought in 2003, Nature, 437, 529–533, doi:10.1038/nature03972, 2005.
Cieslik, S. A.: Ozone uptake by various surface types: a comparison between dose and exposure, Atmos. Environ., 38, 2409–2420, doi:10.1016/j.atmosenv.2003.10.063, 2004.
Cinderby, S., Emberson, L., Owen, A., and Ashmore, M.: CCE Progress Report: LRTAP land cover map of Europe, avail-able from: http://www.rivm.nl/bibliotheek/digitaaldepot/PBL CCE PR07 PartI 5.pdf, 2007.
Colbeck, I. and Harrison, R. M.: The photochemical pollution episode of 5-16 July 1983 in North-West England, Atmos. En-viron., 19, 1921–1929, 1985.
COMEAP: Quantification of the effects of air pollution on health in Great Britain, Department of Health Committee on the Medical Effects of Air Pollutants, 1998.
Derwent, R., Fraser, A., Abbott, J., Jenkin, J., Willis, P., and Murrells, T.: Evaluating the performance of air qual-ity models, available from: www.airqualqual-ity.co.uk/reports/cat05/ 1006241607 100608 MIP Final Version.pdf, 2010.
Doherty, R. M., Heal, M. R., Wilkinson, P., Pattenden, S., Vieno, M., Armstrong, B., Atkinson, R., Chalabi, Z., Kovats, S., Milo-jevic, A., and Stevenson, D. S.: Current and future climate- and air pollution-mediated impacts on human health., Environmental health?: a global access science source, 8 Suppl 1 (August 2003), S8, doi:10.1186/1476-069X-8-S1-S8, 2009.
EEA: Air pollution in Europe 1990–2004, Copenhagen, 2007. Emberson, L. D., Simpson, D., Tuovinen, J.-P., Ashmore, M. R.,
and Cambridge, H. M.: Towards a model of ozone deposition and stomatal uptake over Europe, available from: http://emep. int/publ/reports/2000/dnmi note 6 2000.pdf, 2000.
Emberson, L. D., Ashmore, M. R., Simpson, D., Tuovinen, J.-P., and Cambridge, H. M.: Modelling and mapping ozone deposition in Europe, Water Air Soil Pollut., 130, 577–582, 2001.
Emberson, L. D., B¨uker, P., and Ashmore, M. R.: Assessing the risk caused by ground level ozone to European forest trees: a case study in pine, beech and oak across different climate regions, En-viron. Pollut., 147, 454–466, doi:10.1016/j.envpol.2006.10.026, 2007.
Fares, S., Weber, R., Park, J.-H., Gentner, D., Karlik, J., and Gold-stein, A. H.: Ozone deposition to an orange orchard: Partitioning between stomatal and non-stomatal sinks, Environ. Pollut., 169, 258–266, doi:10.1016/j.envpol.2012.01.030, 2012.
Relation Between Temperature, Ozone, and Mortality in Nine French Cities During the Heat Wave of 2003, Environ. Health Perspect., 114, 1344–1347, doi:10.1289/ehp.8328, 2006. Fischer, E. M., Seneviratne, S. I., Vidale, P. L., L¨uthi, D., and
Sch¨ar, C.: Soil Moisture–Atmosphere Interactions during the 2003 European Summer Heat Wave, J. Climate, 20, 5081–5099, doi:10.1175/JCLI4288.1, 2007.
Fowler, D., Flechard, C., Cape, J. N., Storeton-West, R., and Coyle, M.: Measurements of ozone deposition to vegetation quantifying the flux, the stomatal and non-stomatal components, Water Air Soil Pollut., 130, 63–74, 2001.
Fowler, D., Pilegaard, K., Sutton, M. a., Ambus, P., Raivonen, M., Duyzer, J., Simpson, D., Fagerli, H., Fuzzi, S., Schjoerring, J. K., Granier, C., Neftel, A., Isaksen, I. S. A., Laj, P., Maione, M., Monks, P. S., Burkhardt, J., Daemmgen, U., Neirynck, J., Per-sonne, E., Wichink-Kruit, R., Butterbach-Bahl, K., Flechard, C., Tuovinen, J. P., Coyle, M., Gerosa, G., Loubet, B., Altimir, N., Gruenhage, L., Ammann, C., Cieslik, S., Paoletti, E., Mikkelsen, T. N., Ro-Poulsen, H., Cellier, P., Cape, J. N., Horv´ath, L., Loreto, F., Niinemets, ¨U., Palmer, P. I., Rinne, J., Misztal, P., Nemitz, E., Nilsson, D., Pryor, S., Gallagher, M. W., Vesala, T., Skiba, U., Br¨uggemann, N., Zechmeister-Boltenstern, S., Williams, J., O’Dowd, C., Facchini, M. C., De Leeuw, G., Floss-man, A., Chaumerliac, N., and ErisFloss-man, J. W.: Atmospheric com-position change: Ecosystems–Atmosphere interactions, Atmos. Environ., 43, 5193–5267, doi:10.1016/j.atmosenv.2009.07.068, 2009.
Fuhrer, J.: Ozone risk for crops and pastures in present and future climates, Die Naturwissenschaften, 96, 173–94, doi:10.1007/s00114-008-0468-7, 2009.
Guenther, A., Hewitt, C. N., Erickson, D., Fall, R., Geron, C., Graedel, T., Harley, P., Klinger, L., Lerdau, M., Mckay, W. A., Pierce, T., Scholes, B., Steinbrecher, R., Tallamraju, R., Taylor, J., and Zimmerman, P.: A global model of natural volatile organic compound emissions, J. Geophys. Res., 100, 8873–8892, 1995. Harmens, H., Mills, G., Emberson, L. D., and Ashmore, M. R.:
Implications of climate change for the stomatal flux of ozone: a case study for winter wheat, Environ. Pollut., 146, 763–770, doi:10.1016/j.envpol.2006.05.018, 2007.
Hough, M. N. and Jones, R. J. A.: The United Kingdom Mete-orological Office rainfall and evaporation calculation system: MORECS version 2.0-an overview, Hydrol. Earth Syst. Sci., 1, 227–239, doi:10.5194/hess-1-227-1997, 1997.
IGBP: An Economic Analysis to inform the Air Quality Strategy, 2007.
Jarvis, P. G.: The interpretation of the variations in leaf water po-tential and stomatal conductance found in canopies in the field., Philos. T. Roy. Soc. Lond., B, 273, 593–610, 1976.
Jenkin, M. E., Davies, T. J., and Stedman, J. R.: The origin and day-of-week dependance of photochemical ozone episodes in the U.K., Atmos. Environ., 36, 999–1012, 2002.
Johnson, H., Kovats, R. S., McGregor, G., Stedman, J., Gibbs, M., Walton, H., Cook, L., and Black, E.: The impact of the 2003 heat-wave on mortality and hospital admissions in England, Health Stat. Q., 25, 6–11, 2005.
Lee, J., Lewis, A., Monks, P., Jacob, M., Hamilton, J., Hop-kins, J., Watson, N., Saxton, J., Ennis, C., and Carpenter, L.: Ozone photochemistry and elevated isoprene during the UK heatwave of august 2003, Atmos. Environ., 40(39), 7598–7613,
doi:10.1016/j.atmosenv.2006.06.057, 2006.
LRTAP Convention: Modelling and assessment of the health impact of particulate matter and ozone, 2004.
LRTAP Convention: Manual on Methodologies and Criteria for Modelling and Mapping Critical Loads & Levels and Air Pollu-tion Effects, Risks and Trends. Chapter 3: Mapping Critial Lev-els for Vegetation, [online] Available from: Convention, L., 2010. Manual on Methodologies and Criteria for Modelling and Map-ping Critical Loads & Levels and Air Pollution Effects, Risks and Trends. Chapter 3: Mapping Critial Levels for Vegetation, avail-able at: http://icpvegetation.ceh.ac.uk/manuals/mappingmanual. html, 2008.
LRTAP Convention: Manual on Methodologies and Criteria for Modelling and Mapping Critical Loads & Levels and Air Pollu-tion Effects, Risks and Trends. Chapter 3: Mapping Critial Lev-els for Vegetation, available from: http://icpvegetation.ceh.ac.uk/ manuals/, 2010.
Lyamani, H., Olmo, F. J., Alc´antara, A., and Alados-Arboledas, L.: Atmospheric aerosols during the 2003 heat wave in southeastern Spain I: Spectral optical depth, Atmos. Environ., 40, 6453–6464, doi:10.1016/j.atmosenv.2006.04.048, 2006.
Marsh, T., Hannaford, J., and Sanderson, F.: 2006 UK hydrologi-cal review, available from: http://www.ceh.ac.uk/data/nrfa/nhmp/ annual review.html, 2008.
Matyssek, R., Bytnerowicz, A., Karlsson, P.-E., Paoletti, E., Sanz,
M., Schaub, M., and Wieser, G.: Promoting the O3 flux
con-cept for European forest trees, Environ. Pollut., 146, 587–607, doi:10.1016/j.envpol.2006.11.011, 2007.
McDonald, A. G., Bealey, W. J., Fowler, D., Dragosits, U., Skiba, U., Smith, R. I., Donovan, R. G., Brett, H. E., He-witt, C. N., and Nemitz, E.: Quantifying the effect of ur-ban tree planting on concentrations and depositions of PM10 in two UK conurbations, Atmos. Environ., 41, 8455–8467, doi:10.1016/j.atmosenv.2007.07.025, 2007.
Monteith, J. L.: Evaporation and environment, Symp. Soc. Exp. Biol., 19, 205–234, 1965.
ONS: Mortality statistics: Death registered in 2006, 2008. Passant, N. R.: Speciation of UK emissions of non-methane volatile
organic compounds, available from: http://uk-air.defra.gov.uk/ reports/empire/AEAT ENV 0545 final v2.pdf, 2002
Pio, C. A., Feliciano, M. S., Vermeulen, A. T., and Sousa, E. C.: Seasonal variability of ozone dry deposition under southern Eu-ropean climate conditions, Atmos. Environ., 34, 195–205, 2000. Pleim, J. E., Xiu, A., Finkelstein, P. L., and Otte, T. L.: A coupled land-surface and dry deposition model and comparison to field measurements of surface heat, moisture, and ozone fluxes, Water Air Soil Pollut., 1, 243–252, 2001.
Ren, C., Williams, G. M., Mengersen, K., Morawska, L., and Tong, S.: Does temperature modify short-term effects of ozone on to-tal morto-tality in 60 large eastern US communities? An assess-ment using the NMMAPS data, Environ. Int., 34, 451–458, doi:10.1016/j.envint.2007.10.001, 2008.
Royal Society: Ground-level ozone in the 21st century: future trends, impacts and policy implications, London, 2008. Sanderson, M. G., Jones, C. D., Collins, W. J., Johnson, C. E.,