RESEARCH ARTICLE
Regulation of Adipogenesis and Key
Adipogenic Gene Expression by 1,
25-Dihydroxyvitamin D in 3T3-L1 Cells
Shuhan Ji, Matthew E. Doumit, Rodney A. Hill¤*
Department of Animal and Veterinary Sciences, University of Idaho, Moscow, Idaho, United States of America
¤ Current address: School of Biomedical Sciences, Charles Sturt University, Wagga Wagga, New South
Wales, Australia *[email protected]
Abstract
The functions of 1, 25-dihydroxyvitamin D (1, 25-(OH)2D3) in regulating adipogenesis,
adi-pocyte differentiation and key adipogenic gene expression were studied in 3T3-L1 preadi-pocytes. Five concentrations (0.01, 0.1, 1, 10, 100nM) of 1, 25-(OH)2D3were studied and
lipid accumulation measured by Oil Red O staining and expression of adipogenic genes quantified using quantitative real-time PCR. Adipogenic responses to 1, 25-(OH)2D3were
determined on 6, and 12 h, and days 1-10 after induction of adipogenesis by a hormonal cocktail with or without 1, 25-(OH)2D3. In response to 1, 25-(OH)2D3(1, 10, and 100 nM),
lipid accumulation and the expression ofPPARγ,C/EBPα,FABP4andSCD-1were inhib-ited through day 10, and vitamin D receptor expression was inhibinhib-ited in the early time points. The greatest inhibitory effect was upon expression ofFABP4. Expression of
SREBP-1cwas only affected on day 2. The lowest concentrations of 1, 25-(OH)2D3tested
did not affect adipocyte differentiation or adipogenic gene expression. TheC/EBPα promot-er activity response to 1, 25-(OH)2D3was also tested, with no effect detected. These results
indicate that 1, 25-(OH)2D3inhibited adipogenesis via suppressing adipogenic-specific
genes, and is invoked either during PPARγactivation or immediately up-stream thereof. Gene expression down-stream of PPARγespeciallyFABP4was strongly inhibited, and we suggest that the role of 1, 25-(OH)2D3in regulating adipogenesis will be informed by further
studies of adipogenic-specific gene promoter activity.
Introduction
Growth of adipose tissue mass involves two distinct processes: hypertrophy (because of lipid synthesis and the subsequent increase in the size of adipocytes) and hyperplasia (because of proliferation, when preadipocyte and adipocyte numbers increase) [1]. Adipogenesis is the process of preadipocyte differentiation to form mature adipocytes, and during this process lipid accumulation occurs. The transcriptional control of adipocyte differentiation requires a
OPEN ACCESS
Citation:Ji S, Doumit ME, Hill RA (2015) Regulation of Adipogenesis and Key Adipogenic Gene Expression by 1, 25-Dihydroxyvitamin D in 3T3-L1 Cells. PLoS ONE 10(6): e0126142. doi:10.1371/ journal.pone.0126142
Academic Editor:Luísa M Seoane, Complexo Hospitalario Universitario de Santiago, SPAIN
Received:November 3, 2014
Accepted:March 30, 2015
Published:June 1, 2015
Copyright:© 2015 Ji et al. This is an open access article distributed under the terms of theCreative Commons Attribution License, which permits unrestricted use, distribution, and reproduction in any medium, provided the original author and source are credited.
Data Availability Statement:All relevant data are within the paper and its Supporting Information files.
Funding:The authors thank the Idaho Experiment Station for support of these studies. The authors also thank the China Scholarship Council for support of Ms. Shuhan Ji.
sequential series of gene expression events and activation of a number of key signaling path-ways [2]. This cascade starts with the induction of CCAAT/enhancer—binding proteinβandδ
(C/EBPβand C/EBPδ). These two proteins then induce the expression of nuclear receptor per-oxisome proliferator—activated receptorγ(PPARγ), which in turn inducesC/EBPαexpression [3]. Once expressed, C/EBPαactivity positively feeds back on PPARγactivity. These two fac-tors enhance each other’s expression and maintain the differentiated state [4]. Sterol-regulatory element binding protein 1c (SREBP-1c) is another notable key adipogenic gene [5].SREBP-1c
was independently discovered by two different research groups, and was named as ADD1 and SREBP-1c [6] [7]. This gene is induced during adipogenesis and is further regulated by insulin in cultured adipocytes [8,9]. In addition, SREBP-1c can modulate a variety of genes linked to fatty acid and triglyceride metabolism, and can also regulate adipogenesis [3] via induction of PPARγgene expression through E box motifs present in the PPARγpromoter [10]. Increased expression ofSREBP-1cleads to activation ofPPARγby inducing its expression and by increas-ing the production of an endogenous PPARγligand. All these transcriptional factors are neces-sary for the terminally differentiated phenotype.
Moreover, in humans, obesity is characterized by an increase in lipid accumulation and is the leading risk-factor for the development of Type 2 diabetes[11]. Understanding the biologi-cal process of adipogenesis is important for the development of novel targets for obesity thera-py. Increasing evidence suggests there is a potential link between obesity and vitamin D insufficiency[12]. The bioactive metabolite of vitamin D is 1, 25 - (OH)2D3, which acts as a
steroid hormone and a highaffinity ligand for the vitamin D receptor (VDR). The 1, 25 -(OH)2D3activated VDR can form a heterodimer with the retinoid X receptor (RXR), which
can bind to vitamin D response elements in various genes[13]. This VDR-RXR heterodimer may be competitive, inhibiting [14] the expression of PPARγ, which is a key regulator of adipo-genesis, and thus also inhibit adipocyte maturation[13]. Therefore, 1, 25 - (OH)2D3and VDR
may play important roles in regulating adipogenesis. The vitamin D receptor is expressed very early in adipogenesis in 3T3-L1 cells. The VDR expression levels reach a maximum during the first 6 h after induction of differentiation, then decline to background levels after 2 days[15]. This creates a short window of opportunity for 1, 25 - (OH)2D3to influence the differentiation
process in forming mature adipocytes. Previous work has indicated that 1, 25 - (OH)2D3is an
inhibitor of adipogenesis in the 3T3-L1 cells[16,17]. In 1998, work performed by Kelly and Gimble [18] has established that 1, 25 - (OH)2D3inhibits adipocyte differentiation in murine
bone marrow cells. However, the specific mechanisms of the inhibitory actions of 1, 25 -(OH)2D3in adipogenesis have not been described.
In the present study, we have determined the inhibitory effect of different concentrations of 1, 25 - (OH)2D3in 3T3-L1 preadipocyte differentiation. We also studied the inhibitory activity
of different concentrations of 1, 25 - (OH)2D3on expression levels of key adipogenic genes
(C/EBPsandPPARγ). As an important transcriptional factor during adipocyte differentiation,
C/EBPαwas a focus of the present study. We sought to determine whether there is a relation-ship between the inhibitory effect of 1, 25 - (OH)2D3and the promoter activity ofC/EBPα. Our
study provides an experimental basis to better understand the function of 1, 25 - (OH)2D3in
regulation of adipogenesis, and the interactions between 1, 25 - (OH)2D3and key adipogenic
genes.
Materials and Methods
Materials
and penicillin/streptomycin were from Gibco, Life Technologies (Grand Island, NY). Trizol, DNase I kit, high capacity cDNA reverse transcription kit (Cat # 4368814), and Taqman Mas-ter Mix were obtained from Life Technologies (Grand Island, NY). The Dual ReporMas-ter Lucifer-ase Assay System was purchLucifer-ased from Promega Corporation, (Madison, WI). Oil Red O (ORO) powder, dexamethasone (D8893), insulin from bovine pancreas (I6634), 3-isobutyl-1-methylxanthine (IBMX) (I7018), and 1α,25-Dihydroxyvitamin D3(D1530) were purchased
from Sigma-Aldrich (St. Louis, MO). Mouse-specific anti-PPARγ(sc-7196) rabbit polyclonal antibody was purchased from Santa Cruz Biotechnology (Dallas, Texas). Mouse-specific anti-C/EBPα(ab139731) rabbit polyclonal antibody, and anti-β-actin mouse-monoclonal (ab8226) were purchased from Abcam (Cambridge, MA). AlexaFluor 680 anti-rabbit IgG was from life Technologies (Grand Island, NY) and IRDye800 anti-mouse IgG was from Li-Cor (Lincoln, NE).
Cell culture
Mouse 3T3-L1 preadipocytes were cultured at 37°C with 5% CO2enriched air in DMEM with
10% FBS, 100 I.U. /ml penicillin, 100μg/ml streptomycin (basal growth medium). Cells were seeded in 6-well plates and 24-well plates with glass cover slips in basal growth medium and cultured until confluent. On day 0 (two days post confluence), 1, 25-dihydroxyvitamin D was added to the differentiation medium at the following final concentrations: 100, 10, 1, 0.1, and 0.01 nM, and cultures were incubated for 48 h. Cells grown in basal growth medium without 1, 25-dihydroxyvitamin D served, as a negative control. Cells grown in medium containing basal growth medium with dexamethasone (1μM), IBMX (500μM) and insulin (1.7 mM) (standard hormonal differentiation medium, DM) served, as a positive control. For the DMI treatment, insulin, dexamethasone and IBMX were provided for the first 48 h followed by only insulin in basal growth medium throughout the remaining time points. Media were changed every 2 days for all treatments. Cells were harvested on 0, 6, and 12 h, and days 1, 2, 4, 6, 8 and 10 for RNA extraction, or protein extraction. Parallel cultures were stained with ORO and representative images of ORO stained cells on day 10 were quantified using MetaMorph Image analysis soft-ware (Nashville, TN).
Cells and transfection
For each cell culture well, 3.5×1053T3-L1 cells were plated and allowed to reach 80% conflu-ence. Cells were then co-transfected with 2μg [pGL4.10 (luc2/-500 C/EBPα)] and 0.2μg of in-ternal transfection control vector [pGL4.74 (hRluc/TK)], and transferred to growth medium. Cells were incubated 24 h, and allowed to reach 100% confluence. Two days post confluence cells (0 h) were treated with 100 nM of 1, 25(OH)2D3plus differentiation medium,
differentia-tion medium only, or growth medium only. Cells were harvested on 0, 12, 24, and 24 h, and as-sayed for firefly luciferase and renilla luciferase activities using the Dual Reporter Luciferase Assay System (Promega, Madison, WI) and a Wallac 1420 Multi Label Counter. Firefly lucifer-ase activity units were normalized to units of renilla luciferlucifer-ase activity to correct for transfec-tion efficiency.
Oil Red O (ORO) and Hematoxylin staining
60% isopropanol. Oil Red O solution (6:4 v/v of stock solution and water) was added and incu-bated for 10 min at RT. Finally, cells were washed with distilled water, three times. Hematoxy-lin counter staining was done according to the manufacturer’s instructions. Briefly, cells were incubated with filtered hematoxylin for two minutes and rinsed twice with tap water. Differen-tiation solution (0.25% HCl in 70% alcohol) was added and cells were rinsed again with tap water. The glass cover slips were then removed from the wells and inverted on to a glass slide with mounting medium (Vecta Shield, Vector Labs, Burlingame, CA).
RNA extraction and cDNA synthesis
Total RNA was extracted using Trizol according to the manufacturer’s instructions. The RNA pellet was resuspended in nuclease-free water and stored at -80°C until further use. RNA was quantified using a Nanodrop ND-1000 UV-Vis Spectrophotometer (Nanodrop Technologies, Wilmington, DE). The quality of RNA was verified on 1% agarose gels. Twoμg of RNA from each treatment was DNase treated. Synthesis of cDNA was conducted using a high capacity cDNA reverse transcription kit and random hexamers as primers according to the manufactur-er’s instructions. To ensure availability of cDNA sufficient to perform all real-time PCR reac-tions, cDNA synthesized from 2μg of RNA was pooled for each sample. Pooled cDNA was diluted 1:10 using nuclease-free water for real-time PCR.
Real-time PCR
Quantitative real-time PCR was performed using Taqman MGB primer/probe sets with an ABI 7500 Fast Real Time PCR system (Applied Biosystems, Foster City, CA). Primers and probes for all genes were designed using Applied Biosystems Primer Express 3.0 software. Primers (Integrated DNA Technologies, Coralville, IA) and probes (Life Technologies, Grand Island, NY) were designed to have a Tm of 58–60°C and 69–70°C, respectively. Primer-probe sets that span exon-junctions (trans-intronic positions) were chosen for real-time PCR, to pre-vent binding to genomic DNA (Table 1). Eukaryotic translation elongation factor 2 (EEF2) was used as an endogenous control for gene expression. Probes were labeled with 6-FAM or VIC for all target genes or control (EEF2), respectively. Real-time PCR assays for each sample were conducted in duplicate wells with all genes including endogenous control on the same plate. Reactions contained Taqman Universal Fast PCR Master Mix, No AmpErase UNG (Applied Biosystems, Foster City, CA) (1X), forward primer (0.5μM), reverse primer (0.5μM), Taqman probe (0.125μM) and cDNA template made up to a final volume of 15μl in nuclease-free water. Real-time PCR cycle conditions included a holding time of 90°C for 20 sec, followed by 40 cycles of 90°C for 3 sec and 60°C for 30 sec of melting and extension temperatures, respectively.
Data were analyzed using the relative CT(∆∆Ct) method[20]. Average Ct values of
endoge-nous control (EEF2) were subtracted from target gene average Ct values of each gene, to obtain ∆Ct values of each gene for each sample. For each gene,∆Ct values in the control treatment at each time point were used to normalize∆Ct values of corresponding time points of each treat-ment to obtain∆∆Ct and mRNA fold expression values [2(-∆∆Ct)].
Western Blot
then transferred to PVDF membrane. Membranes were blocked with 5% non-fat milk in 1X TBST for 1h at room temperature. Membranes were incubated with anti-PPARγ, anti-C/EBPα
and anti-β-actin at 4°C overnight, then washed with 1X TBST and incubated with AlexaFluor 680 conjugated anti-rabbit IgG and IRDye 800 conjugated anti-mouse IgG for 1 h at room tem-perature. After thorough washing, blots were scanned and quantified using an Odyssey Dual Infrared Imaging System (Li-Cor).
Microscopy
Images were obtained using a Nikon 80i phase-contrast microscope, using a 20X objective lens. Image quantification was performed using MetaMorph Image analysis software (Nashville, TN). Area fractions were collected for each image. Images were collected in six to eight repli-cates from each culture well. Average area fractions of each of the six to eight replirepli-cates were
Table 1. Primer-probe sets for real-time PCR.
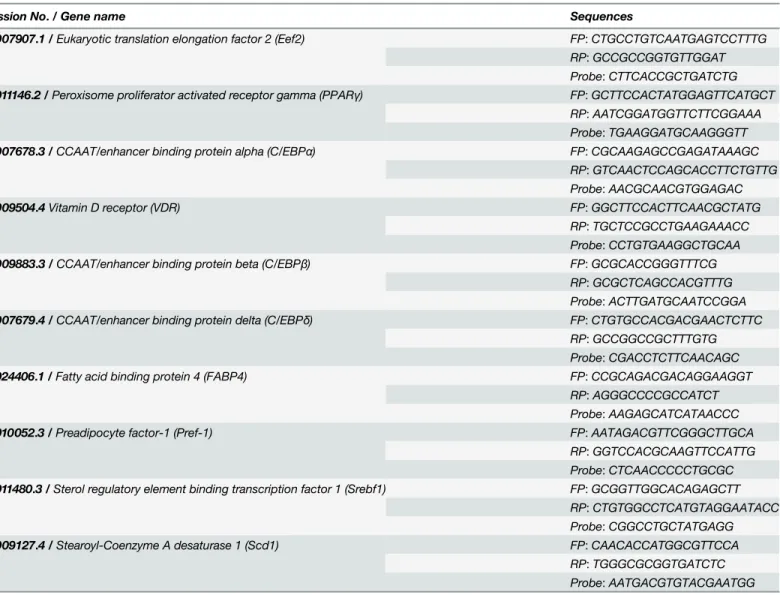
Accession No./ Gene name Sequences
NM_007907.1 /Eukaryotic translation elongation factor 2 (Eef2) FP:CTGCCTGTCAATGAGTCCTTTG RP:GCCGCCGGTGTTGGAT Probe:CTTCACCGCTGATCTG
NM_011146.2 /Peroxisome proliferator activated receptor gamma (PPARγ) FP:GCTTCCACTATGGAGTTCATGCT RP:AATCGGATGGTTCTTCGGAAA Probe:TGAAGGATGCAAGGGTT
NM_007678.3 /CCAAT/enhancer binding protein alpha (C/EBPα) FP:CGCAAGAGCCGAGATAAAGC RP:GTCAACTCCAGCACCTTCTGTTG Probe:AACGCAACGTGGAGAC
NM_009504.4Vitamin D receptor (VDR) FP:GGCTTCCACTTCAACGCTATG RP:TGCTCCGCCTGAAGAAACC Probe:CCTGTGAAGGCTGCAA
NM_009883.3 /CCAAT/enhancer binding protein beta (C/EBPβ) FP:GCGCACCGGGTTTCG RP:GCGCTCAGCCACGTTTG Probe:ACTTGATGCAATCCGGA
NM_007679.4 /CCAAT/enhancer binding protein delta (C/EBPδ) FP:CTGTGCCACGACGAACTCTTC RP:GCCGGCCGCTTTGTG Probe:CGACCTCTTCAACAGC
NM_024406.1 /Fatty acid binding protein 4 (FABP4) FP:CCGCAGACGACAGGAAGGT RP:AGGGCCCCGCCATCT Probe:AAGAGCATCATAACCC
NM_010052.3 /Preadipocyte factor-1 (Pref-1) FP:AATAGACGTTCGGGCTTGCA RP:GGTCCACGCAAGTTCCATTG Probe:CTCAACCCCCTGCGC
NM_011480.3 /Sterol regulatory element binding transcription factor 1 (Srebf1) FP:GCGGTTGGCACAGAGCTT RP:CTGTGGCCTCATGTAGGAATACC Probe:CGGCCTGCTATGAGG
NM_009127.4 /Stearoyl-Coenzyme A desaturase 1 (Scd1) FP:CAACACCATGGCGTTCCA RP:TGGGCGCGGTGATCTC Probe:AATGACGTGTACGAATGG
Primers and probe sequences used in real-time PCR listed 5’to 3’: Forward primer (FP), reverse primer (RP) and Taqman probes for the following genes were designed from the corresponding GenBank accession numbers.
doi:10.1371/journal.pone.0126142.t001
used to calculate average area fraction of each treatment sample. Further, average area fraction values of each treatment were normalized to average area fraction values of corresponding controls.
Statistical analysis
Statistical analysis software (SAS) 9.3 was used to perform all data analysis. Data were analyzed using a one-way analysis of variance (ANOVA) for each time point. Tukey’s test was used to find the significant differences among the different means. Differences, whenp<0.05, were
considered statistically significant. Gene expression data were analyzed by comparing log (base 2) transformed values of mRNA fold expression across treatments within each time-point. All data are reported as mean ± SE (n = 3).
Results
1, 25 - (OH)
2D
3inhibits lipid accumulation
Cultures of 3T3-L1 cells were incubated in standard hormonal differentiation medium, in the presence or absence of 1, 25 - (OH)2D3. DMI medium served as a positive control treatment.
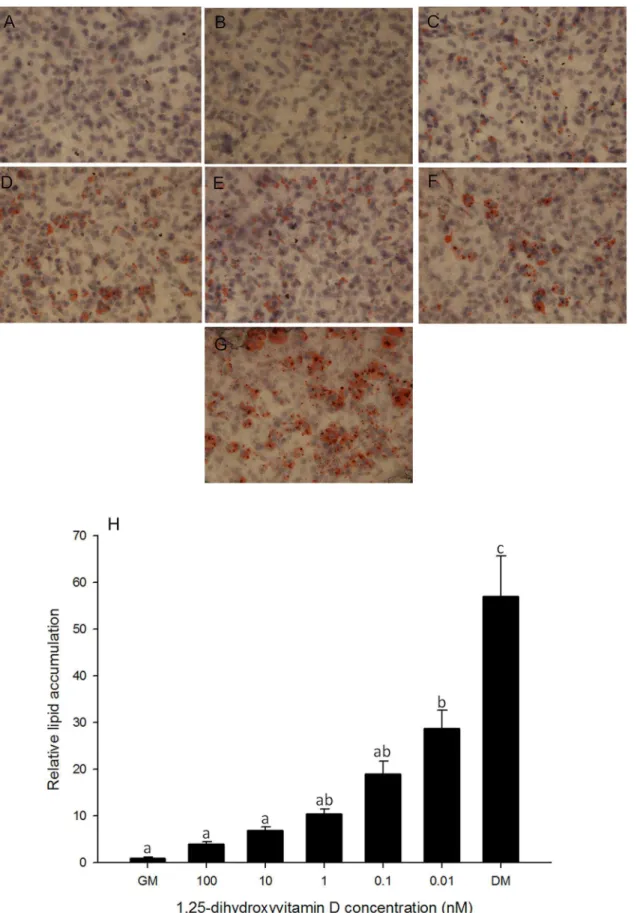
Basal growth medium served as a negative control. Lipid accumulation was observed through ORO staining on days 0, 2, 4, 6, 8 (data not shown) and 10 (Fig 1A). Image quantification anal-ysis shows that lipid accumulation at higher concentrations of 1, 25 - (OH)2D3(100, 10, 1 nM)
treated cells was similar to that in negative control cells, and significantly lower than the posi-tive control (Fig 1B). The lowest concentration of 1, 25 - (OH)2D3treated cells showed higher
lipid accumulation than negative control and other 1, 25 - (OH)2D3treated cells, however,
lipid accumulation was still significantly lower when compared to the positive control (Fig 1B). This suggests that 1, 25 - (OH)2D3treatment inhibited lipid accumulation and adipogenesis in
a dose dependent manner.
High concentrations of 1, 25 - (OH)
2D
3inhibit PPAR
γ
expression
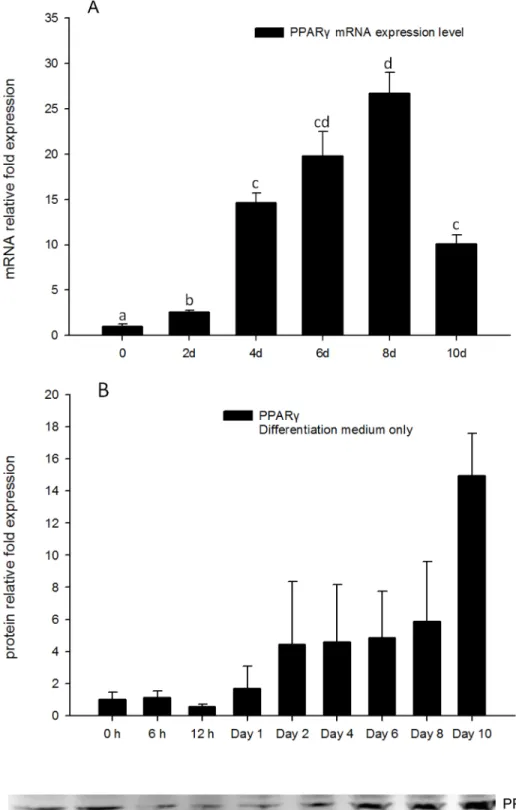
To better understand the expression pattern ofPPARγduring the process of adipocyte differ-entiation, RNA extracts and protein extracts from 3T3-L1 cells treated with DM only were ob-tained for real-time PCR and Western blots tests. Gene expression levels ofPPARγbegan to increase after day 2, and reached a maximum on day 8 (Fig 2A). Protein levels of PPARγwere consistent with gene expression levels, increasing on day 2, and reaching the highest level on day 10 (Fig 2B). This suggestsPPARγexpression level increased concurrent with adipocyte dif-ferentiation, and consistent with increasing lipid accumulation.
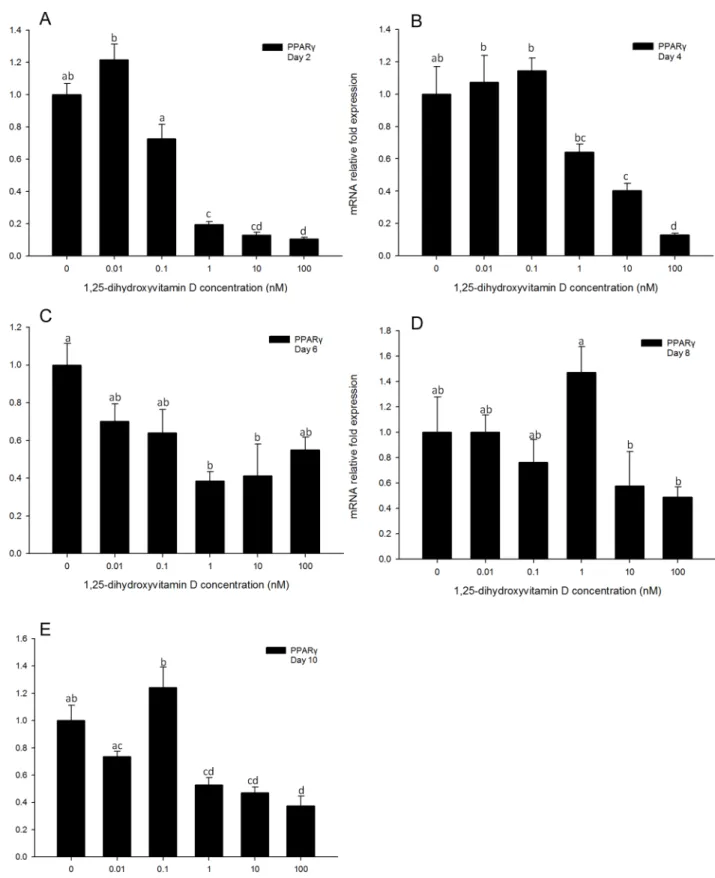
Gene expression levels ofPPARγin 3T3-L1 cells treated with high concentrations (100, 10, and 1 nM) of 1, 25 - (OH)2D3were significantly inhibited compared to the positive control
(Fig 3A–3E) at all time-points measured. In addition, for all time-points, 3T3-L1 cultures treat-ed with low concentrations (0.1 and 0.01 nM) of 1, 25 - (OH)2D3showed no significant
differ-ences inPPARγgene expression levels as compared to positive control cultures (Fig 3A–3E). On days 2, 4 and 10, the highest concentration (100 nM) of 1, 25 - (OH)2D3had the greatest
in-hibitory effect onPPARγmRNA expression levels. This suggests thatPPARγgene expression levels were inhibited by 1, 25 - (OH)2D3, and 1, 25 - (OH)2D3had greater efficacy in inhibiting
PPARγgene expression at higher concentrations.
To confirm the real-time PCR results, Western blots also were performed on whole cell ly-sates following treatment with 100 or 1 nM of 1, 25 - (OH)2D3at all the time points. Basal
Fig 1. Oil Red O staining in 3T3-L1 cells.Cells were treated with basal growth medium (GM) (A) or differentiation medium plus different concentrations of 1, 25 - (OH)2D3, 100 nM (B), 10 nM (C), 1 nM (D), 0.1 nM (E) or 0.01 nM (F) or differentiation medium (DM) (G). Oil Red O staining was performed on days 2, 4,
thereafter the PPARγprotein levels were high in the 100 nM 1, 25 - (OH)2D3treated groups,
but remained low in DM only groups from 12 h to day 4 (S1B–S1E Fig). On day 8, both the 1, 25 - (OH)2D3treated groups and DM only group had high PPARγprotein level (S1G Fig), and
on day 10, PPARγprotein levels in both 100 and 1 nM of 1, 25 - (OH)2D3treatment groups
de-creased to levels similar to the GM only treatment. However, in the DM only group, PPARγ
protein level still remained relatively high (S1H Fig). This suggests that 1, 25 - (OH)2D3
treat-ments inhibit PPARγprotein levels only at the early time point, 6 h, and again at the late time point, day 10. At the other time points, since the whole cell lysates were used for Western blots measurement, and the 1, 25 - (OH)2D3treated group had higher PPARγprotein level than the
DM only group, suggesting that the inhibitory efficacy of 1, 25 - (OH)2D3on adipogenesis may
function at the level of blocking PPARγprotein trafficking to nucleus.
Gene expression of C/EBP
α
is inhibited by high concentrations of 1, 25
-(OH)
2D
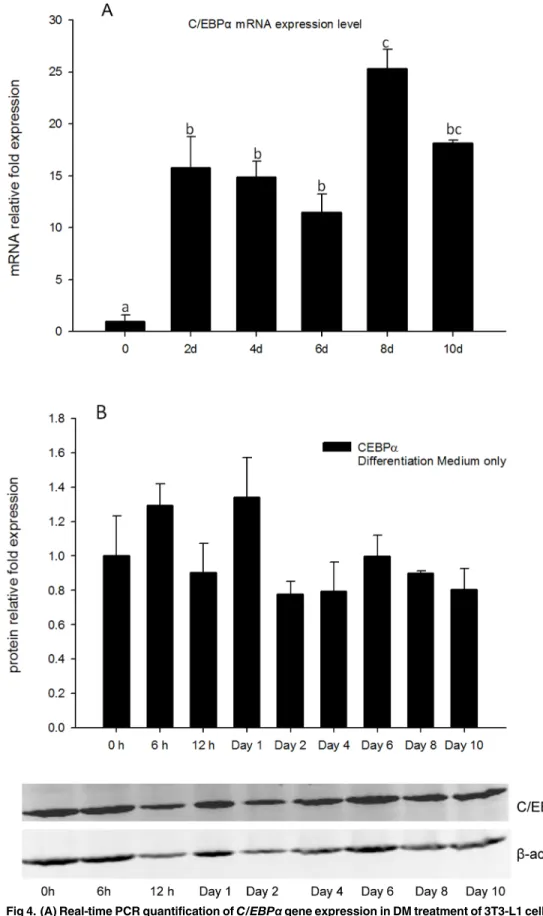
3BothC/EBPαmRNA expression and protein level were measured in DM only treatments as a reference to help understand regulation of this gene in adipocyte differentiation (Fig 4). Gene expression ofC/EBPαwas increased from days 2 to 10, and reached the maximum at day 8 (Fig 4A), however, total cell protein levels of C/EBPαdid not change significantly from 0 h to day 10 (Fig 4B), and appeared to remain at relatively high levels throughout the test period.
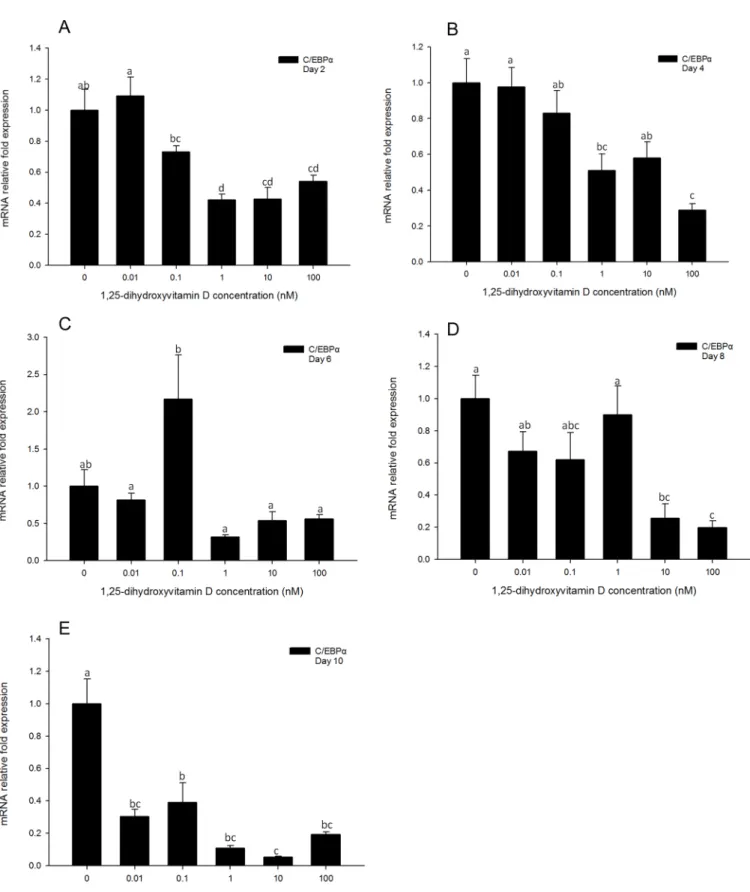
Similarly toPPARγ, no significant changes inC/EBPαgene expression levels were observed in the cells treated with low concentrations (0.01 and 0.1 nM) of 1, 25 - (OH)2D3as compared
to the positive control cells at all time-points measured. (Fig 5). Cells treated with high concen-trations (100, 10, and 1 nM) of 1, 25 - (OH)2D3showed significant inhibition ofC/EBPα
ex-pression as compared to the positive control for days 2 and 4 (Fig 5A and 5B). Similarly to
PPARγexpression,C/EBPαgene expression levels showed no significant difference between treatments groups on day 6 (Fig 5C). The inhibitory efficacy of 1, 25 - (OH)2D3was significant
on days 8 and 10 in 1, 25 - (OH)2D3treatment groups compared to DM only group (Fig 5D
and 5E). This suggests that similarly to regulation ofPPARγexpression, that 1, 25 - (OH)2D3
treatments had significant inhibitory effects onC/EBPαgene transcription, and this efficacy lasted until day 10.
Total cell protein levels of C/EBPαwere also determined (S2 Fig). In the early time points (6 and 12 h), C/EBPαprotein levels were not changed in the 1, 25 - (OH)2D3treatment groups
and DM only group compared to negative control (S2A and S2B Fig). Furthermore, there were no significant differences in C/EBPαprotein levels compared to DM only group to 1, 25 -(OH)2D3treated groups at all the time points, suggesting that total cellular C/EBPαprotein
lev-els were not influenced by 1, 25 - (OH)2D3treatment.
In the early time points, Vitamin D receptor gene expression is inhibited
by high concentrations of 1, 25 - (OH)
2D
3To better understand the expression pattern of vitamin D receptor, VDR mRNA expression lev-els were quantified from 0 h to day 10 in DM only treatments (Fig 6A). Gene expression ofVDR
increased from 6 h, reached a maximum at 12 h, and then decreased after 24 h. These results 6, 8 and 10. Representative day 10 images are shown. Images were collected at 400x magnification. (H): Quantification of lipid accumulation in 3T3-L1 cells. Lipid accumulation was quantified using MetaMorph Image analysis software. Area fractions were collected for each treatment and normalized to control of corresponding time point. Data are means±SE (n = 3). Different letters represent treatment effects that were significantly different (P<0.05). The dose-response effect of 1, 25 - (OH)2D3treatment on lipid accumulation is illustrated.
Fig 2. (A) Real-time PCR quantification ofPPARγgene expression in DM treatment of 3T3-L1 cells on days 0, 2, 4, 6, 8, and 10 withEEF2used as endogenous control (∆Ct).Data were normalized toPPARγ
gene expression of the day 0 group (∆∆Ct). (B). Image showing Western blot analysis (Odyssey Dual Infrared Imaging System (Li-Cor)) of PPARγon 0, 6, and 12 h, days 1, 2, 4, 6, 8 and 10.β-actin was used as an
show thatVDRwas induced in the early time points of adipocyte differentiation, suggesting it may play an important role in inhibition of adipocyte differentiation by 1, 25 - (OH)2D3.
Vitamin D receptorgene expression was also determined in response to 1, 25 - (OH)2D3
treatments at 6 and 12 h, and on days 1, 2, 4, 6, 8, 10. At 6 and 12 h (Fig 6B and 6C),VDRgene expression was only inhibited in cells treated with the highest concentration (100 nM) of 1, 25 - (OH)2D3. Significant changes inVDRgene expression levels were observed in the cells treated
with high concentrations (100, 10 and 1 nM) of 1, 25 - (OH)2D3as compared to the positive
control cells on days1, 2, and 4. (Fig 6D–6F). Cells treated with lower concentrations of 1, 25 -(OH)2D3showed no significant inhibition ofVDRexpression as compared to DM only group
at all the time points except day 10 (Fig 6B–6I). On day 10,VDRexpression was inhibited by 1, 25 - (OH)2D3treatments at all the concentrations (Fig 6I). This suggests that similarly to
regu-lation ofPPARγand C/EBPαexpression, 1, 25 - (OH)2D3treatments had significant inhibitory
effects onVDRgene transcription, especially early (days 1 and 2) in adipocyte differentiation. This provides robust evidence that 1, 25 - (OH)2D3regulates VDR, and that the effect is
consis-tent with a biological role for 1, 25 - (OH)2D3in adipocyte differentiation.
There is no effect of 1, 25-Dihydroxyvitamin D treatment on C/EBP
β
gene expression levels
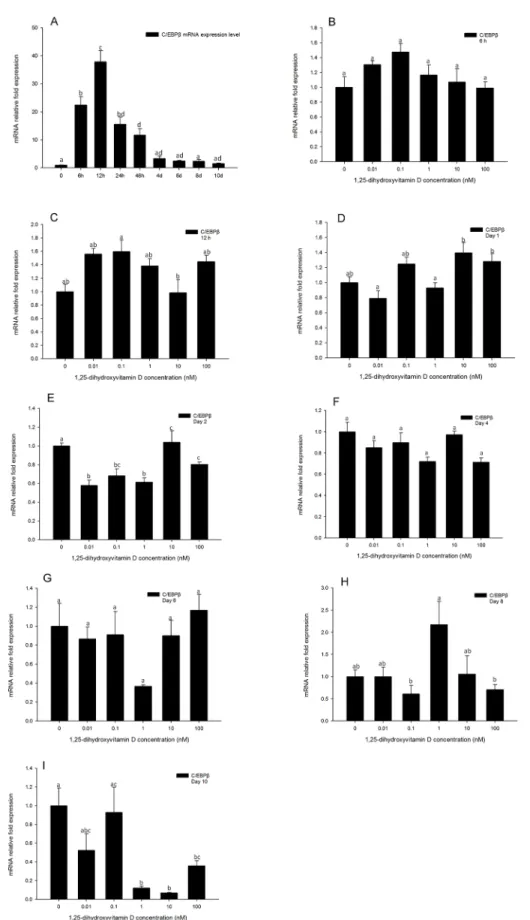
Gene expression levels ofC/EBPβin the positive control (Fig 7A) were increased after 6 h, and reached the highest expression level at 12 h, then decreased after day 2. Gene expression ofC/ EBPβwas determined at 6, 12, 24 h and days 2, 4, 6, 8 10 by real-time PCR. UnlikePPARγand
C/EBPα,C/EBPβgene expression level was not impacted by 1, 25 - (OH)2D3compared to DM
only group at any time points tested, up to day 10 (Fig 7B–7H), suggesting that 1, 25 - (OH)2D3
has no effect onC/EBPβgene expression levels. However, at day 10, the high concentrations (100, 10, and 1 nM) of 1, 25 - (OH)2D3showed inhibitory effects onC/EBPβgene expression
(Fig 7I). On day 10, the expression level ofC/EBPβwas very low (Fig 7A). Despite its low expres-sion level, 1, 25 - (OH)2D3had a suppressive effect on C/EBPβexpression at this time point.
C/EBP
δ
gene expression was not changed in response to 1, 25
-(OH)
2D
3treatments
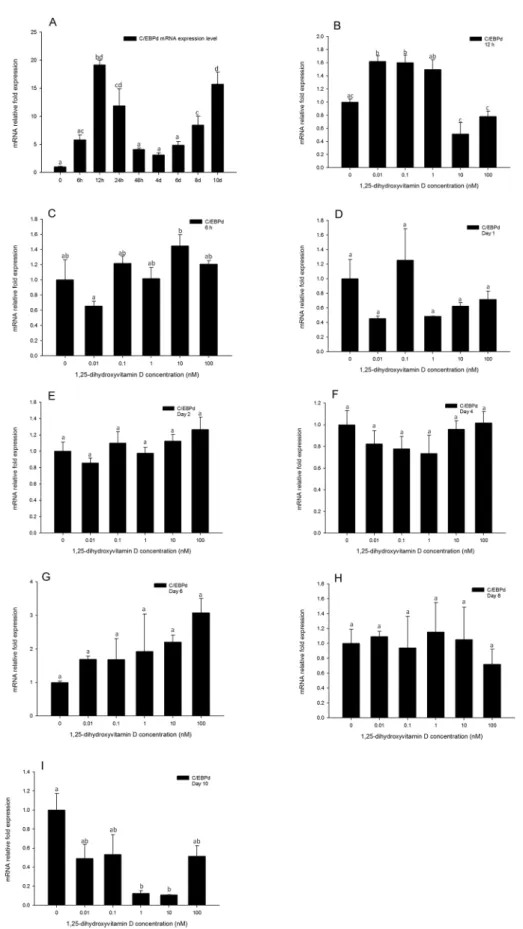
This member of the C/EBP family of transcription factors is induced in the early process of adi-pogenesis. Thus we quantified its gene expression levels at 6, 12, and 24 h, and continued to monitor its expression through days 2, 4, 6, 8, and 10. Similarly toC/EBPβ,C/EBPδgene ex-pression levels of 1, 25 - (OH)2D3treated cells were generally not inhibited compared to the
DM only treated group (Fig 8B–8I), even at the highest concentration of 1, 25 - (OH)2D3. This
suggests that the inhibitory efficacy of 1, 25 - (OH)2D3in adipogenesis does not impact the
ex-pression ofC/EBPδ. Analysis of C/EBPδgene expression in the positive control during adipo-cyte differentiation indicated that it is increased after 6 h, reaching the highest point at 12 h, and then decreases after 24 h (Fig 8A). Interestingly, the expression level ofC/EBPδwas again increased after day 8, and reached a similar high expression level compared to 12 h on day 10 (Fig 8A). This suggests that theC/EBPδgene may not only be induced and have a role in the early process of adipogenesis, but may also have a role in the latter stages of adipogenesis. internal protein loading control. Quantification of PPARγnormalized toβ-actin is shown. Data are means±SE (n = 3). Different letters represent treatment effects that were significantly different (P<0.05).
Fig 3. Real-time PCR quantification ofPPARγgene expression in 3T3-L1 cells on days 2 (A), 4 (B), 6 (C), 8 (D) and 10 (E).Cells were treated with DM in the presence or absence of 0.01, 0.1, 1, 10, and 100 nM 1, 25 - (OH)2D3andEEF2was used as endogenous control (∆Ct). Data were normalized toPPARγ
gene expression of the positive control (DM) at the corresponding time point (∆∆Ct). Data are means±SE (n = 3). Different letters represent treatment effects that were significantly different (P<0.05).
Fig 4. (A) Real-time PCR quantification ofC/EBPαgene expression in DM treatment of 3T3-L1 cells on days 0, 2, 4, 6, 8, and 10 withEEF2used as endogenous control (∆Ct).Data were normalized toC/EBPα
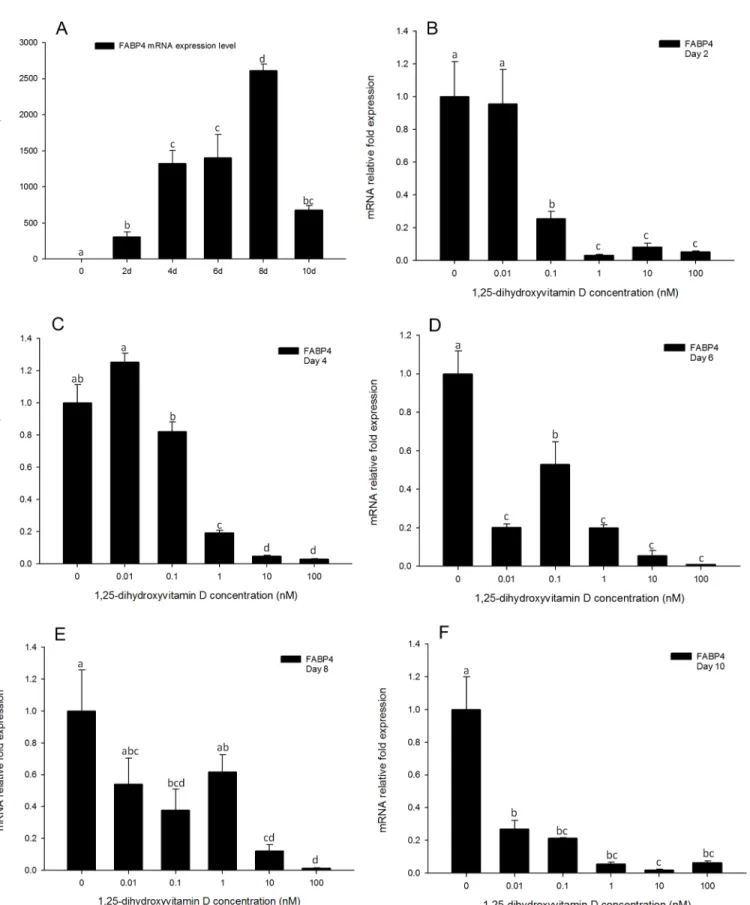
Gene expression of FABP4 is highly responsive to 1, 25 - (OH)
2D
3treatments
In the positive control treatments, the expression pattern ofFABP4was similar to that of
PPARγ, increasing after day 2, and reaching the highest expression levels on day 8 but declining to similar levels to day 6 by day 10 (Fig 9F). Gene expression ofFABP4was strongly inhibited by high concentrations (100, 10, and 1 nM) of 1, 25 - (OH)2D3treatments at all the time points
(Fig 9). Moreover, unlikePPARγandC/EBPαexpression levels,FABP4gene expression levels in response to 0.1 nM 1, 25 - (OH)2D3were also significantly inhibited compared to the
posi-tive control at all time-points (Fig 9). The lowest concentration of 1, 25 - (OH)2D3(0.01nM)
treatments had no effect onFABP4gene expression on days 2 and 4 compared to the DM only group (Fig 9B and 9C). However, on day 6, even the lowest concentration of 1, 25 - (OH)2D3
showed an inhibitory effect onFABP4gene expression (Fig 9D). These effects were attenuated on days 8 and 10 (Fig 9E and 9F).
Patterns of SREBP-1c expression resembled those of C/EBP
β
and C/
EBP
δ
expression, but was fleetingly inhibited on day 2
The expression pattern ofSREBP-1cin adipocyte differentiation showed that it was induced to the maximum expression level on day 2, and then decreased quickly from days 4 to 10 (Fig 10A). Interestingly, on day 2, cells treated with 1, 25 - (OH)2D3(all concentrations tested, 100,
10, 1, 0.1 and 0.01 nM) showed significant inhibition ofSREBP-1cgene expression as compared to the positive control (Fig 10B). However, this effect was rapidly attenuated. Similarly toC/ EBPβandC/EBPδ,SREBP-1cgene expression levels of 1, 25 - (OH)2D3treated cells were
gener-ally not different from the positive control from days 4 to 10 (Fig 10C–10F). The inhibitory ef-fect of 1, 25 - (OH)2D3on day 2 coincides with the time point of maximumSREBP-1c
expression (Fig 10A), suggesting that 1, 25 - (OH)2D3only has an effect whenSREBP-1c
reached a high expression level. These results suggest thatSREBP-1cmay also play an impor-tant role in the 1, 25 - (OH)2D3modulation pathway, and may have interaction with 1, 25
-(OH)2D3during the early stages of adipogenesis.
The inhibitory effect of 1, 25 - (OH)
2D
3on SCD-1 gene expression levels
was more gradual compared to PPAR
γ
, C/EBP
α
or FABP4 expression
For the positive control, the expression pattern ofSCD-1in adipocyte differentiation process was similar to that ofPPARγandC/EBPα. Expression ofSCD-1was increased on day 2, and reached a maximum expression level on day 8, remaining relatively high on day 10 (Fig 11A). The inhibition ofSCD-1gene expression was induced by all concentrations of 1, 25 - (OH)2D3
on day 2 (Fig 11B). However, its inhibitory effect at latter time points was more pronounced (Fig 11C–11F). Expression ofSCD-1was inhibited by high concentrations (100, 10 and 1 nM) of 1, 25 - (OH)2D3on day 4 (Fig 11C), showing a 70% inhibition effect at this time point. This
continued to day 6 (Fig 11D), and reached a inhibition effect greater than 90% of the positive control, in all of the three high concentrations of 1, 25 - (OH)2D3treatments. The efficacy of 1,
25 - (OH)2D3was stronger after day 6, and all the five concentrations of 1, 25 - (OH)2D3showed
significant inhibition on days 8 and 10 (Fig 11E and 11F). This suggestsSCD-1is strongly Imaging System (Li-Cor)) of C/EBPαon 0, 6, and 12 h, days 1, 2, 4, 6, 8 and 10.β-actin was used as an internal protein loading control. Quantification of C/EBPαwas normalized toβ-actin. Data are means±SE
(n = 3). Different letters represent treatment effects that were significantly different (P<0.05). doi:10.1371/journal.pone.0126142.g004
Fig 6. Real-time PCR quantification ofVDRgene expression in 3T3-L1 cells (A): in the positive control treatment (DM) at 0, 6, and 12 h, and days 1, 2, 4, 6, 8, and 10. (B to I).Cells were treated with DM in the presence or absence of 0.01, 0.1, 1, 10, and 100 nM 1, 25 - (OH)2D3andEEF2was used as endogenous control (∆Ct). Data were normalized toVDRgene expression of the positive control (DM) at the corresponding time point (∆∆Ct). (B) 6 h, (C)
responsive to 1, 25 - (OH)2D3,and may play an important role in the pathway of 1, 25
-(OH)2D3regulation of adipogenesis.
Gene expression of Pref-1 was altered in early time-points in response
to high concentrations of 1, 25 - (OH)
2D
3In the positive control, the expression pattern ofPref-1as expected was decreased by day 2, and remained so through until day 10 (Fig 12A). Expression levels ofPref-1were not altered in any of the 1, 25 - (OH)2D3treated cells on day 2 (Fig 12B), values being similar to the positive
con-trol. Cells treated with high concentrations of 1, 25 - (OH)2D3(100, 10, and 1 nM) showed a
significant increase inPref-1gene expression levels from days 4 to 6 (Fig 12C and 12D), suggesting greater retention of the preadipocyte phenotype. By day 8, all effects from 1, 25 -(OH)2D3treatments appeared to be attenuated, although the inhibitory effect was at least
par-tially regenerated on day 10 (Fig 12E and 12F). This results suggest thatPref-1expression re-sponds to 1, 25 - (OH)2D3in the latter stages of adipocyte differentiation, and may also plays a
role in the pathways of 1, 25 - (OH)2D3inhibited adipogenesis.
Relative luciferase activity of C/EBP
α
promoter activity was not affected
by 1, 25 - (OH)
2D
3treatment
This study was conducted to investigateC/EBPαpromoter activity in response to transient ex-posure of cells for 0, 12, 24 and 48 h to 100 nM 1, 25 - (OH)2D3plus differentiation medium,
differentiation medium only, and growth medium only. The data obtained with 1, 25 -(OH)2D3treatment indicated no changeC/EBPαpromoter activity at any time points, 12, 24
and 48 h, compared to differentiation medium, suggesting no effects of 1, 25 - (OH)2D3onC/
EBPαpromoter activity (Fig 13). The promoter activities ofC/EBPαfrom cells treated with both differentiation medium and differentiation medium plus 1, 25 - (OH)2D3were
signifi-cantly higher than growth medium alone (Fig 13), suggesting that theC/EBPαpromoter is stimulated within the first 48 h of adipocyte differentiation.
Discussion
Although the inhibitory effect of 1, 25 - (OH)2D3in adipogenesis has been reported for more
than a decade, the molecular mechanisms underlying this inhibition remains unclear. To ex-plore this important question, we have performed a systematic investigation aimed at studying the molecular events during the adipocyte differentiation response to 1, 25 - (OH)2D3. The
3T3-L1 cell line is a major model used in developing understanding of adipocyte differentiation and key adipogenic gene expression. Our strategy was to take advantage of this well-defined adipogenic model and identify the molecular changes at each stage that resulted from 1, 25 -(OH)2D3treatments. We report here that lipid accumulation and expression levels of
adipogenic specific genes were inhibited in vitro by high concentrations (1, 10 and 100 nM) of 1, 25 -(OH)2D3but not by lower concentrations (0.1 and 0.01 nM). As discussed in greater detail
below, lipid accumulation was inhibited by the high concentrations of 1, 25 - (OH)2D3, at levels
comparable to the negative control, by day 10. The lower concentrations of 1, 25 - (OH)2D3
have slight inhibitory effects on lipid accumulation compared to the positive control. Gene ex-pression levels ofPPARγ,C/EBPα,VDR,FABP4andSCD-1were inhibited by the high concen-trations of 1, 25 - (OH)2D3throughout the experimental period to day 10. However, the lower
12 h, (D) day 1, (E) day 2, (F) day 4 (G) day 6, (H) day 8 and (I) day 10. Data are means±SE (n = 3). Different letters represent treatment effects that were
significantly different (P<0.05).
Fig 7. Real-time PCR quantification ofC/EBPβgene expression in 3T3-L1 cells (A): in the positive control treatment (DM) at 0, 6, and 12 h, and days 1, 2, 4, 6, 8, and 10. (B to I).Cells were treated with DM
concentrations of 1, 25 - (OH)2D3had no inhibitory effect. Gene expression levels ofC/EBPβ
andC/EBPδwere not affected by 1, 25 - (OH)2D3treatments, at any of the concentrations
test-ed. We also studied the effects of 1, 25 - (OH)2D3onC/EBPαpromoter activity. There
ap-peared to be no inhibitory effect of 1, 25 - (OH)2D3on the activity of theC/EBPαpromoter.
The present study has also provided a detailed temporal analysis of key adipogenic gene expres-sion across time points from days 0 to 10 during the adipocyte differentiation process. These data demonstrate at least three important observations: 1) high concentrations of 1, 25 -(OH)2D3have strongly inhibitory effects on adipogenesis, and this effects persist through
day10, 2) not all of the key adipogenic genes (e.g.C /EBPβandC/EBPδ) interact with 1, 25 -(OH)2D3, and 3) the pathway of 1, 25 - (OH)2D3mediated inhibition of adipogenesis does not
appear to involve theC/EBPαpromoter.
1, 25-Dihydroxyvitamin D3is an endocrine hormone that plays multiple physiological roles
[21]. This secosteroid hormone is known to be critical for immune system function [22] and calcium and phosphate homeostasis[23,24]. 1, 25-Dihydroxyvitamin D3is also known to affect
adipocyte differentiation and metabolism [25]. 1, 25-Dihydroxyvitamin D3is also the ligand of
VDR, hence, VDR may play an important part in the inhibitory pathway of 1, 25 - (OH)2D3in
adipogenesis. The VDR has previously been reported to play an important role in the vitamin D signaling pathway in health and disease[25]. Kong and Li [26] found that VDR protein ex-pression was very low in mouse 3T3-L1 preadipocytes, however, VDR exex-pression increased dramatically by 4 h following treatment with adipogenic differentiation medium, and returned to baseline levels by day 2. 1, 25-Dihydroxyvitamin D3treatment was able to stabilize VDR
ex-pression for at least another day. The mechanism of VDR stabilization by 1, 25 - (OH)2D3is
currently not known. However, the observation of VDR expression in the early time points of adipogenesis may provide a short window for 1, 25 - (OH)2D3to inhibit adipogenesis[13]. The
role of the VDR in pre-adipocyte differentiation in 3T3-L1 cells was also studied by Blumberg et al[15]. Their studies reported that the mRNA levels of VDR increased to a maximum by 6 h following initiation of adipocyte differentiation, and the protein levels of VDR reached a maxi-mum by 12 h in the nucleus, and then declined to baseline level by day 2. These similar reports suggest that the inhibition of adipogenesis by 1, 25 - (OH)2D3binding VDR may occur in the
early time points (before day 2) during adipogenesis, however, the specific mechanism still re-mains unknown. In our studies,VDRgene expression pattern in adipocyte differentiation was measured from 0 h to day 10. The expression ofVDRwas induced after adipocyte differentia-tion was initiated (6 h), and reached the maximum expression level at 12 h, then declined after 24 h, which is consistent with previous literature reports. In addition,VDRgene expression was inhibited by 1, 25 - (OH)2D3treatments at early time points. We report the novel finding
that the interaction between 1, 25 - (OH)2D3and its receptor leads to inhibition of
down-stream expression of adipogenic-specific genes. This suggests thatVDRplays an important role in the inhibitory pathway of 1, 25 - (OH)2D3regulating adipocyte differentiation.
The C/EBP family is a class of basic-leucine zipper transcription factors, and does not form homo-or hetero dimers. Furthermore, their tissue distribution is not limited to adipose tissue [27]. The gene expression of severalC/EBPfamily members is known to be regulated during adipogenesis, and they have been shown to be regulators of adipocyte differentiation. BothC/ EBPβandC/EBPδmRNA and protein levels were reported to rise early and transiently in in the presence or absence of 0.01, 0.1, 1, 10, and 100 nM 1, 25 - (OH)2D3andEEF2was used as
endogenous control (∆Ct). Data were normalized toC/EBPβgene expression of the positive control (DM) at the corresponding time point (∆∆Ct). (B) 6 h, (C) 12 h, (D) day 1, (E) day 2, (F) day 4 (G) day 6, (H) day 8 and (I) day 10. Data are means±SE (n = 3). Different letters represent treatment effects that were significantly different (P<0.05).
Fig 8. Real-time PCR quantification ofC/EBPδgene expression in 3T3-L1 cells (A): in the positive control treatment (DM) at 0, 6, and 12 h, and days 1, 2, 4, 6, 8, and 10. (B to I).Cells were treated with DM
preadipocytes which have been induced to differentiate [28–30]. In the present study, real-time PCR results confirmed that during adipogenesis,C/EBPβmRNA expression levels began to rise by 6 h, and reached a maximum by 12 h following induction, then declined to baseline level after 24 h (Fig 7A). The mRNA expression levels ofC/EBPδalso increased by 6 h, and reached the highest level at 12 h, then decreased after 24 h (Fig 8A). These results are consistent with previous reports, and the timing of expression of these two genes was similar to VDR, sug-gesting that there may be an interaction between 1, 25 - (OH)2D3through VDR binding,
inhib-iting adipogenesis andC/EBPβorC/EBPδexpression during early adipogenesis. Blumberg et al [15] reported that 1, 25 - (OH)2D3treatment inhibitedC/EBPβmRNA expression level,
how-ever,C/EBPδgene expression did not change in response to 1, 25 - (OH)2D3. Their studies
in-dicate that after binding with VDR, 1, 25 - (OH)2D3inhibits adipogenesis via inhibitingC/
EBPβgene expression but notC/EBPδ. In contrast, Kong and Li [26] reported that 1, 25 -(OH)2D3treatments did not influence the gene expression of eitherC/EBPβorC/EBPδ[27]. In
the present study, we quantified gene expression levels of bothC/EBPβandC/EBPδin response to 1, 25 - (OH)2D3treatment, and our results are similar to those reported by Kong and Li[26].
From 6 h to 24 h, and days 2 to 10, gene expression levels ofC/EBPβandC/EBPδwere not changed by 1, 25 - (OH)2D3treatments. These data demonstrate that even though the gene
ex-pression of these C/EBP family members is stimulated in early adipogenesis, corresponding to the maximum expression time of VDR, these two factors are not included in the pathway of 1, 25 - (OH)2D3inhibited adipogenesis.
ThePPARfamily is a group of transcriptional factors belonging to the nuclear hormone re-ceptor superfamily. These transcriptional factors heterodimerize with another nuclear hor-mone receptor, retinoid X receptor (RXR), bind to the response elements of target gene promoters and function as active transcriptional factors[31]. When PPARs are heterodimer-ized with RXR, the complex is activated and transported to the nucleus to bind to specific se-quences in promoter regions (termed asPPARresponse elements, PPREs) of downstream target genes, activating their transcription[6,32]. There are three major isoforms:PPARα,
PPARδ, andPPARγ[28]. The three isoforms have specific roles in lipid metabolism. Impor-tantly,PPARγplays an important role in triglyceride synthesis and adipocyte differentiation [32]. Activation ofPPARγexpression occurs downstream ofC/EBPβandC/EBPδtranscription during the cascade of adipogenesis, and upstream ofC/EBPα. In the present study, gene expres-sion ofPPARγwas highly inhibited by 1, 25 - (OH)2D3, from day 2 until day 10 (Fig 3).
More-over, the cellular response ofC/EBPαto 1, 25 - (OH)2D3was similar to that ofPPARγ. The
inhibition of 1, 25 - (OH)2D3was persistent until day 10 (Fig 5). These data indicate that the 1,
25 - (OH)2D3induced inhibition of adipogenesis in 3T3-L1 cells was associated with an
inhibi-tion ofPPARγandC/EBPαgene expression.
To confirm these results, the protein levels of both PPARγand C/EBPαwere measured using Western blot. Interestingly, the whole cell lysate from 1, 25 - (OH)2D3plus DM treated
cells had the highest PPARγprotein level from 6 h to day 4, and the whole cell lysate from DM only treated cells had lower PPARγlevels than the 1, 25 - (OH)2D3treated cells, but
compara-ble to growth medium treated cells. By day 6, the 1, 25 - (OH)2D3plus DM treated cells and
DM only treated cells had similar levels of PPARγprotein, however, by day 10, DM only treat-ed cells had the highest PPARγprotein level, and PPARγprotein level from 1, 25 - (OH)2D3
in the presence or absence of 0.01, 0.1, 1, 10, and 100 nM 1, 25 - (OH)2D3andEEF2was used as
endogenous control (∆Ct). Data were normalized toC/EBPδgene expression of the positive control (DM) at the corresponding time point (∆∆Ct). (B) 6 h, (C) 12 h, (D) day 1, (E) day 2, (F) day 4 (G) day 6, (H) day 8 and (I) day 10. Data are means±SE (n = 3). Different letters represent treatment effects that were significantly different (P<0.05).
Fig 9. Real-time PCR quantification ofFABP4gene expression in 3T3-L1 cells (A): in the positive control treatment (DM) on days 0, 1, 2, 4, 6, 8, and 10 (B to F).Cells were treated with DM in the presence or absence of 0.01, 0.1, 1, 10, and 100 nM 1, 25 - (OH)2D3andEEF2was used as endogenous control (∆Ct). Data were normalized toFABP4gene expression of the positive control (DM) at the corresponding time point (∆∆Ct). (B) day 2, (C) day 4 (D) day 6, (E) day 8 and (F) day 10. Data are means±SE (n = 3). Different letters represent treatment effects that were significantly different (P<0.05).
Fig 11. Real-time PCR quantification ofSCD-1gene expression in 3T3-L1 cells (A): in the positive control treatment (DM) on days 0, 1, 2, 4, 6, 8, and 10 (B to F).Cells were treated with DM in the presence or absence of 0.01, 0.1, 1, 10, and 100 nM 1, 25 - (OH)2D3andEEF2was used as endogenous control (∆Ct). Data were normalized toSCD-1gene expression of the positive control (DM) at the corresponding time point (∆∆Ct). (B) day 2, (C) day 4 (D) day 6, (E) day 8 and (F) day 10. Data are means±SE (n = 3). Different letters represent treatment effects that were significantly different (P<0.05). doi:10.1371/journal.pone.0126142.g011
plus DM treated cells was decreased to the same level as growth medium only treated cells (S1 Fig). Protein levels of C/EBPαin the whole cell lysate were not changed in response to 1, 25 -(OH)2D3treatments on any of the time points in comparison to DM only treated cells (S2 Fig),
suggesting that C/EBPαprotein was not influenced by 1, 25 - (OH)2D3treatments. In previous
studies by Blumberg et al[15], they reported the protein level of PPARγand C/EBPαwas inhib-ited by 1, 25 - (OH)2D3treatments. However, these authors used the nuclear extracts to
mea-sure the protein level of these two transcriptional factors. In the present study, we used the whole cell lysate to measure the protein levels. These observations together suggest that regula-tion of PPARγeffects are not directly mediated at transcriptional or translational levels. Rather, mediation occurs via regulation of PPARγactivation and transport to the nucleus. Thus, we hy-pothesize that 1, 25 - (OH)2D3treatments block the trafficking of PPARγfrom the cytoplasm
to the nucleus. Thus, PPARγprotein is not transferred into nucleus preventing activation of downstream target genes in adipogenesis. In contrast, without 1, 25 - (OH)2D3treatment, the
PPARγprotein in the DM only treated cells was readily transported into the nucleus, and func-tioned as transcriptional factor, inducing the downstream genes (e.g.C/EBPα,FABP4). There-fore, the protein level of PPARγin DM only treated cells was lower compared to 1, 25 -(OH)2D3treated cells. The protein levels of PPARγand C/EBPαin DM only treated cells were
measured from 0, 6, and 12 h to days 1, 2, 4, 6, 8, and 10. The protein levels of PPARγwere con-sistent with mRNA expression levels quantified by real-time PCR. Interestingly, unlike PPARγ,
Fig 13. Mouse 3T3-L1 cells were transfected with pGL4.10 (luc2/-500CEBPa) in triplicate.Following incubation with differentiation medium only, growth medium only, or differentiation medium with 1, 25(OH)2D3(100nM). Fire-fly and Renilla luciferase activity units were measured at 0, 12, 24 and 48 h. The firefly luciferase activity units were normalized to Renilla luciferase activity units. Data are normalized as fold activation relative to 0 h and shown as means±SE (n = 3). Different letters represent treatment effects that were significantly different (P<0.05) within each time-point.
doi:10.1371/journal.pone.0126142.g013
the protein levels of C/EBPαwere only slightly changed throughout the experimental time points. We hypothesize that this may be because the C/EBPαprotein has longer half-life than PPARγor is accumulated in the cytoplasm before adipogenesis is initiated. The activity of the
C/EBPαpromoter was also measured using the Dual Reporter Luciferase Assay System (Pro-mega, Madison, WI). Relative luciferase activity data showed that the activity ofC/EBPα pro-moter appeared to be unchanged in response to 1, 25 - (OH)2D3treatments. These intriguing
data demonstrate that 1, 25 - (OH)2D3treatments inhibit adipogenesis via inhibitingPPARγ
andC/EBPαgene expression, and thatPPARγmay play a more important role in this pathway in comparison toC/EBPα. Further studies are needed to explore the mechanism ofPPARγ in-teraction with 1, 25 - (OH)2D3in its inhibition of adipogenesis.
In the present study,SREBP-1cgene expression was only inhibited by 1, 25 - (OH)2D3
ments on day 2, coinciding with its maximum expression level in the positive control treatment. Both the high (100, 10, and 1 nM) and low (0.1 and 0.01 nM) concentrations of 1, 25 -(OH)2D3inhibitedSREBP-1cgene expression on day 2 (Fig 10B). However, from days 4 to 10,
the inhibitory effects were ameliorated, and the expression ofSREBP-1cwas not changed in re-sponse to 1, 25 - (OH)2D3treatments, at any of the concentrations tested (Fig 10C–10F). These
data indicate that the inhibition ofSREBP-1cgene expression by 1, 25 - (OH)2D3treatment
was transient and corresponded with the d 2 time point, in which its expression rose, 10-fold in the positive control in comparison to the time-point at d 0. Thus, it is not clear whether
SREBP-1cmay be involved in the 1, 25 - (OH)2D3signaling pathway that inhibits adipogenesis,
showing a similar gene expression profile toC/EBPβand also reflecting the profile observed for
C/EBPδat time-points up to d 6. These three genes are upstream ofPPARγin the transcriptional activation of adipogenesis, hence, the inhibition of adipogenesis caused by 1, 25 -(OH)2D3may be unrelated to mechanisms involving the transcriptional factors that are
ex-pressed in the early stages of adipogenesis.
In additional toPPARγandC/EBPα, gene expression levels ofFABP4andSCD-1were strongly inhibited by 1, 25 - (OH)2D3treatments. Gene expression ofFABP4was strongly
in-hibited by the high concentrations (100, 10 and 1 nM) of 1, 25 - (OH)2D3treatments from
days 2 to 4 (Fig 9B and 9C). Moreover, from days 6 to 10, all the concentrations of 1, 25 -(OH)2D3had significant inhibitory effects onFABP4gene expression (Fig 9D–9F). The
inhibi-tory effects of 1, 25 - (OH)2D3treatments onSCD-1gene expression were gradual in
compari-son to effects onFABP4expression. Inhibition by high concentrations of 1, 25 - (OH)2D3
began by day 4 (Fig 10C), and remained until day 8 (Fig 11D and 11E). However, by day 10, gene expression ofSCD-1was inhibited by all concentrations of 1, 25 - (OH)2D3tested (Fig
11F), and comparable to effects onFABP4. In previous reports,FABP4has been shown to have aPPARγresponse element (PPRE) in its promoter region andPPARγregulates gene expression ofFABP4[32]. In 1, 25 - (OH)2D3treated cells,PPARγexpression was significantly inhibited,
and this effect also appeared to cause a negative action on gene expression ofFABP4. Similarly toFABP4,SCD-1also plays an important role in adipogenesis. Its functions include incorpo-ration of double bonds in fatty acids and synthesis of long chain fatty acids in adipocytes[32]. In the present study,SCD-1expression was gradually increased from days 2 to 10 with DM treatment, and significantly inhibited by 1, 25 - (OH)2D3treatments, suggesting thatSCD-1
may play a role in the pathway of 1, 25 - (OH)2D3inhibited adipogenesis. Mechanisms of
FABP4andSCD-1gene expression in response to 1, 25 - (OH)2D3still need to be explored
further.
Preadipocyte factor 1 is a marker protein of preadipocytes and is not expressed in mature adipocytes[33]. During initiation of adipogenesis, the gene expression of Pref-1 decreases and the expression of key adipogenic genes increases[34]. We hypothesized that gene expression of
levels in treatments with 1, 25 - (OH)2D3when compared to in DM treated cells. In the present
study,Pref-1gene expression was significantly lower compared to that of day 4, DM only treat-ed cells, and remaintreat-ed at low levels through day 10 (Fig 12A). In the cells treated with 1, 25 -(OH)2D3,Pref-1gene expression was significantly higher than in DM only treated cells by day
6 (Fig 12B–12F), and declined to similar levels to the DM only group from days 8 to 10 (Fig 12E and 12F). These data support our hypothesis, and in the 1, 25 - (OH)2D3treatments where
PPARγ,C/EBPα,FABP4andSCD-1gene expression levels were inhibited, the expression of
Pref-1gene correspondingly remained significantly higher than in DM only treatments. In conclusion, lipid accumulation and the expression of key adipogenic key genes,PPARγ,
C/EBPα,FABP4, andSCD-1were significantly inhibited by 1, 25 - (OH)2D3treatments until
day 10. Gene expression ofSREBP-1cwas transiently inhibited by 1, 25 - (OH)2D3on day 2,
and then rebounded back to levels similar to the low levels observed in DM treatment by days 4, 6, 8, and 10. In contrast,C/EBPβandC/EBPδexpression were not changed in response to 1, 25 - (OH)2D3treatments. Our study has demonstrated that 1, 25 - (OH)2D3represses
adipo-genesis via inhibition of the expression ofPPARγ, but notC/EBPβorC/EBPδ, and hence, the adipogenic-specific genes (C/EBPα,FABP4, andSCD-1) downstream ofPPARγduring the transcriptional cascade of adipogenesis, were also inhibited. In future, studies are needed to explore the mechanisms by which 1, 25 - (OH)2D3interacts withPPARγand regulates
adipogenesis.
Supporting Information
S1 Fig. Representative images showing Western blot analysis (Odyssey Dual Infrared Imag-ing System (Li-Cor)) of PPARγon 6 h (A), 12 h (B), days 1 (C), 2 (D), 4 (E), 6 (F), 8 (G) and
10 (H).Cells were treated with differentiation medium in the presence or absence of 100 and 1 nM 1, 25 - (OH)2D3, and basal growth medium.β-actin was used as an internal protein
load-ing control. Quantification of PPARγnormalized toβ-actin. Comparisons are with blank with-in day. Data are means ± SE (n = 3).
(DOCX)
S2 Fig. Representative images showing Western blot analysis (Odyssey Dual Infrared Imag-ing System (Li-Cor)) of C/EBPαon 6 h (A), 12 h (B), days 1 (C), 2 (D), 4 (E), 6 (F), 8 (G)
and 10 (H).Cells were treated with differentiation medium in the presence or absence of 100 and 1 nM 1, 25 - (OH)2D3, and basal growth medium.β-actin was used as an internal protein
loading control. Quantification of PPARγnormalized toβ-actin. Comparisons are with blank within day. Data are means ± SE (n = 3).
(DOCX)
Acknowledgments
We thank Ann Norton of the Optical Imaging Center at the University of Idaho for assistance with the ORO image capture and analysis.
Author Contributions
Conceived and designed the experiments: SJ MED RAH. Performed the experiments: SJ RAH. Analyzed the data: SJ RAH. Contributed reagents/materials/analysis tools: RAH. Wrote the paper: SJ MED RAH.
References
1. Hirsch J, Batchelor B (1976) Adipose tissue cellularity in human obesity. Clin Endocrinol Metab 5: 299–311. PMID:1085232
2. Cheguru P, Chapalamadugu KC, Doumit ME, Murdoch GK, Hill RA (2012) Adipocyte differentiation-specific gene transcriptional response to C18 unsaturated fatty acids plus insulin. Pflugers Archiv-Euro-pean Journal of Physiology 463: 429–447. doi:10.1007/s00424-011-1066-7PMID:22218833
3. Rosen ED, Spiegelman BM (2000) Molecular regulation of adipogenesis. Annu Rev Cell Dev Biol 16: 145–171. PMID:11031233
4. Rosen ED, Hsu CH, Wang X, Sakai S, Freeman MW, Gonzalez FJ, et al. (2002) C/EBPalpha induces adipogenesis through PPARgamma: a unified pathway. Genes Dev 16: 22–26. PMID:11782441
5. Gregoire FM, Smas CM, Sul HS (1998) Understanding adipocyte differentiation. Physiol Rev 78: 783– 809. PMID:9674695
6. Rosen ED, Walkey CJ, Puigserver P, Spiegelman BM (2000) Transcriptional regulation of adipogen-esis. Genes Dev 14: 1293–1307. PMID:10837022
7. Brown MS, Goldstein JL (1997) The SREBP pathway: regulation of cholesterol metabolism by proteoly-sis of a membrane-bound transcription factor. Cell 89: 331–340. PMID:9150132
8. Kim JB, Sarraf P, Wright M, Yao KM, Mueller E, Solanes G, et al. (1998) Nutritional and Insulin Regula-tion of Fatty Acid Synthetase and Leptin Gene Expression through ADD1/SREBP1. J Clin Invest 101: 1–9. PMID:9421459
9. Kim JB, Spiegelman BM (1996) ADD1/SREBP1 promotes adipocyte differentiation and gene expres-sion linked to fatty acid metabolism. Genes Dev 10: 1096–1107. PMID:8654925
10. Fajas L, Schoonjans K, Gelman L, Kim JB, Najib J, Martin G, et al. (1999) Regulation of peroxisome proliferator-activated receptor gamma expression by adipocyte differentiation and determination factor 1/sterol regulatory element binding protein 1: implications for adipocyte differentiation and metabolism. Mol Cell Biol 19: 5495–5503. PMID:10409739
11. Matsuo T, Matsuo M, Kasai M, Takeuchi H (2001) Effects of a liquid diet supplement containing struc-tured medium- and long-chain triacylglycerols on bodyfat accumulation in healthy young subjects. Asia Pac J Clin Nutr 10: 46–50. PMID:11708608
12. Martini LA, Wood RJ (2006) Vitamin D status and the metabolic syndrome. Nutr Rev 64: 479–486. PMID:17131943
13. Wood RJ (2008) Vitamin D and adipogenesis: new molecular insights. Nutr Rev 66: 40–46. doi:10. 1111/j.1753-4887.2007.00004.xPMID:18254883
14. Hida Y, Kawada T, Kayahashi S, Ishihara T, Fushiki T (1998) Counteraction of retinoic acid and 1,25-dihydroxyvitamin D3 on up-regulation of adipocyte differentiation with PPARgamma ligand, an antidia-betic thiazolidinedione, in 3T3-L1 cells. Life Sci 62: PL205–211. PMID:9570344
15. Blumberg JM, Tzameli I, Astapova I, Lam FS, Flier JS, Hollenberg AN (2006) Complex role of the vita-min D receptor and its ligand in adipogenesis in 3T3-L1 cells. J Biol Chem 281: 11205–11213. PMID: 16467308
16. Sato M, Hiragun A (1988) Demonstration of 1 alpha,25-dihydroxyvitamin D3 receptor-like molecule in ST 13 and 3T3 L1 preadipocytes and its inhibitory effects on preadipocyte differentiation. J Cell Physiol 135: 545–550. PMID:2840436
17. Kamei Y, Kawada T, Kazuki R, Ono T, Kato S, Sugimoto E, et al. (1993) Vitamin D receptor gene ex-pression is up-regulated by 1, 25-dihydroxyvitamin D3 in 3T3-L1 preadipocytes. Biochem Biophys Res Commun 193: 948–955. PMID:7686756
18. Kelly KA, Gimble JM (1998) 1,25-Dihydroxy vitamin D3 inhibits adipocyte differentiation and gene ex-pression in murine bone marrow stromal cell clones and primary cultures. Endocrinology 139: 2622– 2628. PMID:9564879
19. Ramirezzacarias JL, Castromunozledo F, Kuriharcuch W (1992) Quantitation of Adipose Conversion and Triglycerides by Staining Intracytoplasmic Lipids with Oil Red-O. Histochemistry 97: 493–497. PMID:1385366
20. Pfaffl MW (2001) A new mathematical model for relative quantification in real-time RT-PCR. Nucleic Acids Research 29: e45. PMID:11328886
21. Sutton AL, MacDonald PN (2003) Vitamin D: more than a "bone-a-fide" hormone. Mol Endocrinol 17: 777–791. PMID:12637589
23. Li YC, Pirro AE, Amling M, Delling G, Baron R, Bronson R, et al. (1997) Targeted ablation of the vitamin D receptor: an animal model of vitamin D-dependent rickets type II with alopecia. Proc Natl Acad Sci U S A 94: 9831–9835. PMID:9275211
24. Yoshizawa T, Handa Y, Uematsu Y, Takeda S, Sekine K, Yoshihara Y, et al. (1997) Mice lacking the vi-tamin D receptor exhibit impaired bone formation, uterine hypoplasia and growth retardation after weaning. Nat Genet 16: 391–396. PMID:9241280
25. Jones G, Strugnell SA, DeLuca HF (1998) Current understanding of the molecular actions of vitamin D. Physiol Rev 78: 1193–1231. PMID:9790574
26. Kong J, Li YC (2006) Molecular mechanism of 1,25-dihydroxyvitamin D3 inhibition of adipogenesis in 3T3-L1 cells. Am J Physiol Endocrinol Metab 290: E916–924. PMID:16368784
27. Lekstrom-Himes J, Xanthopoulos KG (1998) Biological role of the CCAAT/enhancer-binding protein family of transcription factors. J Biol Chem 273: 28545–28548. PMID:9786841
28. Cao Z, Umek RM, McKnight SL (1991) Regulated expression of three C/EBP isoforms during adipose conversion of 3T3-L1 cells. Genes Dev 5: 1538–1552. PMID:1840554
29. Darlington GJ, Ross SE, MacDougald OA (1998) The role of C/EBP genes in adipocyte differentiation. J Biol Chem 273: 30057–30060. PMID:9804754
30. Yeh WC, Cao Z, Classon M, McKnight SL (1995) Cascade regulation of terminal adipocyte differentia-tion by three members of the C/EBP family of leucine zipper proteins. Genes Dev 9: 168–181. PMID: 7531665
31. Laudet V, Hanni C, Coll J, Catzeflis F, Stehelin D (1992) Evolution of the nuclear receptor gene super-family. EMBO J 11: 1003–1013. PMID:1312460
32. Desvergne B, Michalik L, Wahli W (2006) Transcriptional Regulation of Metabolism. Physiol Rev 86: 465–514. PMID:16601267
33. Sul HS (2009) Minireview: Pref-1: role in adipogenesis and mesenchymal cell fate. Mol Endocrinol 23: 1717–1725. doi:10.1210/me.2009-0160PMID:19541743
34. Macdougald OA, Lane MD (1995) Transcriptional Regulation of Gene-Expression During Adipocyte Differentiation. Annual Review of Biochemistry 64: 345–373. PMID:7574486