of
Drosophila
Microchaetes
Eulalie Buffin1,2, Michel Gho1,2*
1Universite´ Pierre et Marie Curie-Paris 6, UMR 7622, Paris, France,2CNRS, UMR 7622, Paris, France
Abstract
Background:InDrosophila, each external sensory organ originates from the division of a unique precursor cell (the sensory organ precursor cell or SOP). Each SOP is specified from a cluster of equivalent cells, called a proneural cluster, all of them competent to become SOP. Although, it is well known how SOP cells are selected from proneural clusters, little is known about the downstream genes that are regulated during SOP fate specification.
Methodology/Principal Findings: In order to better understand the mechanism involved in the specification of these precursor cells, we combined laser microdissection, toisolate SOP cells, with transcriptome analysis, to study their RNA profile. Using this procedure, we found that genes that exhibit a 2-fold or greater expression in SOPs versus epithelial cells were mainly associated with Gene Ontology (GO) terms related with cell fate determination and sensory organ specification. Furthermore, we found that several genes such as pebbled/hindsight, scabrous, miranda, senseless, or cut, known to be expressed in SOP cells by independent procedures, are particularly detected in laser microdissected SOP cells rather than in epithelial cells.
Conclusions/Significance: These results confirm the feasibility and the specificity of our laser microdissection based procedure. We anticipate that this analysis will give new insight into the selection and specification of neural precursor cells.
Citation:Buffin E, Gho M (2010) Laser Microdissection of Sensory Organ Precursor Cells ofDrosophilaMicrochaetes. PLoS ONE 5(2): e9285. doi:10.1371/ journal.pone.0009285
Editor:Edward Giniger, National Institutes of Health (NIH), United States of America
ReceivedOctober 2, 2009;AcceptedJanuary 27, 2010;PublishedFebruary 19, 2010
Copyright:ß2010 Buffin, Gho. This is an open-access article distributed under the terms of the Creative Commons Attribution License, which permits unrestricted use, distribution, and reproduction in any medium, provided the original author and source are credited.
Funding:This work was supported by ARC (Grant 3291, www.arc.asso.fr), CNRS (www.cnrs.fr) and UPMC (www.UPMC.fr). E.B. was supported by a CNRS postdoctoral grant. The funders had no role in study design, data collection and analysis, decision to publish, or preparation of the manuscript.
Competing Interests:The authors have declared that no competing interests exist.
* E-mail: [email protected]
Introduction
InDrosophila, the small external sensory organs (microchaetes) located on the dorsal part of the thorax has become an excellent system to analyse mechanisms involved in the acquisition and maintenance of neural precursor cell identity from a non-differentiated state [1,2]. In this system, each sensory organ develops from a single SOP that arises from a cluster of equivalent cells called proneural cluster. Cells of a proneural cluster are defined by the expression of the proneural genesachaeteandscute (ac/sc)that provide them with the competence to become SOP [3,4]. In each cluster, the proneural competence is progressively restricted to only one cell that accumulates the highest level of proneural proteins and that will become the SOP whereas the others cells remain epithelial cells. This process of SOP selection depends on both the auto and cross regulation of proneural gene expression [4] and the activation of the Notch signalling pathway. This later involves cell-cell interactions mediated by the Notch receptor and it’s ligand Delta in such a way that in each cluster, one cell (the future SOP) will express higher level of the ligand Delta and will activate Notch receptors in neighbouring (future epithelial) cells [5,6]. Notch signalling promotes the transcription of Enhancer of split complex genes that repress proneural gene expression and prevents the acquisition of neural fate [4,7,8].
Despite considerable progress in our knowledge of the mechanisms underlying SOP selection, relatively few downstream target genes regulated by this proneural regulatory network are known. The gene senseless (sens), which encodes a zinc finger transcription factor, is one of the known downstream genes. Sens is expressed in SOPs and has been shown to act as a binary switch in the proneural cluster. High levels of Sens up regulate ac/sc
expression and, conversely, low levels repress ac/sc expression [8,9]. It is tempting to speculate that other Sens-like factors remain to be discovered.
that this technique can easily be extended to different epithelia and as such will be useful in investigating specific cell transcriptomes.
Materials and Methods
Fly Stocks
The neuralizedp72-Gal4 driver was used to express in pI cells the construction mCD8::GFP using the UAS/Gal4 system [10].
neur.mCD8::GFP flies were reared on a standardDrosophiladiet. White pupae were selected and maintained at 25uC prior dissection.
Fixation and Mounting
The notum fromneur.mCD8::GFP pupae were dissected out in PBS and fixed in cold absolute ethanol for 10 minutes. A fixation longer than 15 min, hardes the tissue and makes the microdissec-tion difficult. Three to five fixed nota were transferred directly from ethanol with a Pasteur pipette and then carefully flattened and dried with the epithelium facing down on a thermolabile membrane slides for laser microdissection (See Fig S1).
Laser Microdissection
Laser microdissection was realized on a MMI cellcut microdis-section system coupled to an Eclipse TE-2000 inverted fluorescent microscope (Nikon Instrument). The parameters used were: focus 40, speed 1, power 74 at objective 60X and 4 to 8 laser rounds were required to cut through a notum. Selected areas were cut from the tissue by an UV laser beam. To keep the SOP integrity and preserve RNA from the heat of the laser, we took care to leave a space between the laser circle and the cell limit (around 5mm).
RNA Extraction and Amplification
Total RNA was extracted from microdissected cells by using the picopure RNA isolation kit (Molecular devices - Arcturus) following manufactures instructions with minor modifications as described below. We incubated the tubes containing microdissect-ed cells with 20ml of extraction buffer at 42uC upside down for 30 min. Then, after centrifugation, the extracts pooled were passed through a single RNA purification column. During purification, we treated the column with DNAse I (Qiagen) for 30 min at room temperature to avoid genomic DNA contamina-tion. We obtained 0,1–0,5mg of total RNA from a sample of 1000 microdissected cells.
After extraction, RNA was amplified by using the MessageAmp II aRNA Amplification Kit (Ambion). We proceeded with two rounds (9 h each) ofin vitro transcription. After each round, the RNA purification column was treated by DNAse I (Qiagen) for 10 min at room temperature before aRNA elution. For better RNA integrity, we carried out all the amplification processes in one step directly after RNA extraction to avoid freezing the sample. Indeed, in addition to the usual recommendations about manipulating RNA, we avoided, as much as possible, freezing both the tissue before microdissection and the RNA samples between extraction and amplification. After two rounds of amplification, we obtained 20–50mg of aRNA from a sample of 1000 microdissected cells.
For microarray hybridizations, UTP-amino allyls were inte-grated during the second round of in vitro transcription, for subsequent labelling with dyes Cy3 or Cy5 (Amino Allyl MessageAmp II kit - Ambion).
qRT-PCR
We performed reverse transcription on 1mg of aRNA using random primers from Roche and the SuperscriptII reverse
tran-scriptase from Invitrogen. The same quantity of cDNA (50–100 ng) from SOPs or epithelial cells was then used to perform semi quantitative PCR (30 cycles) or qRT-PCR for several genes.
qRT-PCR was performed on Bio-Rad iCycler IQTM using SYBR green PCR master mix with the following parameters: 95uC-3 min followed by 40 cycles of 95uC-30 sec, 60uC-30 sec and 72uC-30 sec. Quantifications were made using the relative standard curve method. The standard curves were created by a series of 5 dilutions of cDNA synthesized from aRNA, extracted and amplified from 20 whole nota dissected and fixed as described here. Each dilution of the standard curves was amplified in duplicate and each sample of interest was amplified in triplicate. Curves of one experiment are shown in figure S2. mRNA levels detected by qRT-PCR were normalized to mRNA level oftaf11
used as reference gene.
Microarray
Amplified and differently labelled aRNA from 1000 microdis-sected SOPs and an equivalent surface of epithelial cells were hybridized to INDAC Drosophila GeneChips (platform Montpel-lier GenomiX, Institut de Ge´nomique Fontionnelle, UMR 5203 CNRS – U661 INSERM, Montpellier, France). Normalization of raw data was performed by LIMMA. The flagged spots and controls were removed from the analysis. No background correction was performed before normalization. Lowess normalization was used to normalize the M values for each array separately (within-array normalization). Genes exhibiting a signal ratio SOPs/epithelial cells superior than two were considered as SOPs-overexpressed genes for subsequent analysis. Gene Ontology analysis was performed with Flymine [11] that provides enriched GO terms ranked by significance. P values were calculated following a hypergeometric distribution (with Bonferroni correction).
Data Deposition
The raw data associated with this manuscript are available on the Gene Expression Omnibus (GEO) according to MIAME standards under the following accession number: GSE18615.
Results
Purification of SOPs by Laser Microdissection
In order to identify SOP cells, we specifically expressed the construction mCD8::GFP to label SOP membranes and their progeny by using the Gal4/UAS expression system and the specific driver line neuralizedp72Gal4 (neur.)[11]. The dorsal epithelium (or notum) of neu.mCD8::GFP pupae at 16h after puparium formation (APF) was dissected and fixed in ethanol. At this developmental time, most of the SOPs have not yet divided [12,13].
After mounting on a membrane slide, SOPs expressing GFP were identified by fluorescence and circled manually with a circle radius of 9mm (Fig. 1A). Microdissected cells were then collected on an adhesive lid of a microtube placed onto the area (Fig. 1G–J). The success of the cell capture was visually confirmed by the gaps in the tissue after lid removal (Fig. 1C–F). We collected around 20 cells per notum, 20–50 cells on a cap and pooled around 20–50 tubes to proceed to the RNA extraction. Altogether, we collected around 1000 SOPs from 50 nota. In parallel, we captured tissue free of SOP fluorescent cells corresponding to epithelial cells (Fig. 1B). A similar integrated surface (around 250 000mm2) was collected in order to standardize both samples.
Quantitative Real Time PCR and Microarray Data Confirm Differential Expression of Known Genes
We carried out reverse transcription following by PCR on some SOPs specific (ac, sens, [4,9]) and non-specific (rp49, taf11) genes to verify the aRNA extracted and amplified from microdissected cells. Semi quantitative PCR (30 cycles) performed on the same quantity of cDNA from SOPs and epithelial cells showed thatRp49, taf11and
acseem to be expressed at similar levels in SOPs and epithelial cells. In contrast, as expected,gfp(that was ectopically expressed in SOPs)
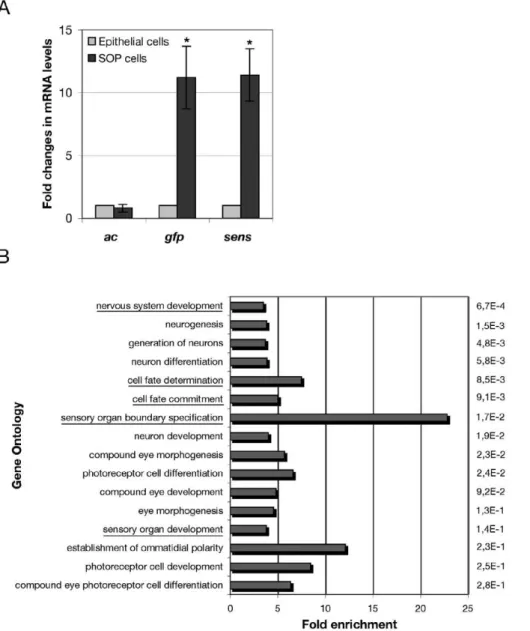
andsenswere more highly expressed in SOPs than in epithelial cells (not shown). To verify these results, we performed quantitative real time PCR (qRT-PCR). We calculated the ratio of SOP/epithelial cells mRNA levels for each gene (Fig. 2A). Using this procedure, we confirmed thatacexpression was not significantly different in SOPs and epithelial cells (ratio = 0,8), whereas the expression ofgfpand
senswas higher in SOP than in epithelial cells (11,2 and 11,4 times respectively) (Fig. 2A and Fig. S2). The significant enrichment of transcripts corresponding to sens and gfp in SOPs confirms the usefulness and the specificity of aRNA material collected using the laser microdissection technique on fixedDrosophilanota.
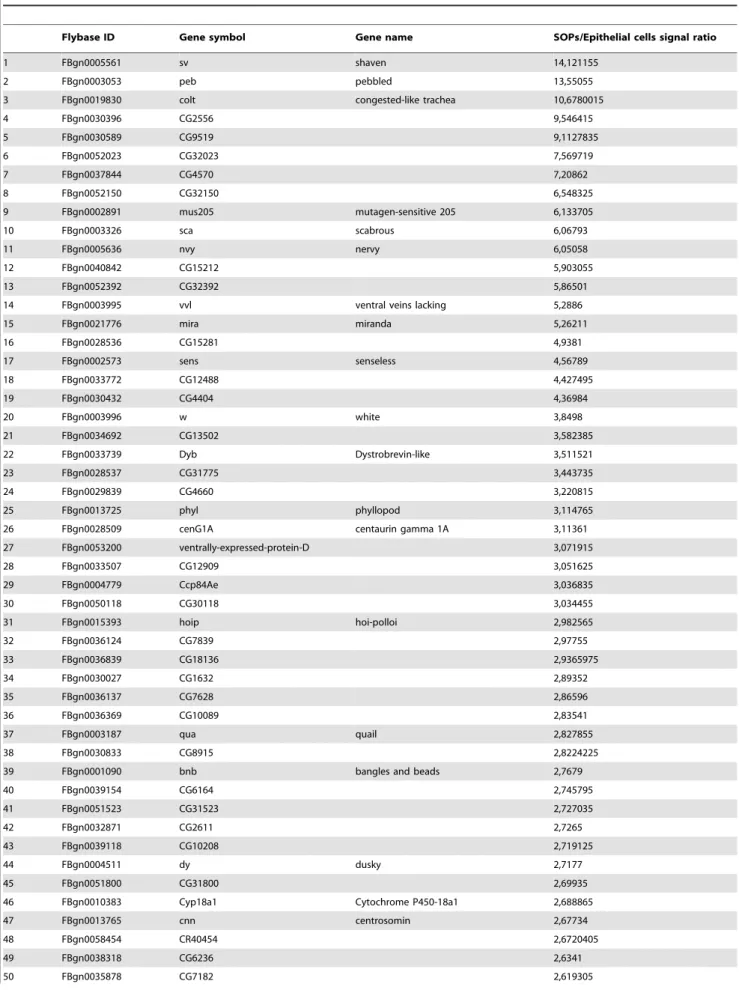
Concomitantly to qRT-PCR analysis, we used DNA micro-arrays to identify genes differently expressed between microdis-sected SOPs and epithelial cells. This analysis revealed 127 genes whose expression was increased 2-fold or greater between SOPs and epithelial cells (Table 1). To analyse whether a particular biological process could be overrepresented in this data set, we regrouped the genes of this set according to their function that has been ascribed using Gene Ontology (Go) terms (www.geneontol-ogy.org). This analysis showed that 58% of these genes were associated with a specific function. Interestingly, 27% of this subset of genes were related to the nervous system. This category showed more than a three fold enrichment in the SOP-gene data set (Fig. 2B). More precisely, a hypergeometric test applied on this set of 127 genes, revealed a significant enrichment in GO terms related to nervous system development, sensory organ develop-ment and cell fate specification. Moreover, several eye photore-ceptor cell development associated GO terms were also enriched in our SOP-gene data set (Fig 2B). Conversely, among GO terms that are significantly underrepresented and, as a consequence, enriched in their sibling epithelial cells, we found cuticle development and epithelium morphogenesis (data not shown). Furthermore, neither genes already known to belong to SOP-enriched genes nor genes associated with GO terms related with cell fate determination and sensory organ specification were found in this SOP non-enriched set of genes.
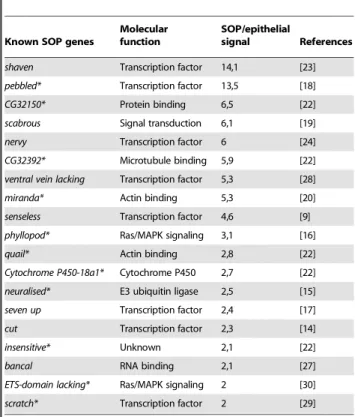
Our data set of SOP-specific genes includes 19 known genes that have already been shown to be expressed in SOPs or involved in sensory organ development related mechanisms (Table 2). Among them, we foundsens, confirming our qRT-PCR analysis, and other SOP-specific genes such ascut (ct), neuralized (neur)and
phyllopod (phyl)[14–16]. We can also notepebbled/hindsight (peb)and
seven up (svp) that are involved in photoreceptor development [17,18],scabrous (sca)that plays a role in lateral inhibition processes via the regulation of Notch activity [19], and miranda (mira)
involved in neuroblast and SOP asymmetric divisions [20,21]. Moreover, among these genes, eleven have already emerged from microarray analysis performed on proneural clusters by Reeves and Posakony [22]. In addition to the well characterised genes such asmira, peb,neur orphyl, we can cite as an example of new SOP genes,quail and insensitive(Table 2). In contrast, some genes in our data set didn’t appear in Reeves and Posakony microarray results. The most relevant examples aresensandct, two well known SOP-specific genes [8,14]. We can also citeshaven, scaornervy, all three being involved in sensory organ development [19,23,24].
Discussion
In this study, we used laser microdissection to isolate SOPs from the dorsal epithelium ofDrosophilain order to subsequently analyse the mRNA expression profile. Laser microdissection permits the isolation of single cells from a heterogeneous tissue [25]. The high level of cell homogeneity obtained with this technique permits one to obtain reliable microarray data. In this regard, microdissection,
Figure 1. Laser Microdissection.Laser Microdissection of SOP cells (left column) and epithelial cells (right column). Fixed nota from
neur.mCD8::GFP flies (16 h APF) that express GFP specifically in SOP cells. SOP cells were laser-cut following a circle pathway centered on each SOP (A). After cut, gaps corresponding to each SOP encircled remained on the nota (transmitted light in C and fluorescent light in E). In contrast, the captured SOP cells stuck to the lid of a microtube (transmitted light in G and fluorescent light in I). A similar procedure is shown for epithelial cell capture. These cells were isolated from areas without fluorescent SOP cells (B). Note that sometimes for SOP (not shown) as well as epithelial cell microdissection (asterisks in D) some areas were not captured and remain on the nota. Note also that, the fluorescence level was strongly reduced after laser beam application (I and J).
although cumbersome, has certain advantages over other methods of isolating populations of cells such as FACS. In our study, microdisection was applied to tissue freshly dissected and simply fixed in absolute ethanol. This was made possible because the tissue of interest is an epithelium that we are able to dissect from the animal and than flatten. As such, the protocol described here may be adapted to other thin tissues similar to epithelia.
The principal challenge with this technique was to obtain a significant quantity of RNA from SOPs and to ensure that the integrity of the RNA after laser microdissection was sufficient for subsequent gene expression analysis such as quantitative
real time PCR and microarrays. Here, we verify the utility and the specificity of the RNA extracted from microdissected SOPs and epithelial cells by performing qRT-PCR on particular genes and undertaking microarray analysis. As expected, we observed by qRT-PCR that sens, known to be up regulated in SOPs by proneural protein activity and repressed in non-SOP cells by Notch signaling activation [8,9], was indeed significantly more expressed in SOPs than in epithelial cells. This result was confirmed by microarray analysis where sens was found among the genes exhibiting a two-fold or greater overexpression in SOPs.
Table 1.Genes whose expression was increased 2-fold or greater between SOPs and epithelial cells.
Flybase ID Gene symbol Gene name SOPs/Epithelial cells signal ratio
1 FBgn0005561 sv shaven 14,121155
2 FBgn0003053 peb pebbled 13,55055
3 FBgn0019830 colt congested-like trachea 10,6780015
4 FBgn0030396 CG2556 9,546415
5 FBgn0030589 CG9519 9,1127835
6 FBgn0052023 CG32023 7,569719
7 FBgn0037844 CG4570 7,20862
8 FBgn0052150 CG32150 6,548325
9 FBgn0002891 mus205 mutagen-sensitive 205 6,133705
10 FBgn0003326 sca scabrous 6,06793
11 FBgn0005636 nvy nervy 6,05058
12 FBgn0040842 CG15212 5,903055
13 FBgn0052392 CG32392 5,86501
14 FBgn0003995 vvl ventral veins lacking 5,2886
15 FBgn0021776 mira miranda 5,26211
16 FBgn0028536 CG15281 4,9381
17 FBgn0002573 sens senseless 4,56789
18 FBgn0033772 CG12488 4,427495
19 FBgn0030432 CG4404 4,36984
20 FBgn0003996 w white 3,8498
21 FBgn0034692 CG13502 3,582385
22 FBgn0033739 Dyb Dystrobrevin-like 3,511521
23 FBgn0028537 CG31775 3,443735
24 FBgn0029839 CG4660 3,220815
25 FBgn0013725 phyl phyllopod 3,114765
26 FBgn0028509 cenG1A centaurin gamma 1A 3,11361
27 FBgn0053200 ventrally-expressed-protein-D 3,071915
28 FBgn0033507 CG12909 3,051625
29 FBgn0004779 Ccp84Ae 3,036835
30 FBgn0050118 CG30118 3,034455
31 FBgn0015393 hoip hoi-polloi 2,982565
32 FBgn0036124 CG7839 2,97755
33 FBgn0036839 CG18136 2,9365975
34 FBgn0030027 CG1632 2,89352
35 FBgn0036137 CG7628 2,86596
36 FBgn0036369 CG10089 2,83541
37 FBgn0003187 qua quail 2,827855
38 FBgn0030833 CG8915 2,8224225
39 FBgn0001090 bnb bangles and beads 2,7679
40 FBgn0039154 CG6164 2,745795
41 FBgn0051523 CG31523 2,727035
42 FBgn0032871 CG2611 2,7265
43 FBgn0039118 CG10208 2,719125
44 FBgn0004511 dy dusky 2,7177
45 FBgn0051800 CG31800 2,69935
46 FBgn0010383 Cyp18a1 Cytochrome P450-18a1 2,688865
47 FBgn0013765 cnn centrosomin 2,67734
48 FBgn0058454 CR40454 2,6720405
49 FBgn0038318 CG6236 2,6341
Flybase ID Gene symbol Gene name SOPs/Epithelial cells signal ratio
51 FBgn0033275 CG14756 2,57977
52 FBgn0037723 SpdS Spermidine Synthase 2,57505
53 FBgn0031273 CG2839 2,56041
54 FBgn0051352 CG31352 2,559855
55 FBgn0030001 CG15335 2,546375
56 FBgn0037240 Cont Contactin 2,5257925
57 FBgn0039152 CG6129 2,52151
58 FBgn0002932 neur neuralized 2,515405
59 FBgn0052827 CG32827 2,47839
60 FBgn0031764 CG9107 2,451235
61 FBgn0037137 Nopp140 2,450615
62 FBgn0019938 RpI1 RNA polymerase I subunit 2,44853
63 FBgn0003651 svp seven up 2,439685
64 FBgn0034656 CG17922 2,43033
65 FBgn0038916 CG6560 2,4265
66 FBgn0039169 CG5669 2,42484
67 FBgn0039630 CG11843 2,386245
68 FBgn0002778 mnd minidiscs 2,37934
69 FBgn0038120 CG10148 2,3619
70 FBgn0050349 CG30349 2,345675
71 FBgn0039335 CG5127 2,337975
72 FBgn0029568 CG11381 2,3251455
73 FBgn0004198 ct cut 2,319
74 FBgn0010105 comm commissureless 2,312085
75 FBgn0035521 CG1268 2,299415
76 FBgn0050007 CG30007 2,299075
77 FBgn0034224 CG6520 2,29819
78 FBgn0031706 nmr2 neuromancer2 2,27797
79 FBgn0037314 CG12000 2,271605
80 FBgn0000409 Cyt-c-p Cytochrome c proximal 2,267055
81 FBgn0031604 CG15433 2,26653
82 FBgn0039404 CG14543 2,261375
83 FBgn0027903 CG12018 2,25671
84 FBgn0028855 CG15282 2,23759
85 FBgn0035532 CG15014 2,222355
86 FBgn0034528 CG11180 2,21393
87 FBgn0033802 CG17724 2,20619
88 FBgn0030958 CG6900 2,20591
89 FBgn0038017 CG4115 2,194645
90 FBgn0026378 Rep Rab escort protein 2,173765
91 FBgn0028510 CG15261 2,173175
92 FBgn0052344 CG32344 2,163085
93 FBgn0031434 insv insensitive 2,159285
94 FBgn0039563 CG4951 2,15345
95 FBgn0015907 bl bancal 2,152305
96 FBgn0011638 La La autoantigen-like 2,150125
97 FBgn0032297 CG17124 2,142305
98 FBgn0039271 CG11839 2,13788
99 FBgn0036043 CG8177 2,136985
100 FBgn0000340 cno canoe 2,136715
Similarly,gfp, whose expression was driven specifically in SOPs and their progeny by neur-GAL4, was more expressed in microdissected SOPs. However,gfptranscripts were still detected in the epithelial sample. This was unexpected since epithelial cells were collected from non-fluorescent areas. It might be possible that a few SOPs, not fluorescent enough to be detectable, were included in epithelial cell selected areas. It might also be possible that there is a weak leak of the neur-GAL4 driver onto epithelial cells insufficient to induce a detectable fluorescence.
Unexpectedly, we observed by qRT-PCR and confirmed by microrray, a relatively constant level of ac(ratio SOP/epithelial cells = 0,8 by qRT-PCR and 0,95 by microarray). Indeed,acis a proneural gene whose expression has been shown to be specifically upregulated in proneural clusters and restricted to one cell during SOP specification [3,4]. However, the expression ofacin SOPs has been shown to decrease before cell division [3]. Since we use pupae at 16 h APF, at the moment of SOP first division, we suggest that the relatively similar level ofactranscripts observed in SOP and epithelial cells was due to this downregulation phase.
The SOP-enriched genes of the data set obtained in this analysis were classified using Gene Ontology associated terms. This analysis confirmed the specificity of the microdissected SOP samples. Indeed, microdissected SOPs samples were enriched in
genes involved specifically in sensory organ development and cell fate related GO terms. Interestingly, eye photoreceptor cell development related GO terms were also enriched in our data. This is not surprising since photoreceptor cells share similar mechanisms of selection with the SOPs including the isolation of one cell among equivalent cluster cells by lateral inhibition mediated by Notch signalling [26]. In this regard, it is interesting thatpebwas highly expressed in SOPs compared to epithelial cells. It has been recently shown that one role ofpebis to modulate Delta expression during cone cell induction during ommatidial forma-tion [18]. It remains to be known whetherpebplays a similar role during SOP selection, which it is characterised by an elevated level of Delta.
In accordance with previous studies, many genes (19 out of 127) belonging to the SOP enriched genes identified in our study have been already recognized to be SOP specific. In particular, 11 out of 19 of these known SOP enriched genes are in common with a whole-genome microarray analysis performed with cells belonging to proneural cell clusters [22]. In contrast, some known SOP-specific genes assensandct, were identified in our analysis but not in Reeves and Posakony’s study. In their study, proneural cells were sorted by FACS (Fluorescence-Activated Cell Sorting) by usingE(spl)m4-GFP as proneural cluster-specific marker. As such,
Flybase ID Gene symbol Gene name SOPs/Epithelial cells signal ratio
101 FBgn0039829 CG15561 2,13596
102 FBgn0042092 CG13773 2,123165
103 FBgn0036096 CG8003 2,120365
104 FBgn0052645 CG32645 2,11955
105 FBgn0041004 CG17715 2,112665
106 FBgn0002563 Lsp1b Larval serum protein 1 beta 2,10427
107 FBgn0029761 SK small conductance calcium-activated
potassium channel
2,09556
108 FBgn0052677 CG32677 2,071425
109 FBgn0005630 lola longitudinals lacking 2,068285
110 FBgn0037248 CG9809 2,064895
111 FBgn0004551 Ca-P60A Calcium ATPase at 60A 2,06413
112 FBgn0030501 BthD BthD selenoprotein 2,063545
113 FBgn0023214 edl ETS-domain lacking 2,05935
114 FBgn0015558 tty tweety 2,05836
115 FBgn0003890 bTub97EF beta-Tubulin at 97EF 2,05672
116 FBgn0050080 CG30080 2,054815
117 FBgn0038640 CG7706 2,05049
118 FBgn0030345 CG1847 2,041705
119 FBgn0046704 Liprin-a 2,03972
120 FBgn0039685 Obp99b Odorant-binding protein 99b 2,03933
121 FBgn0029704 CG2982 2,03666
122 FBgn0036460 CG5114 2,03641
123 FBgn0026015 Top3b Topoisomerase 3beta 2,032305
124 FBgn0036133 CG7638 2,022935
125 FBgn0033942 CG10112 2,01533
126 FBgn0036569 CG5414 2,014675
127 FBgn0024734 PRL-1 2,013035
the analysis was performed with all cells of proneural clusters including the future SOP. Thus, we expect that some subset of SOP-specific genes also belongs to the genetic profile triggered during proneural cell determination and that another subset is specific for the acquisition of the SOP identity. It is interesting to note that target genes involved in the Notch-mediated lateral inhibition as the E(spl) or bearded (brd) gene family, which are activated in the future epithelial cells during SOP selection, were either similarly expressed in SOP and epithelial cells or underrepresented in SOPs (for instance, the ratio SOP/epithelial cells forbrdwas 0,35).
Overall, our result confirm the SOP specificity of the gene set identified and we are confident that the approach combining laser microdissected cells and transcriptome analysis will produce
exploitable data. Finally, we would like to highlight that a successful characterisation of the transcriptional profile of well-identified precursor cells at a precise moment of development opens multiple possibilities concerning the analysis of the mechanisms underlying precursor cell determination. Thus, the development of a procedure combining laser microdissection and transcriptome analysis represents an undeniably important technical advance for the analysis of biological processes such as fate determination of defined precursor cells.
Supporting Information
Figure S1 Schematic representation of the procedure. The notum from pupae was manually dissected in PBS, fixed and transferred to a thermolabile membrane slide. The epithelium was facing down membrane. Once dry, the notum, stuck to the membrane, was covered with a slide to maintain the mechanical stability during microdissection. During microdissection the adhesive lid was pressed against the membrane and microdis-sected cells remained stuck to the lid when the microtube was removed.
Found at: doi:10.1371/journal.pone.0009285.s001 (6.86 MB TIF)
Figure S2 qRT-PCR analysis. Taf11, ac, gfp, andsens mRNA transcripts from microdissected SOPs and epithelial cells were analysed by qRT-PCR. For each gene, (on the left) PCR amplification curves as function of the number of PCR cycles and (on the right) standard curves, Ct (Cycle threshold) were plotted against serially diluted cDNA samples obtained from aRNA extracted and amplified from 20 whole nota. Note that PCR amplification curves corresponding to SOPs and epithelial cells fortaf11andacare super-imposed. Ct for SOPs and epithelial cells are similar and data points corresponding to SOPs and epithelial cells cluster together in standard curves (red points). In contrast, PCR amplification curves corresponding togfpandsens
transcripts are shifted to the left in SOP compared to epithelial cells, showing a stronger expression in SOPs than in epithelial cells. Accordingly two separate groups of data points were observed on the standard curves.
Found at: doi:10.1371/journal.pone.0009285.s002 (5.55 MB TIF)
Acknowledgments
We specially thank Heather McLean and Fred Bernard for critical reading of the manuscript and the fly community for fly strains and antibodies. The authors are grateful to Evelyne Souil for excellent assistance. We thank members of our laboratory for advice and technical help.
Author Contributions
Conceived and designed the experiments: EB MG. Performed the experiments: EB. Analyzed the data: EB. Wrote the paper: EB MG.
References
1. Pi H, Chien CT (2007) Getting the edge: neural precursor selection. J Biomed Sci 14: 467–473.
2. Bertrand N, Castro DS, Guillemot F (2002) Proneural genes and the specification of neural cell types. Nat Rev Neurosci 3: 517–530.
3. Cubas P, de Celis JF, Campuzano S, Modolell J (1991) Proneural clusters of achaete-scute expression and the generation of sensory organs in the Drosophila imaginal wing disc. Genes Dev 5: 996–1008.
4. Culı´ J, Modolell J (1998) Proneural gene self-stimulation in neural precursors: an essential mechanism for sense organ development that is regulated by Notch signaling. Genes Dev 12: 2036–2047.
5. Schweisguth F (2004) Regulation of Notch signaling activity. Curr Biol 14: 129–138.
6. Bray SJ (2006) Notch signalling: a simple pathway becomes complex. Nat Rev Mol Cell Biol 7: 678–689.
7. Bailey AM, Posakony JZ (1995) Suppressor of hairless directly activates transcription of enhancer of split complex genes in response to Notch receptor activity. Genes Dev 9: 2609–2622.
8. Jafar-Nejad H, Acar M, Nolo R, Lacin H, Pan H, et al. (2003) Senseless acts as a binary switch during sensory organ precursor selection. Genes Dev 17: 2966–2978.
9. Nolo R, Abbott LA, Bellen HJ (2000) Senseless, a Zn finger transcription factor, is necessary and sufficient for sensory organ development in Drosophila. Cell 102: 349–362.
10. Lyne R, Smith R, Rutherford K, Wakeling M, Varley A, et al. (2007) FlyMine: an integrated database for Drosophila and Anopheles genomics. Genome Biol 8: R129.
11. Brand AH, Perrimon N (1993) Targeted gene expression as a means of altering cell fates and generating dominant phenotypes. Development 118: 401–415. Table 2.Microarray data confirm differential expression of
known SOP genes.
Known SOP genes
Molecular function
SOP/epithelial
signal References
shaven Transcription factor 14,1 [23]
pebbled* Transcription factor 13,5 [18]
CG32150* Protein binding 6,5 [22]
scabrous Signal transduction 6,1 [19]
nervy Transcription factor 6 [24]
CG32392* Microtubule binding 5,9 [22]
ventral vein lacking Transcription factor 5,3 [28]
miranda* Actin binding 5,3 [20]
senseless Transcription factor 4,6 [9]
phyllopod* Ras/MAPK signaling 3,1 [16]
quail* Actin binding 2,8 [22]
Cytochrome P450-18a1* Cytochrome P450 2,7 [22]
neuralised* E3 ubiquitin ligase 2,5 [15]
seven up Transcription factor 2,4 [17]
cut Transcription factor 2,3 [14]
insensitive* Unknown 2,1 [22]
bancal RNA binding 2,1 [27]
ETS-domain lacking* Ras/MAPK signaling 2 [30]
scratch* Transcription factor 2 [29]
Genes previously found to be expressed in SOPs and included in the 127 candidate genes whose expression exhibits a 2.0-fold or greater elevation in SOPs versus epithelial cells.
*Genes also found expressed in proneural clusters according to microarray data obtained by Reeves and Posakony (2005) [22].
12. Gho M, Bellaiche Y, Schweisguth F (1999) Revisiting the Drosophila microchaete lineage: a novel intrinsically asymmetric cell division generates a glial cell. Development 126: 3573–3584.
13. Fichelson P, Gho M (2004) Mother-daughter precursor cell fate transformation after Cdc2 down-regulation in the Drosophila bristle lineage. Dev Biol 276: 367–377.
14. Blochlinger K, Jan LY, Jan YN (1991) Transformation of sensory organ identity by ectopic expression of Cut in Drosophila. Genes Dev 5: 1124–1135. 15. Yeh E, Zhou L, Rudzik N, Boulianne GL (2000) Neuralized functions cell
autonomously to regulate Drosophila sense organ development. Embo J 19: 4827–4837.
16. Pi H, Wu HJ, Chien CT (2001) A dual function of phyllopod in Drosophila external sensory organ development: cell fate specification of sensory organ precursor and its progeny. Development 128: 2699–2710.
17. Miller AC, Seymour H, King C, Herman TG (2008) Loss of seven-up from Drosophila R1/R6 photoreceptors reveals a stochastic fate choice that is normally biased by Notch. Development 135: 707–715.
18. Pickup AT, Ming L, Lipshitz HD (2009) Hindsight modulates Delta expression during Drosophila cone cell induction. Development 136: 975–982. 19. Li Y, Fetchko M, Lai ZC, Baker NE (2003) Scabrous and Gp150 are endosomal
proteins that regulate Notch activity. Development 130: 2819–2827. 20. Roegiers F, Younger-Shepherd S, Jan LY, Jan YN (2001) Two types of
asymmetric divisions in the Drosophila sensory organ precursor cell lineage. Nat Cell Biol 3: 58–67.
21. Mollinari C, Lange B, Gonzalez C (2002) Miranda, a protein involved in neuroblast asymmetric division, is associated with embryonic centrosomes of Drosophila melanogaster. Biol Cell 94: 1–13.
22. Reeves N, Posakony JW (2005) Genetic programs activated by proneural proteins in the developing Drosophila PNS. Dev Cell 8: 413–425.
23. Miller SW, Avidor-Reiss T, Polyanovsky A, Posakony JW (2009) Complex interplay of three transcription factors in controlling the tormogen differentiation program of Drosophila mechanoreceptors. Dev Biol 329: 386–399.
24. Wildonger J, Mann RS (2005) Evidence that nervy, the Drosophila homolog of ETO/MTG8, promotes mechanosensory organ development by enhancing Notch signaling. Dev Biol 286: 507–520.
25. Erickson HS, Gillespie JW, Emmert-Buck MR (2008) Tissue microdissection. Methods Mol Biol 424: 433–448.
26. Sawamoto K, Okano H (1996) Cell-cell interactions during neural development: multiple types of lateral inhibitions involved in Drosophila eye development. Neurosci Res 26: 205–214.
27. Abdelilah-Seyfried S, Chan YM, Zeng C, Justice NJ, Younger-Shepherd S, et al. (2000) A gain-of-function screen for genes that affect the development of the Drosophila adult external sensory organ. Genetics 155: 733–752.
28. Inbal A, Levanon D, Salzberg A (2003) Multiple roles for u-turn/ventral veinless in the development of Drosophila PNS. Development 130: 2467–2478. 29. Roark M, Sturtevant MA, Emery J, Vaessin H, Grell E, Bier E (1995) scratch, a
pan-neural gene encoding a zinc finger protein related to snail, promotes neuronal development. Genes Dev 9: 2384–2398.