in Acute Myeloid Leukemia
Brady G. Miller1, John A. Stamatoyannopoulos2*
1Department of Hematology, University of Washington, Seattle, Washington, United States of America,2Department of Genome Sciences, University of Washington, Seattle, Washington, United States of America
Abstract
Background:Acute myeloid leukemia (AML) is a heterogeneous disease with an overall poor prognosis. Gene expression profiling studies of patients with AML has provided key insights into disease pathogenesis while exposing potential diagnostic and prognostic markers and therapeutic targets. A systematic comparison of the large body of gene expression profiling studies in AML has the potential to test the extensibility of conclusions based on single studies and provide further insights into AML.
Methodology/Principal Findings: In this study, we systematically compared 25 published reports of gene expression profiling in AML. There were a total of 4,918 reported genes of which one third were reported in more than one study. We found that only a minority of reported prognostically-associated genes (9.6%) were replicated in at least one other study. In a combined analysis, we comprehensively identified both gene sets and functional gene categories and pathways that exhibited significant differential regulation in distinct prognostic categories, including many previously unreported associations.
Conclusions/Significance:We developed a novel approach for granular, cross-study analysis of gene-by-gene data and their relationships with established prognostic features and patient outcome. We identified many robust novel prognostic molecular features in AML that were undetected in prior studies, and which provide insights into AML pathogenesis with potential diagnostic, prognostic, and therapeutic implications. Our database and integrative analysis are available online (http://gat.stamlab.org).
Citation:Miller BG, Stamatoyannopoulos JA (2010) Integrative Meta-Analysis of Differential Gene Expression in Acute Myeloid Leukemia. PLoS ONE 5(3): e9466. doi:10.1371/journal.pone.0009466
Editor:Chad Creighton, Baylor College of Medicine, United States of America
ReceivedJanuary 7, 2010;AcceptedFebruary 10, 2010;PublishedMarch 1, 2010
Copyright:ß2010 Miller, Stamatoyannopoulos. This is an open-access article distributed under the terms of the Creative Commons Attribution License, which permits unrestricted use, distribution, and reproduction in any medium, provided the original author and source are credited.
Funding:This work was supported by a grant from the NIH (5T32HL007093). The funders had no role in study design, data collection and analysis, decision to publish, or preparation of the manuscript.
Competing Interests:The authors have declared that no competing interests exist. * E-mail: [email protected]
Introduction
Acute myeloid leukemia (AML) is a heterogeneous disease with overall poor survival. The prognosis of AML is highly conditioned on the presence of specific cytogenetic and molecular abnormalities. Among AMLs with abnormal cytogenet-ics, the presence of t(8;21), t(15;17) or inv(16) is widely recognized as conferring favorable prognosis, while a variety of other chromosomal aberrations define a poor prognostic group.[1] However, the majority of AMLs are cytogenetically normal (CN) and collectively define an intermediate prognostic group. Within the CN group, several molecular abnormalities have been associated with prognosis. For example,FLT3-ITD carries a unfavorable prognosis, while bothNPM1andCEBPAmutations confer a favorable prognosis.[2]
Systematic application of gene expression profiling to AML samples has revealed that major prognostic subgroups based on cytogenetics and molecular markers are recapitu-lated in large-scale gene expression patterns.[3] A large body of AML gene expression profiling studies has emerged together with reported correlations with pathogenesis, diagnosis, risk classification, and outcome prediction.
[4,5,6,7,8,9,10,11,12,13,14,15,16,17,18,19,20,21,22,23,24,25, 26,27,28,29,30,31,32,33] However, these studies have not been systematically compared. Such a comparison has the potential to test the extensibility of conclusions based on single studies, and may provide further insights into AML pathogen-esis while exposing potential diagnostic and prognostic markers and therapeutic targets.
identification of significant gene intersections[38,39,40], the heterogeneity of the published gene lists for AML require development of a novel approach that will allow a fine-grained comparison and analysis.
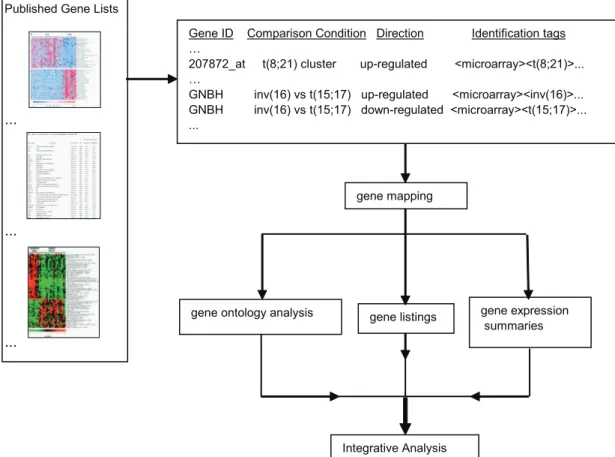
In this paper we describe a systematic, fine-grained multi-study comparison of heterogeneous differentially expressed gene sets emerging from 25 expression profiling studies of AML published between 1999 and 2008. Our approach includes collection of the published gene lists, standardized annotation of each listed gene with identification tags, and a functional analysis of the gene lists that are associated with each identification tag (Figure 1). We identified high interest genes in AML along with genes and functional gene ontology (GO) categories associated with prognosis and common AML subtypes. We discovered many robust novel prognostic molecular features that were undetected in prior studies. Our results provide novel insights into AML pathogenesis with potential diagnostic, prognostic, and thera-peutic implications.
Results
Categorization of Differentially Expressed Genes
A total of 15,809 expression features were available from 25 studies, utilizing 10 different microarray platforms, and comprising a total of 2,744 patient samples (Table 1). Of the 15,809 expression features, 7,416 were classified as up-regulated, 6,419 were classified as down-regulated, and 1,974 were not classified with respect to an expression direction. A total of 14,385 (91%) expression features could be mapped to a gene symbol in the UCSC hg18 database, which comprised a total of 4,918 genes.
Standardized Annotation of Gene Expression Features We annotated each expression feature with standardized identifica-tion tags and comparison condiidentifica-tions. The identificaidentifica-tion tags are a set of descriptors that describe the context of the expression feature, such as the experiment type (RT-PCR or microarray) and the results including prognostic category associations. The database contained 91 unique identification tags (Table S1). The comparison conditions describe the samples that are compared in each experiment and the database contained 78 unique comparison conditions (Table S2).
Genes Associated with AML
We then identified genes that were reported in multiple studies. Of the total 4,918 genes, 1,686 (34.3%) were reported in more than one study. We ranked genes that were listed in at least 8 studies by number of references, number of expression platforms, and number of expression features (Table 2). Although most of these genes have been associated with AML elsewhere in the literature, several genes (VCAN and PGDS) were only described in AML cell lines and a surprising number of the genes (HLA-DPA1,ITM2A,RBPMS,RGS10, RNASE2andTRH) were not specifically described in AML.VCANis a component of the extracellular matrix modulating cell adhesion, cell proliferation, cell migration, and extracellular matrix assembly.[41] High expression ofVCANhas been found in many malignancies, such as melanomas, ovarian, breast, and lung tumors,[41] and in the acute monocytic leukemia cell line, THP-1.[42]PGDS is an enzyme that catalyzes the conversion of PGH2 to PGD2, which is a prostaglandin involved in vasodilation, bronchoconstriction, inhibition of platelet aggregation, and recruitment of inflammatory cells.[43] PGDS expression has been reported in two megakaryoblastic cell lines, CMK and Dami.[43]TRHis a neurotransmitter/neuromodulator in
gene ontology analysis
Integrative Analysis
gene expression summaries gene mapping
gene listings
Gene ID Comparison Condition Direction Identification tags …
207872_at t(8;21) cluster up-regulated <microarray><t(8;21)>... …
GNBH inv(16) vs t(15;17) up-regulated <microarray><inv(16)>... GNBH inv(16) vs t(15;17) down-regulated <microarray><t(15;17)>... ...
Published Gene Lists
...
...
...
the central and peripheral nervous system and is released by the hypothalamus to regulate the biosynthesis of TSH in the anterior pituitary gland.[44]HLA-DPA1is a HLA class II gene involved in antigen presentation, and has been associated with esophageal squamous dysplasia[45] and pilocytic astrocytomas[46].RNASE2is a cationic ribonuclease toxin found in eosinophil granules[47] and reported to have chemotactic[48] and antiviral[49] activities.RBPMSis a RNA-binding protein with an unclear specific function and at least 12 different splice variants.[50] ITM2A is a type II transmembrane glycoprotein expressed in vesicles and on the cell surface and has been noted to be up-regulated during T-cell activation.[51]ITM2Ahas been associated with chrondrogenic[52] and myogenic differentiation[53]. RGS10acts as a GTPase-activating protein via modulation of Gai and Gaz signaling[54], and promotes chrondrogenic differentiation in mice.[55] Expression ofRGS10has been noted in lymphocytes[56] and rat platelets[57].
Concordant Gene Expression Identified in Multiple Studies
We then identified prognostic categories that were reported in greater than 3 independent studies and stratified these by number of genes, differential expression direction, and number of independent studies (Table 3). This analysis revealed the
existence of genes in categories of AML that were strictly up-regulated or down-up-regulated across multiple studies.
Hierarchical Cluster Analyses of Differentially Expressed Genes
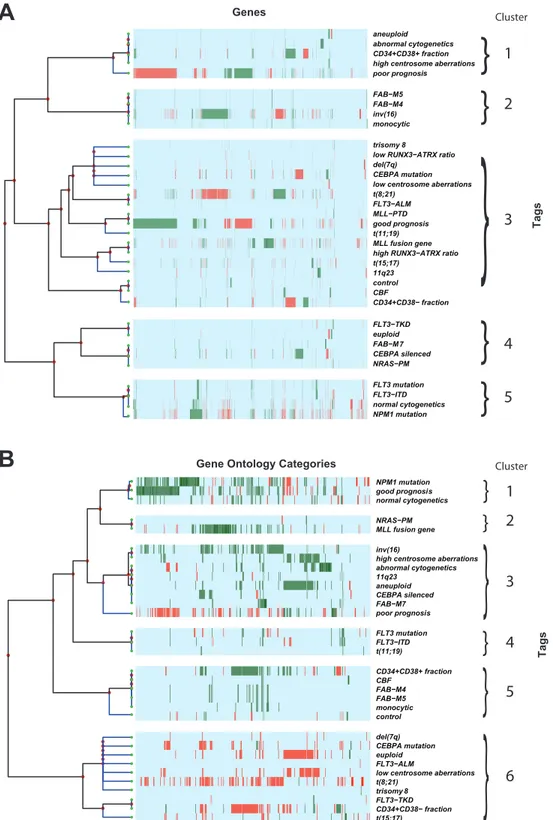
We next performed hierarchical clustering of differentially expressed genes associated with AML prognostic categories (Figure 2A). We identified 5 major clusters. Cluster 1 includes aneuploid, abnormal cytogenetics, CD34+CD38+ AML fraction, high centrosome aberrations and poor prognosis. Cluster 2 includes FAB-M4, FAB-M5, inv(16) and monocytic. Cluster 3 includes a large group of heterogeneous identification tags. Cluster 4 identifies FLT3-TKD, euploid, FAB-M7,CEBPAsilenced, and NRAS-PM. Cluster 5 includesFLT3mutation, FLT3-ITD, normal cytogenetics and NPM1mutation. Cluster 1 corresponds to features noted in poor prognosis AML, cluster 2 corresponds to features found in monocytic differentiated AML, while cluster 5 includes AML subtypes that are found in cytogenetically normal (CN) AML.
Hierarchical Cluster Analyses of Gene Functional Categories
Next, we performed hierarchical cluster analyses of functional categories associated with AML related identification tags Table 1.Acute Myelogenous Leukemia expression profiling studies included in analysis.
Reference Platform Disease
No. of samples
No. of differentially expressed features
No. of differentially expressed mapped features
Golub et al, 19994 Affymetrix HU6000 AML/ALL 72 100 78
Okutsu et al, 20026 Custom cDNA 23,040 clones AML 76 491 355
Schoch et al, 20027 Affymetrix U95Av2 AML 37 150 140
Debernardi et al, 20038 Affymetrix U95Av2 AML 28 77 75
Kohlmann et al, 20039 Affymetrix U95Av2 Affymetrix U133A AML/ALL 90 156 147
Yagi et al, 200310 Affymetrix U95Av2 AML 54 1,910 1,753
Bullinger et al, 200411 Custom cDNA 39,711 clones AML 116 1,040 855
Lacayo et al, 200412 Custom cDNA 42,749 clones AML 100 436 329
Neben et al, 200413 Custom cDNA 4211 clones AML 29 170 162
Ross et al, 200414 Affymetrix U133A AML 150 713 682
Valk et al, 2004* 15 Affymetrix U133A AML 293 779 745
Vey et al, 200416 DiscoveryChip cDNA 9,039 clones AML 55 197 119
Alcalay et al, 200517 Affymetrix U133A AML 78 554 541
Gutierrez et al, 200518 Affymetrix U133A AML 43 181 167
Heuser et al, 200520 Custom cDNA 41,424 clones AML 137 178 146
Haferlach et al, 200519 Affymetrix U133A AML 35 20 19
Neben et al, 200521 Custom cDNA 4,211 clones AML 110 250 250
Verhaak et al, 200522 Affymetrix U133A AML 275 568 555
Radmacher et al, 200625 Affymetrix U133plus2.0 AML 64 314 304
Wilson et al, 200626 Affymetrix U95Av2 AML 170 705 674
Gal et al, 200623 Affymetrix U133A AML 5 822 724
Bullinger et al, 200727 Custom cDNA 39,711 clones AML 93 4,120 3,828
Eisele et al, 200728 Affymetrix U133A AML 11 82 82
Mullighan et al, 200733 Affymetrix U133A AML 93 1,188 1,095
Wouters et al, 200731 Affymetrix U133plus2.0 AML 530 608 560
Total 10 platforms 2,744 15,809 14,385
*Included further analysis of data by Verhaak 200522and Wilson 200626.
(Figure 2B). We identified 6 clusters. Cluster 1 includes NPM1 mutation, good prognosis and normal cytogenetics. Cluster 2 includes NRAS-PM and MLL fusion gene. Cluster 3 includes inv(16), high centrosome aberrations, abnormal cytogenetics, 11q23, aneuploid, CEBPA silenced, FAB-M7, and poor prognosis. Cluster 4 includesFLT3mutation, FLT3-ITD and t(11;19). Cluster 5 includes CD34+CD38+AML fraction, CBF, FAB-M4, FAB-M5, monocytic, and normal patient controls. Cluster 6 includes a large group of heterogeneous identification tags. Cluster 1 corresponds to features noted in good prognosis AML while cluster 3 corresponds to several features noted in poor prognosis AML.
Analysis of HOX and TALE Gene Families
TheHOX/TALEgenes encode transcription factors regulating pattern formation, differentiation, and proliferation, and there is considerable evidence in the literature associating dysregulation of HOX/TALEgenes in AML. [58] We identified 24 homeodomain (HOX/TALE) genes that were listed in at least one study (Table S3). We observed an overall increase inHOX/TALEexpression in AML with normal cytogenetics, NPM1 mutations, FLT3 muta-tions, and 11q23 abnormalities involving theMLLgene. Overall decreases in HOX/TALE expression were observed in normal CD34+ cells, AML with CEBPA mutations and AML with
abnormal cytogenetics, specifically t(15;17), t(8;21), and inv(16). This pattern is consistent with previous RT-PCR studies screening HOX/TALE genes expression levels[59,60,61,62,63,64], al-though the association of CEBPA mutations with decreased HOX/TALEexpression has not been reported previously.
Analysis and Replication of Prognostic Categories Next, we focused on genes associated with good and poor prognosis. We defined ‘good prognosis’ as a relatively increased overall survival or disease free survival or response to therapy. We defined ‘poor prognosis’ as a relatively decreased overall survival or disease free survival or response to therapy. The good prognosis and poor prognosis gene sets are largely reciprocal. Surprisingly, only 9.6% of these genes were replicated with concordant expression directions in more than one study. The top ranked up-regulated and down-regulated genes associated with poor prognosis are shown inTable 4andTable 5respectively. The top ranked up-regulated and down-regulated genes associated with good prognosis are shown inTable S4.
Genes Associated with Prognosis
The majority of the top-ranked genes up-regulated in poor and good prognosis, which are listed inTable 4,Table 5, andTable Table 2.Genes most frequently published in AML expression studies.
Rank Gene symbol No. of references No. of platforms
No. of differentially
expressed features Gene name
1 HOXB2 12 6 32 homeobox B2
2 PBX3 12 5 31 pre-B-cell leukemia homeobox 3
3 HOXA9 11 4 35 homeobox A9
4 POU4F1 11 3 29 POU class 4 homeobox 1
5 TSPAN7 10 5 16 tetraspanin 7
6 MYH11 10 3 38 myosin, heavy chain 11, smooth muscle
7 RUNX1T1 10 3 34 runt-related transcription factor 1; translocated to, 1 (cyclin D-related)
8 TRH 10 3 21 thyrotropin-releasing hormone
9 HLA-DPA1 10 3 20 major histocompatibility complex, class II, DP alpha 1
10 HOXB5 9 5 32 homeobox B5
11 SPARC 9 5 16 secreted protein, acidic, cysteine-rich (osteonectin)
12 HOXA10 9 4 34 homeobox A10
13 RNASE2 9 4 18 ribonuclease, RNase A family, 2 (liver, eosinophil-derived neurotoxin)
14 CD34 9 3 16 CD34 molecule
15 MEIS1 9 3 16 Meis homeobox 1
16 RUNX3 8 5 23 runt-related transcription factor 3
17 VCAN 8 5 22 versican proteoglycan
18 RBPMS 8 4 21 RNA binding protein with multiple splicing
19 HOXA4 8 4 18 homeobox A4
20 MN1 8 4 16 meningioma (disrupted in balanced translocation) 1
21 PRAME 8 4 11 preferentially expressed antigen in melanoma
22 JAG1 8 3 20 jagged 1 (Alagille syndrome)
23 ITM2A 8 3 18 integral membrane protein 2A
24 RGS10 8 3 17 regulator of G-protein signaling 10
25 PGDS* 8 2 12 prostaglandin D2 synthase, hematopoietic
The genes reported in at least eight independent studies are presented here. In order of preference, the genes are ranked by the number of independent studies, the number of unique platforms, and the total number of differentially expressed features.
S4, have not been described elsewhere in human AML literature. Although not associated elsewhere with prognosis, HOXB5[65], DAPK1[66], ANGPT1[67], TCF4[68], C3AR1[69], CAT[70], IL6ST[71],JAG1[32],EZR[32],TP53BP2[72] andTNFAIP2[73] have been described in AML. HOXA10, CD34, HOXA4, MN1, NME1,FOXO1,NRP1, UGCGandFLT3are the only genes listed that have been associated with prognosis of AML in other studies. These studies have described up-regulation of MN1[74], NME1[75], HOXA10[59], and FLT3[76] in poor prognosis AML which correlates with our comparison, while there are conflicting reports ofHOXA4[59,60] andCD34gene expression in poor prognosis AML.CD34is notable and likely represents a false positive result in our comparison. Although up-regulation ofCD34 was initially described to correlate with a decreased response to therapy,[77] it is has since been shown that up-regulation of this gene actually correlates with abnormal cytogenetics, including t(8;21), and is not associated with a decrease in overall survival or disease-free survival.[78] Phosphorylation of FOXO1 has been reported to correlate with decreased overall survival in AML, although transcript expression levels have not been reported as having any correlation with overall survival.[79] Up-regulation of
bothNRP1[80] and UGCG[81] have been previously correlated with decreased survival and chemoresistance in AML respectively, which both contradict the results of our comparison.
Functional Categories and Prognosis
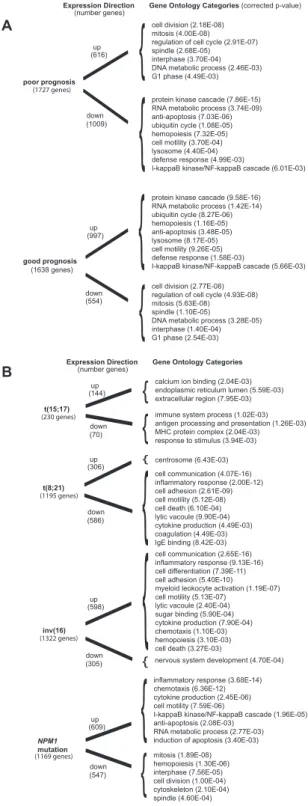
We then identified the functional categories associated with poor prognosis and good prognosis. The specific over-represented functional categories of the up-regulated genes and down-regulated genes associated with poor prognosis and good prognosis are summarized in Figure 3A. Detailed tables describing the over-represented functional categories of up-regulated genes and down-regulated genes associated with poor prognosis and good prognosis are listed in Table S5, Table S6, Table S7 and Table S8respectively. Interestingly, many of the over-represented functional categories of up-regulated genes associated with poor prognosis were shared with up-regulated genes in aneuploidy, high centrosome aberrations and CD34+CD38+ AML fraction, and down-regulated genes in euploidy, low centrosome aberrations, NPM1 mutations, good prognosis AML, CD34+CD38- AML fraction, and FLT3-ITD. These results are consistent with increased expression of genes involved in differentiation and Table 3.Number of genes and independent publications with selected prognostic categories.
Tag (total genes) (total references)
No. genes in 1 study
No. genes in 2 studies
No. genes in 3 studies
No. genes in 4 studies
No. genes in 5 studies
No. genes in 6 studies
No. genes in 7 studies
No. genes in 8 studies
poor prog(1727) (12) all genes 1559 138 27 3
up-regulated 586 28 2
down-regulated 943 55 10 1
good prog(1638) (11) all genes 1484 134 18 1 1
up-regulated 925 62 9 1
down-regulated 528 24 2
NPM1 mut(1169) (5) all genes 978 147 32 11 1
up-regulated 541 42 18 7 1
down-regulated 436 96 13 2
t(15;17)(230) (9) all genes 188 25 9 7 1
up-regulated 115 17 5 6
down-regulated 56 8 4 1 1
inv(16)(1322) (9) all genes 1197 88 23 7 6 1
up-regulated 533 44 12 7 2 1
down-regulated 285 15 4 1
t(8;21)(1195) (9) all genes 1057 92 23 15 4 1 2 1
up-regulated 253 32 13 4 1 2 1
down-regulated 552 27 5 2
11q23(482) (5) all genes 459 19 4
up-regulated 65 1
down-regulated 45 3
FLT3-ITD(235) (4) all genes 224 10 1
up-regulated 135 2 down-regulated 67
normal cyto(519) (6) all genes 480 36 3
up-regulated 173 1 down-regulated 206 6
The AML prognosis and subtype identification tags reported in greater than 3 independent studies are shown with the number of genes listed by number of independent studies and differential expression direction. Identification tag descriptions can be found in Table S1. Note that the following tags are abbreviated: poor prog is poor prognosis, good prog is good prognosis, NPM1 mut is NPM1 mutation, and normal cyto is normal cytogenetics.
Figure 2. Hierarchical cluster analyses.Strict up-regulation is green and strict down-regulation is red, while light blue represents no reported specific direction. Identification tag descriptions can be found in Table S1. (A) Hierarchical cluster analysis of the 3998 differentially expressed genes (x-axis) of AML prognostic categories (y-axis). For illustration purposes, we notated and manually separated 5 major clusters. Cluster 1 includes aneuploid, abnormal cytogenetics, CD34+CD38+AML fraction, high centrosome aberrations and poor prognosis. Cluster 2 includes FAB-M4, FAB-M5, inv(16) and monocytic. Cluster 3 includes a large group of heterogenous identification tags. Cluster 4 identifies FLT3-TKD, euploid, FAB-M7,CEBPA
silenced, and NRAS-PM. Cluster 5 includesFLT3mutation, FLT3-ITD, normal cytogenetics andNPM1mutation. (B) Hierarchical cluster analysis of the 541 differential GO categories (x-axis) of AML prognostic categories (y-axis). For illustration purposes, we notated and manually separated 6 major clusters. Cluster 1 includesNPM1mutation, good prognosis and normal cytogenetics. Cluster 2 includes NRAS-PM and MLL fusion gene. Cluster 3
includes inv(16), high centrosome aberrations, abnormal cytogenetics, 11q23, aneuploid, CEBPA silenced, FAB-M7, and poor prognosis. Cluster 4 includesFLT3mutation, FLT3-ITD and t(11;19). Cluster 5 includes CD34+CD38+AML fraction, CBF, FAB-M4, FAB-M5, monocytic, and normal patient
apoptosis dysregulation in good prognosis AML and increased expression of genes involved in proliferation in poor prognosis AML.
Analysis of Molecular and Cytogenetic Subtypes
We then surveyed specific molecular and cytogenetic subtypes of AML that reported genes in greater than 3 independent studies. This includes NPM1 mutations, t(15;17), inv(16), and t(8;21), which are all known to portend a good prognosis. [1,82] The top-ranked up-regulated and down-regulated genes associated with NPM1mutations, t(15;17), inv(16), and t(8;21) are shown inTable S9, Table S10, Table S11and Table S12 respectively. The specific over-represented functional categories of the up-regulated genes and down-regulated genes associated withNPM1mutations, t(15;17), inv(16), and t(8;21) are summarized in Figure 3B. Notably, NPM1 mutation’s functional categories were concordant with good prognosis AML. AML with t(15;17) illustrated down-regulation of genes involved in the immune system. Interestingly, t(8;21) and inv(16) mirrored each other in terms of direction of their common functional categories because of the significant proportion of studies that directly compared these two entities. Detailed tables describing the over-represented functional
catego-ries of up-regulated genes and down-regulated genes associated withNPM1 mutations, t(15;17), inv(16), and t(8;21) are listed in Table S13,Table S14,Table S15, Table S16, Table S17, Table S18,Table S19andTable S20respectively.
Discussion
We developed a methodology for the comparison of published heterogeneous gene lists, and we developed a web application (http://gat.stamlab.org) to facilitate access to the study data. This approach permitted a granular multi-study comparison of gene lists and functional gene ontology classifications. To our knowledge, the body of published AML gene expression profiling studies in the form of published gene lists has not been systematically compared.
We extracted a list of 4918 genes that were reported in 25 gene expression profiling studies of AML. We found that a considerable amount of the genes (32.7%) were published in more than one study, and we described a list of 25 genes that were reported in greater than 8 studies. Although most of these genes have been associated with AML elsewhere in the literature, several genes (VCANandPGDS) have only been described in AML cell lines and a surprising number of the genes (HLA-DPA1, ITM2A, RBPMS, Table 4.Top ranked up-regulated genes associated with poor prognosis.
Rank Gene symbol
No. of specific references
Total no. of references
Total no. of platforms
Total no. of differentially
expressed features Gene name
1 BCL11A 3 5 4 19 B-cell CLL/lymphoma 11A (zinc finger protein)
2 TBXAS1 3 5 4 11 thromboxane A synthase 1 (platelet,
cytochrome P450, family 5, subfamily A)
3 HOXB5 2 9 5 32 homeobox B5
4 HOXA10 2 9 4 34 homeobox A10
5 CD34 2 9 3 16 CD34 molecule
6 RBPMS 2 8 4 21 RNA binding protein with multiple splicing
7 HOXA4 2 8 4 18 homeobox A4
8 MN1 2 8 4 16 meningioma (disrupted in balanced
translocation) 1
9 GNAI1 2 6 3 12 guanine nucleotide binding protein (G
protein), alpha inhibiting, activity polypeptide 1
10 SKAP2 2 5 4 21 src kinase associated phosphoprotein 2
11 MCM3 2 5 4 9 minichromosome maintenance complex
component 3
12 CLIP2 2 5 3 8 CAP-GLY domain containing linker protein 2
13 DAPK1 2 5 3 8 death-associated protein kinase 1
14 GUCY1A3 2 4 4 8 guanylate cyclase 1, soluble, alpha 3
15 ANGPT1 2 4 3 11 angiopoietin 1
16 MTHFD1 2 4 3 6 methylenetetrahydrofolate dehydrogenase
(NADP+dependent) 1,
methenyltetrahydrofolate cyclohydrolase, formyltetrahydrofolate synthetase
17 MAP7 2 3 3 14 microtubule-associated protein 7
18 UGCGL2 2 3 3 11 UDP-glucose ceramide glucosyltransferase-like
2
19 SH2B3 2 3 3 6 SH2B adaptor protein 3
20 FLT3 2 3 3 5 fms-related tyrosine kinase 3
RGS10,RNASE2andTRH) have not been specifically described in AML.
We identified gene sets that were associated with good prognosis and poor prognosis (overall survival, disease free survival, or response to therapy) in AML across multiple studies. Surprisingly, only 9.6% of these genes were replicated with concordant expression directions in more than one study. We surveyed the higher ranked genes that were reported in multiple studies, and noted the majority of these genes were not described elsewhere in human AML.
We also identified functional gene ontology categories that are associated with prognosis in AML, which are consistent with increased expression of genes involved in differentiation and apoptosis dysregulation in good prognosis AML and increased expression of genes involved in proliferation in poor prognosis AML. A study included in our comparison that examined survival in CBF AML also associated up-regulation of proliferation GO categories with decreased survival and associated up-regulation of RNA metabolism and apoptosis dysregulation GO categories with increased survival.[27]
We identified differentially expressed genes across multiple studies that were associated with specific subtypes of AML including t(15;17), inv(16), t(8;21), and NPM1 mutations. For example, there were 5 papers in our comparison that reported gene lists associated with NPM1 mutations, and all 5 of these papers reported up-regulation of SMC4. Additionally, we also identified functional gene ontology categories that were associated with each of these AML subtypes. Interestingly, the functional gene ontology sets of AML with theNPM1mutation were similar to good prognosis AML, which is expected considering NPM1 mutations impart a favorable prognosis.
Our comparison included 24 homeodomain (HOX/TALE) genes with 7 listed in more than 7 papers. TheHOX/TALEgenes encode transcription factors regulating pattern formation, differ-entiation, and proliferation. Orderly HOX gene activation is essential for normal hematopoiesis withHOXgenes preferentially expressed in the hematopoietic stem cell compartment and then down-regulated following differentiation and maturation.[58] There is considerable evidence in the literature associating dysregulation of HOX/TALE genes in AML.[58] Constitutive Table 5.Top ranked down-regulated genes associated with poor prognosis.
Rank Gene symbol
No. of specific references
Total no. of references
Total no. of platforms
Total no. of differentially
expressed features Gene name
1 EML4 4 4 3 22 echinoderm microtubule associated
protein like 4
2 C3AR1 3 6 2 9 complement component 3a receptor 1
3 SMG1* 3 5 4 26 phosphatidylinositol 3-kinase-related
protein kinase
4 FOXO1 3 5 4 15 forkhead box O1
5 IL6ST 3 4 3 18 interleukin 6 signal transducer (gp130,
oncostatin M receptor)
6 UGCG 3 4 3 12 UDP-glucose ceramide
glucosyltransferase
7 ADFP 3 4 2 12 adipose differentiation-related protein
8 AZU1 3 4 2 8 azurocidin 1 (cationic antimicrobial
protein 37)
9 SNX9 3 3 2 14 sorting nexin 9
10 PIK3R4 3 3 2 8 phosphoinositide-3-kinase, regulatory
subunit 4, p150
11 SEMA3F 3 3 2 6 sema domain, immunoglobulin domain
(Ig), short basic domain, secreted, (semaphorin) 3F
12 JAG1 2 8 3 20 jagged 1 (Alagille syndrome)
13 CD3D 2 7 4 21 CD3d molecule, delta (CD3-TCR
complex)
14 SLC7A7 2 6 5 14 solute carrier family 7 (cationic amino
acid transporter, y+system), member 7
15 ENDOD1 2 6 4 13 endonuclease domain containing 1
16 GYPC 2 6 4 11 glycophorin C (Gerbich blood group)
17 ISG20 2 6 3 17 interferon stimulated exonuclease gene
20 kDa
18 EZR 2 5 4 13 Ezrin
19 AGRN 2 5 4 12 Agrin
20 NRP1 2 5 3 9 neuropilin 1
In order of preference, the genes are ranked by the number of poor prognosis related independent studies, the total number of independent studies, the total number of unique platforms, and the total number of features. Genes that were also associated with good prognosis with the same expression direction are not shown. *Gene symbol is not approved by HUGO Gene Nomenclature Committee.
expression ofHOXA7,HOXA9,HOXA10,HOXB3, andHOXB8in mice results in acute leukemia,[83,84,85,86] and recurrent chromosomal translocations in humans involving HOXA9[87], PBX1[88], andHOX11[89] results in leukemia. TheMLLgene is a known positive regulator ofHOX/TALE expression and translo-cations involving the MLL gene have been associated with increased expression of HOXA4-11,MEIS1, andPBX1.[58]
Our comparison showed a general increase in HOX/TALE expression in AML with normal cytogenetics,NPM1 mutations, FLT3mutations, and 11q23 abnormalities involving theMLLgene while showing an overall decrease inHOX/TALE expression in normal patient CD34+ cells, AML with CEBPA mutations and AML with abnormal cytogenetics, specifically t(15;17), t(8;21), and inv(16). All of the above trends, except forCEBPAmutations, have been reported and confirmed in several RT-PCR stud-ies.[59,60,61,62,63,64] To our knowledge, the association of CEBPAmutations with decreasedHOX/TALEexpression has not been reported previously. Several of the HOX/TALE genes, specifically HOXB2, PBX3 and MEIS1, were also shown in our comparison to have increased expression in inv(16) when compared to t(8;21), which is supported by two recent RT-PCR studies[59,60]. Exceptions to the above trends in our comparison include decreased expression ofHOXB2withMLLtranslocations, decreased expression ofPBX2withMLLtranslocations andNPM1 mutations, and decreased expression of HOXC4 with NPM1 mutations.
Several RT-PCR studies have associated increased expression of HOXA1-10 and MEIS1 with decreased overall survival in AML,[59,61] although recently a RT-PCR study did associate decreased expression ofHOXA4with decreased overall survival in CN AML[60]. Several RT-PCR studies have also associated high risk cytogenetics with increased expression of HOX/TALE genes[58,61] and an RT-PCR study has associated increased expression ofFLT3orFLT3mutations in CN AML with increased expression ofHOX/TALEgenes[63]. In poor prognosis (includes decreased overall survival, disease free survival, or response to therapy) AML, our comparison showed increased expression of severalHOX/TALEgenes, specificallyHOXA4,HOXA10,HOXB5 and PBX1, while showing decreased expression of MEIS1 and contradictory expression directions of HOXB2 and PBX3. Although an overall increase ofHOX/TALE expression in poor prognosis AML has been reported, there are several contradictions to this includingMEIS1,HOXB2andPBX3in our comparison and HOXA4in an outside RT-PCR study[60]. Additionally, the overall trend of increasedHOX/TALEexpression in poor prognosis AML does not appear specific because our comparison and the literature also report increased expression ofHOX/TALEgenes in CN AML and AML withNPM1mutations. This point is well illustrated by an RT-PCR study using a classifier with 17 homeodomain genes that was able to differentiate favorable cytogenetics from intermediate/unfavorable cytogenetics, however unable to differ-entiate intermediate from unfavorable cytogenetics.[59]
There were several intriguing potential targets of therapy uncovered during our analysis. TBXAS1 is an enzyme that converts prostaglandin H2 into thromboxane A2.[90] Thrombox-ane A2 induces platelet aggregation, smooth muscle contraction, and possibly modulates mitogenesis and apoptosis.[91] Although there have been no previous reports describing TBXAS1 expression in AML, our comparison included three papers that associated increased expression ofTBXAS1with a poor prognosis. In bladder cancer cells, pharmacologic inhibition ofTBXAS1with furegrelate or ozagrel induced apoptosis and enhanced sensitivity to chemotherapy,[92] which does suggest that pharmacologic inhibition of this enzyme has potential for treatment in AML.
Figure 3. Functional category comparisons.(A) Significantly over-represented functional gene ontology (GO) categories of interest in up-regulated and down-up-regulated genes found in poor prognosis and good prognosis are compared; the comprehensive functional gene ontology listings can be found in Table S5, Table S6, Table S7, and Table S8. (B) Significantly over-represented functional gene ontology (GO) categories of interest in up-regulated and down-regulated genes found in AML withNPM1mutation, t(15;17), t(8;21) and inv(16) are compared;
SEMA3Fis a secreted protein that has been reported to function as a axon guidance factor, a tumor suppressor gene in small cell lung cancer, a inhibitor of angiogenesis, and a possible direct inhibitor of tumor cell migration and attachment.[93] Although there have been no previous reports describingSEMA3Fexpression in AML, our comparison included three papers that associated increased expression ofSEMA3Fwith a good prognosis, which suggest that a SEMA3Fanalog could have potential for treatment in AML.
Our methodology was shown to be especially useful in systematically identifying commonly reported genes and pathways in the heterogeneous disease of AML. Our method is flexible and ensures the inclusion of all pertinent studies into the analysis and is accompanied by an online analysis and database querying tool for other investigators. To ensure the inclusion of all possible pertinent studies, our methodology does not require raw data and can incorporate both published differential gene lists that are not quantified and published gene lists with no reported direction of expression (12% of the published expression features were not associated with a direction). Another strategy that utilizes gene list comparisons across studies has been published by Griffith et al. and Chan et al.[36,37] Their method successfully identified biomarkers in thyroid and colorectal cancer, however, we chose not to employ their method because each feature requires an explicit expression direction and a quantified expression value.
A potential disadvantage of our methodology is the wide variety of methods employed by the individual studies, which include sample populations, sample sizes, microarray platform types, statistical analysis methods, and the ultimate decisions of which gene lists the authors decide to publish. This heterogeneity in methods can also be viewed as an advantage. For example, a gene that is listed in two studies that employ different microarray platforms and statistical methods could be considered more meaningful than a gene that is listed in two studies that employ the same microarray platform and statistical methodology. Another potential disadvantage with our methodology is publica-tion bias, because our results are dependent on gene lists the authors have decided to publish within their respective studies. To avoid the introduction of any further bias into our results, we do not attempt to weigh the importance of each study by quality metrics, such as sample size or data quality, thus the resulting gene rankings are simply primarily based on the number of applicable studies the gene was reported in.
In the future, our methodology could be applied to perform comparisons of other malignancies and disease states. The main limitations include the tedious process required to collect the gene lists and the potential for publication bias. However, despite these limitations, our methodology is especially powerful in systemati-cally identifying commonly reported genes and pathways in heterogeneous diseases, such as AML, and is especially useful in cases where the raw gene expression datasets are not available.
Materials and Methods
Data Collection and Curation
We queried Pubmed for acute myeloid leukemia expression profiling studies published between 1999 and early 2008. We excluded studies that predominantly examined non-leukemia cells and studies that contained less than 5 patient samples. In total, published gene lists were collected from 25 independent studies (Table 1). The published gene lists were processed to obtain the following information: gene symbol; unique identifiers (Accession ID, Affymetrix probe ID, LocusLink ID, UniGene ID); compar-ison conditions; differential expression; microarray platform; number of samples; PubMed ID; and identification tags. The
identification tags are a set of descriptors that describe each expression feature. If two conditions were being compared, then two separate expression features were created with opposite differential expression and opposing identification tags. The notation of the comparison conditions and the identification tags in the database were standardized to allow the gene expression summary analysis and gene ontology analysis, which are both described below. The above processing was accomplished with a combination of parsing with custom Perl scripts, manual transcription, and copying/pasting. This information was then enumerated and formatted with custom Perl scripts to create a flat file database.
Gene Mapping
The expression features in the collected published lists were referenced by one or more of the following: gene symbol, accession ID, Affymetrix probe ID, LocusLink ID, and/or UniGene ID. These references were mapped to the Gene Symbol in the UCSC human genome hg18 database [94] with custom Perl scripts. If we were unable to map the reference to a Gene Symbol in the UCSC database, then the expression feature was not included in further analysis.
Tag-Based Classification of Expression with Prognostic Features
We used an integrative approach to assign identification ‘‘tags’’ to gene expression and prognostic categories. A flow chart of the approach is illustrated inFigure 1. We assigned identification tags to each datapoint and used a strict nomenclature for comparison conditions.
Gene Expression Summary
We developed a customized Perl script that incorporates the comparison conditions and identification tags in an algorithm to summarize the expression directions of each mapped gene. These expression summaries can be viewed in an online Browser (http:// gat.stamlab.org).(B.G.M and J.A.S., manuscript in preparation)
Functional Classification of Gene Lists
For functional classification of the gene lists, we used GO::TermFinder[95] for gene ontology (GO)[96]analysis. We downloaded the GO v1.0 OBO database 2/22/2008 release from http://www.geneontology.org. We downloaded the human anno-tation file version 60.0 and human cross-reference file version 3.39 from the GOA website http://www.ebi.ac.uk/GOA/. We devel-oped custom Perl scripts to create a list of genes that was associated with each identification tag and differential expression direction. These lists of genes were then mapped to the appropriate Swiss-Prot ID with the above mentioned GOA human cross-reference file. To avoid an over-representation bias, we only allowed one Swiss-Prot ID per gene. Statistically significant over-represented GO categories of the Swiss-Prot ID lists were identified with GO:TermFinder; we used the entire GO annotation as the background, and statistical significance was calculating by the Bonferroni multiple hypothesis with a p-value cutoff of 0.01.
Clustering Analysis
package, which employed the method of complete linkage and Canberra distance.
Supporting Information
Table S1 List of identification tags and descriptions
Found at: doi:10.1371/journal.pone.0009466.s001 (0.01 MB PDF)
Table S2 List of comparison conditions
Found at: doi:10.1371/journal.pone.0009466.s002 (0.01 MB PDF)
Table S3 Expression summaries of HOX and TALE genes Found at: doi:10.1371/journal.pone.0009466.s003 (0.03 MB PDF)
Table S4 Top ranked genes associated with good prognosis Found at: doi:10.1371/journal.pone.0009466.s004 (0.03 MB PDF)
Table S5 Functional categories of up-regulated genes associated with poor prognosis
Found at: doi:10.1371/journal.pone.0009466.s005 (0.02 MB PDF)
Table S6 Functional categories of down-regulated genes associ-ated with poor prognosis
Found at: doi:10.1371/journal.pone.0009466.s006 (0.03 MB PDF)
Table S7 Functional categories of up-regulated genes associated with good prognosis
Found at: doi:10.1371/journal.pone.0009466.s007 (0.03 MB PDF)
Table S8 Functional categories of down-regulated genes associ-ated with good prognosis
Found at: doi:10.1371/journal.pone.0009466.s008 (0.02 MB PDF)
Table S9 Top ranked genes associated with NPM1 mutations Found at: doi:10.1371/journal.pone.0009466.s009 (0.03 MB PDF)
Table S10 Top ranked genes associated with t(15;17)
Found at: doi:10.1371/journal.pone.0009466.s010 (0.01 MB PDF)
Table S11 Top ranked genes associated with inv(16)
Found at: doi:10.1371/journal.pone.0009466.s011 (0.03 MB PDF)
Table S12 Top ranked genes associated with t(8;21)
Found at: doi:10.1371/journal.pone.0009466.s012 (0.03 MB PDF)
Table S13 Functional categories of up-regulated genes associat-ed with NPM1 mutations
Found at: doi:10.1371/journal.pone.0009466.s013 (0.03 MB PDF)
Table S14 Functional categories of down-regulated genes associated with NPM1 mutations
Found at: doi:10.1371/journal.pone.0009466.s014 (0.02 MB PDF)
Table S15 Functional categories of up-regulated genes associat-ed with t(15;17)
Found at: doi:10.1371/journal.pone.0009466.s015 (0.02 MB PDF)
Table S16 Functional categories of down-regulated genes associated with t(15;17)
Found at: doi:10.1371/journal.pone.0009466.s016 (0.02 MB PDF)
Table S17 Functional categories of up-regulated genes associat-ed with inv(16)
Found at: doi:10.1371/journal.pone.0009466.s017 (0.03 MB PDF)
Table S18 Functional categories of down-regulated genes associated with inv(16)
Found at: doi:10.1371/journal.pone.0009466.s018 (0.02 MB PDF)
Table S19 Functional categories of up-regulated genes associat-ed with t(8;21)
Found at: doi:10.1371/journal.pone.0009466.s019 (0.01 MB PDF)
Table S20 Functional categories of down-regulated genes associated with t(8;21)
Found at: doi:10.1371/journal.pone.0009466.s020 (0.03 MB PDF)
Author Contributions
Conceived and designed the experiments: BGM JAS. Performed the experiments: BGM. Analyzed the data: BGM JAS. Contributed reagents/ materials/analysis tools: BGM. Wrote the paper: BGM JAS.
References
1. Wheatley K, Burnett AK, Goldstone AH, Gray RG, Hann IM, et al. (1999) A simple, robust, validated and highly predictive index for the determination of risk-directed therapy in acute myeloid leukaemia derived from the MRC AML 10 trial. United Kingdom Medical Research Council’s Adult and Childhood Leukaemia Working Parties. Br J Haematol 107: 69–79.
2. Schlenk RF, Dohner K (2009) Impact of new prognostic markers in treatment decisions in acute myeloid leukemia. Curr Opin Hematol 16: 98–104. 3. Wouters BJ, Lowenberg B, Delwel R (2009) A decade of genome-wide gene
expression profiling in acute myeloid leukemia: flashback and prospects. Blood 113: 291–298.
4. Golub TR, Slonim DK, Tamayo P, Huard C, Gaasenbeek M, et al. (1999) Molecular classification of cancer: class discovery and class prediction by gene expression monitoring. Science 286: 531–537.
5. Virtaneva K, Wright FA, Tanner SM, Yuan B, Lemon WJ, et al. (2001) Expression profiling reveals fundamental biological differences in acute myeloid leukemia with isolated trisomy 8 and normal cytogenetics. Proc Natl Acad Sci U S A 98: 1124–1129.
6. Okutsu J, Tsunoda T, Kaneta Y, Katagiri T, Kitahara O, et al. (2002) Prediction of chemosensitivity for patients with acute myeloid leukemia,
according to expression levels of 28 genes selected by genome-wide complementary DNA microarray analysis. Mol Cancer Ther 1: 1035–1042. 7. Schoch C, Kohlmann A, Schnittger S, Brors B, Dugas M, et al. (2002) Acute
myeloid leukemias with reciprocal rearrangements can be distinguished by specific gene expression profiles. Proc Natl Acad Sci U S A 99: 10008–10013. 8. Debernardi S, Lillington DM, Chaplin T, Tomlinson S, Amess J, et al. (2003) Genome-wide analysis of acute myeloid leukemia with normal karyotype reveals a unique pattern of homeobox gene expression distinct from those with translocation-mediated fusion events. Genes Chromosomes Cancer 37: 149–158.
9. Kohlmann A, Schoch C, Schnittger S, Dugas M, Hiddemann W, et al. (2003) Molecular characterization of acute leukemias by use of microarray technology. Genes Chromosomes Cancer 37: 396–405.
10. Yagi T, Morimoto A, Eguchi M, Hibi S, Sako M, et al. (2003) Identification of a gene expression signature associated with pediatric AML prognosis. Blood 102: 1849–1856.
12. Lacayo NJ, Meshinchi S, Kinnunen P, Yu R, Wang Y, et al. (2004) Gene expression profiles at diagnosis in de novo childhood AML patients identify FLT3 mutations with good clinical outcomes. Blood 104: 2646–2654. 13. Neben K, Tews B, Wrobel G, Hahn M, Kokocinski F, et al. (2004) Gene
expression patterns in acute myeloid leukemia correlate with centrosome aberrations and numerical chromosome changes. Oncogene 23: 2379–2384. 14. Ross ME, Mahfouz R, Onciu M, Liu HC, Zhou X, et al. (2004) Gene expression
profiling of pediatric acute myelogenous leukemia. Blood 104: 3679–3687. 15. Valk PJ, Verhaak RG, Beijen MA, Erpelinck CA, Barjesteh van Waalwijk van
Doorn-Khosrovani S, et al. (2004) Prognostically useful gene-expression profiles in acute myeloid leukemia. N Engl J Med 350: 1617–1628.
16. Vey N, Mozziconacci MJ, Groulet-Martinec A, Debono S, Finetti P, et al. (2004) Identification of new classes among acute myelogenous leukaemias with normal karyotype using gene expression profiling. Oncogene 23: 9381–9391. 17. Alcalay M, Tiacci E, Bergomas R, Bigerna B, Venturini E, et al. (2005) Acute
myeloid leukemia bearing cytoplasmic nucleophosmin (NPMc+AML) shows a distinct gene expression profile characterized by up-regulation of genes involved in stem-cell maintenance. Blood 106: 899–902.
18. Gutierrez NC, Lopez-Perez R, Hernandez JM, Isidro I, Gonzalez B, et al. (2005) Gene expression profile reveals deregulation of genes with relevant functions in the different subclasses of acute myeloid leukemia. Leukemia 19: 402–409. 19. Haferlach T, Kohlmann A, Schnittger S, Dugas M, Hiddemann W, et al. (2005)
AML M3 and AML M3 variant each have a distinct gene expression signature but also share patterns different from other genetically defined AML subtypes. Genes Chromosomes Cancer 43: 113–127.
20. Heuser M, Wingen LU, Steinemann D, Cario G, von Neuhoff N, et al. (2005) Gene-expression profiles and their association with drug resistance in adult acute myeloid leukemia. Haematologica 90: 1484–1492.
21. Neben K, Schnittger S, Brors B, Tews B, Kokocinski F, et al. (2005) Distinct gene expression patterns associated with FLT3- and NRAS-activating mutations in acute myeloid leukemia with normal karyotype. Oncogene 24: 1580–1588. 22. Verhaak RG, Goudswaard CS, van Putten W, Bijl MA, Sanders MA, et al.
(2005) Mutations in nucleophosmin (NPM1) in acute myeloid leukemia (AML): association with other gene abnormalities and previously established gene expression signatures and their favorable prognostic significance. Blood 106: 3747–3754.
23. Gal H, Amariglio N, Trakhtenbrot L, Jacob-Hirsh J, Margalit O, et al. (2006) Gene expression profiles of AML derived stem cells; similarity to hematopoietic stem cells. Leukemia 20: 2147–2154.
24. Lee S, Chen J, Zhou G, Shi RZ, Bouffard GG, et al. (2006) Gene expression profiles in acute myeloid leukemia with common translocations using SAGE. Proc Natl Acad Sci U S A 103: 1030–1035.
25. Radmacher MD, Marcucci G, Ruppert AS, Mrozek K, Whitman SP, et al. (2006) Independent confirmation of a prognostic gene-expression signature in adult acute myeloid leukemia with a normal karyotype: a Cancer and Leukemia Group B study. Blood 108: 1677–1683.
26. Wilson CS, Davidson GS, Martin SB, Andries E, Potter J, et al. (2006) Gene expression profiling of adult acute myeloid leukemia identifies novel biologic clusters for risk classification and outcome prediction. Blood 108: 685–696. 27. Bullinger L, Rucker FG, Kurz S, Du J, Scholl C, et al. (2007) Gene-expression
profiling identifies distinct subclasses of core binding factor acute myeloid leukemia. Blood 110: 1291–1300.
28. Eisele L, Klein-Hitpass L, Chatzimanolis N, Opalka B, Boes T, et al. (2007) Differential expression of drug-resistance-related genes between sensitive and resistant blasts in acute myeloid leukemia. Acta Haematol 117: 8–15. 29. Park MH, Cho SA, Yoo KH, Yang MH, Ahn JY, et al. (2007) Gene expression
profile related to prognosis of acute myeloid leukemia. Oncol Rep 18: 1395–1402.
30. Stapnes C, Ryningen A, Hatfield K, Oyan AM, Eide GE, et al. (2007) Functional characteristics and gene expression profiles of primary acute myeloid leukaemia cells identify patient subgroups that differ in susceptibility to histone deacetylase inhibitors. Int J Oncol 31: 1529–1538.
31. Wouters BJ, Jorda MA, Keeshan K, Louwers I, Erpelinck-Verschueren CA, et al. (2007) Distinct gene expression profiles of acute myeloid/T-lymphoid leukemia with silenced CEBPA and mutations in NOTCH1. Blood 110: 3706–3714.
32. Stirewalt DL, Meshinchi S, Kopecky KJ, Fan W, Pogosova-Agadjanyan EL, et al. (2008) Identification of genes with abnormal expression changes in acute myeloid leukemia. Genes Chromosomes Cancer 47: 8–20.
33. Mullighan CG, Kennedy A, Zhou X, Radtke I, Phillips LA, et al. (2007) Pediatric acute myeloid leukemia with NPM1 mutations is characterized by a gene expression profile with dysregulated HOX gene expression distinct from MLL-rearranged leukemias. Leukemia 21: 2000–2009.
34. Larsson O, Sandberg R (2006) Lack of correct data format and comparability limits future integrative microarray research. Nat Biotechnol 24: 1322–1323. 35. Cahan P, Rovegno F, Mooney D, Newman JC, St Laurent G, 3rd, et al. (2007)
Meta-analysis of microarray results: challenges, opportunities, and recommen-dations for standardization. Gene 401: 12–18.
36. Griffith OL, Melck A, Jones SJ, Wiseman SM (2006) Meta-analysis and meta-review of thyroid cancer gene expression profiling studies identifies important diagnostic biomarkers. J Clin Oncol 24: 5043–5051.
37. Chan SK, Griffith OL, Tai IT, Jones SJ (2008) Meta-analysis of colorectal cancer gene expression profiling studies identifies consistently reported candidate biomarkers. Cancer Epidemiol Biomarkers Prev 17: 543–552.
38. Smid M, Dorssers LC, Jenster G (2003) Venn Mapping: clustering of heterologous microarray data based on the number of co-occurring differentially expressed genes. Bioinformatics 19: 2065–2071.
39. Cahan P, Ahmad AM, Burke H, Fu S, Lai Y, et al. (2005) List of lists-annotated (LOLA): a database for annotation and comparison of published microarray gene lists. Gene 360: 78–82.
40. Newman JC, Weiner AM (2005) L2L: a simple tool for discovering the hidden significance in microarray expression data. Genome Biol 6: R81.
41. Rahmani M, Wong BW, Ang L, Cheung CC, Carthy JM, et al. (2006) Versican: signaling to transcriptional control pathways. Can J Physiol Pharmacol 84: 77–92.
42. Makatsori E, Lamari FN, Theocharis AD, Anagnostides S, Hjerpe A, et al. (2003) Large matrix proteoglycans, versican and perlecan, are expressed and secreted by human leukemic monocytes. Anticancer Res 23: 3303–3309. 43. Kanaoka Y, Urade Y (2003) Hematopoietic prostaglandin D synthase.
Prostaglandins Leukot Essent Fatty Acids 69: 163–167.
44. Guillemin R (2005) Hypothalamic hormones a.k.a. hypothalamic releasing factors. J Endocrinol 184: 11–28.
45. Joshi N, Johnson LL, Wei WQ, Abnet CC, Dong ZW, et al. (2006) Gene expression differences in normal esophageal mucosa associated with regression and progression of mild and moderate squamous dysplasia in a high-risk Chinese population. Cancer Res 66: 6851–6860.
46. Huang H, Hara A, Homma T, Yonekawa Y, Ohgaki H (2005) Altered expression of immune defense genes in pilocytic astrocytomas. J Neuropathol Exp Neurol 64: 891–901.
47. Slifman NR, Loegering DA, McKean DJ, Gleich GJ (1986) Ribonuclease activity associated with human eosinophil-derived neurotoxin and eosinophil cationic protein. J Immunol 137: 2913–2917.
48. Yang D, Rosenberg HF, Chen Q, Dyer KD, Kurosaka K, et al. (2003) Eosinophil-derived neurotoxin (EDN), an antimicrobial protein with chemotac-tic activities for dendrichemotac-tic cells. Blood 102: 3396–3403.
49. Domachowske JB, Bonville CA, Dyer KD, Rosenberg HF (1998) Evolution of antiviral activity in the ribonuclease A gene superfamily: evidence for a specific interaction between eosinophil-derived neurotoxin (EDN/RNase 2) and respiratory syncytial virus. Nucleic Acids Res 26: 5327–5332.
50. Shimamoto A, Kitao S, Ichikawa K, Suzuki N, Yamabe Y, et al. (1996) A unique human gene that spans over 230 kb in the human chromosome 8p11-12 and codes multiple family proteins sharing RNA-binding motifs. Proc Natl Acad Sci U S A 93: 10913–10917.
51. Kirchner J, Bevan MJ (1999) ITM2A is induced during thymocyte selection and T cell activation and causes downregulation of CD8 when overexpressed in CD4(+)CD8(+) double positive thymocytes. J Exp Med 190: 217–228. 52. Van den Plas D, Merregaert J (2004) In vitro studies on Itm2a reveal its
involvement in early stages of the chondrogenic differentiation pathway. Biol Cell 96: 463–470.
53. Van den Plas D, Merregaert J (2004) Constitutive overexpression of the integral membrane protein Itm2A enhances myogenic differentiation of C2C12 cells. Cell Biol Int 28: 199–207.
54. Hunt TW, Fields TA, Casey PJ, Peralta EG (1996) RGS10 is a selective activator of G alpha i GTPase activity. Nature 383: 175–177.
55. Appleton CT, James CG, Beier F (2006) Regulator of G-protein signaling (RGS) proteins differentially control chondrocyte differentiation. J Cell Physiol 207: 735–745.
56. Moratz C, Harrison K, Kehrl JH (2004) Regulation of chemokine-induced lymphocyte migration by RGS proteins. Methods Enzymol 389: 15–32. 57. Kim SD, Sung HJ, Park SK, Kim TW, Park SC, et al. (2006) The expression
patterns of RGS transcripts in platelets. Platelets 17: 493–497.
58. Eklund EA (2007) The role of HOX genes in malignant myeloid disease. Curr Opin Hematol 14: 85–89.
59. Andreeff M, Ruvolo V, Gadgil S, Zeng C, Coombes K, et al. (2008) HOX expression patterns identify a common signature for favorable AML. Leukemia. 60. Grubach L, Juhl-Christensen C, Rethmeier A, Olesen LH, Aggerholm A, et al. (2008) Gene expression profiling of Polycomb, Hox and Meis genes in patients with acute myeloid leukaemia. Eur J Haematol.
61. Drabkin HA, Parsy C, Ferguson K, Guilhot F, Lacotte L, et al. (2002) Quantitative HOX expression in chromosomally defined subsets of acute myelogenous leukemia. Leukemia 16: 186–195.
62. Kawagoe H, Humphries RK, Blair A, Sutherland HJ, Hogge DE (1999) Expression of HOX genes, HOX cofactors, and MLL in phenotypically and functionally defined subpopulations of leukemic and normal human hemato-poietic cells. Leukemia 13: 687–698.
63. Roche J, Zeng C, Baron A, Gadgil S, Gemmill RM, et al. (2004) Hox expression in AML identifies a distinct subset of patients with intermediate cytogenetics. Leukemia 18: 1059–1063.
64. Thompson A, Quinn MF, Grimwade D, O’Neill CM, Ahmed MR, et al. (2003) Global down-regulation of HOX gene expression in PML-RARalpha+acute promyelocytic leukemia identified by small-array real-time PCR. Blood 101: 1558–1565.
65. Giampaolo A, Sterpetti P, Bulgarini D, Samoggia P, Pelosi E, et al. (1994) Key functional role and lineage-specific expression of selected HOXB genes in purified hematopoietic progenitor differentiation. Blood 84: 3637–3647. 66. Voso MT, Scardocci A, Guidi F, Zini G, Di Mario A, et al. (2004) Aberrant
67. Hatfield KJ, Hovland R, Oyan AM, Kalland KH, Ryningen A, et al. (2008) Release of angiopoietin-1 by primary human acute myelogenous leukemia cells is associated with mutations of nucleophosmin, increased by bone marrow stromal cells and possibly antagonized by high systemic angiopoietin-2 levels. Leukemia 22: 287–293.
68. Tickenbrock L, Schwable J, Wiedehage M, Steffen B, Sargin B, et al. (2005) Flt3 tandem duplication mutations cooperate with Wnt signaling in leukemic signal transduction. Blood 105: 3699–3706.
69. Whitman SP, Ruppert AS, Radmacher MD, Mrozek K, Paschka P, et al. (2008) FLT3 D835/I836 mutations are associated with poor disease-free survival and a distinct gene-expression signature among younger adults with de novo cytogenetically normal acute myeloid leukemia lacking FLT3 internal tandem duplications. Blood 111: 1552–1559.
70. Lopez-Pedrera C, Villalba JM, Siendones E, Barbarroja N, Gomez-Diaz C, et al. (2006) Proteomic analysis of acute myeloid leukemia: Identification of potential early biomarkers and therapeutic targets. Proteomics 6 Suppl 1: S293–299.
71. Inoue K, Sugiyama H, Ogawa H, Yamagami T, Azuma T, et al. (1994) Expression of the interleukin-6 (IL-6), IL-6 receptor, and gp130 genes in acute leukemia. Blood 84: 2672–2680.
72. Liu ZJ, Zhang Y, Zhang XB, Yang X (2004) Abnormal mRNA expression of ASPP members in leukemia cell lines. Leukemia 18: 880.
73. Rusiniak ME, Yu M, Ross DT, Tolhurst EC, Slack JL (2000) Identification of B94 (TNFAIP2) as a potential retinoic acid target gene in acute promyelocytic leukemia. Cancer Res 60: 1824–1829.
74. Heuser M, Beutel G, Krauter J, Dohner K, von Neuhoff N, et al. (2006) High meningioma 1 (MN1) expression as a predictor for poor outcome in acute myeloid leukemia with normal cytogenetics. Blood 108: 3898–3905. 75. Okabe-Kado J (2002) Serum nm23-H1 protein as a prognostic factor in
hematological malignancies. Leuk Lymphoma 43: 859–867.
76. Ozeki K, Kiyoi H, Hirose Y, Iwai M, Ninomiya M, et al. (2004) Biologic and clinical significance of the FLT3 transcript level in acute myeloid leukemia. Blood 103: 1901–1908.
77. Geller RB, Zahurak M, Hurwitz CA, Burke PJ, Karp JE, et al. (1990) Prognostic importance of immunophenotyping in adults with acute myelocytic leukaemia: the significance of the stem-cell glycoprotein CD34 (My10). Br J Haematol 76: 340–347.
78. Fruchart C, Lenormand B, Bastard C, Boulet D, Lesesve JF, et al. (1996) Correlation between CD34 expression and chromosomal abnormalities but not clinical outcome in acute myeloid leukemia. Am J Hematol 53: 175–180. 79. Cheong JW, Eom JI, Maeng HY, Lee ST, Hahn JS, et al. (2003) Constitutive
phosphorylation of FKHR transcription factor as a prognostic variable in acute myeloid leukemia. Leuk Res 27: 1159–1162.
80. Kreuter M, Woelke K, Bieker R, Schliemann C, Steins M, et al. (2006) Correlation of neuropilin-1 overexpression to survival in acute myeloid leukemia. Leukemia 20: 1950–1954.
81. Xie P, Shen YF, Shi YP, Ge SM, Gu ZH, et al. (2008) Overexpression of glucosylceramide synthase in associated with multidrug resistance of leukemia cells. Leuk Res 32: 475–480.
82. Mrozek K, Marcucci G, Paschka P, Whitman SP, Bloomfield CD (2007) Clinical relevance of mutations and gene-expression changes in adult acute myeloid leukemia with normal cytogenetics: are we ready for a prognostically prioritized molecular classification? Blood 109: 431–448.
83. Sauvageau G, Thorsteinsdottir U, Hough MR, Hugo P, Lawrence HJ, et al. (1997) Overexpression of HOXB3 in hematopoietic cells causes defective lymphoid development and progressive myeloproliferation. Immunity 6: 13–22. 84. Thorsteinsdottir U, Sauvageau G, Hough MR, Dragowska W, Lansdorp PM, et al. (1997) Overexpression of HOXA10 in murine hematopoietic cells perturbs both myeloid and lymphoid differentiation and leads to acute myeloid leukemia. Mol Cell Biol 17: 495–505.
85. Kroon E, Krosl J, Thorsteinsdottir U, Baban S, Buchberg AM, et al. (1998) Hoxa9 transforms primary bone marrow cells through specific collaboration with Meis1a but not Pbx1b. Embo J 17: 3714–3725.
86. Perkins A, Kongsuwan K, Visvader J, Adams JM, Cory S (1990) Homeobox gene expression plus autocrine growth factor production elicits myeloid leukemia. Proc Natl Acad Sci U S A 87: 8398–8402.
87. Borrow J, Shearman AM, Stanton VP, Jr., Becher R, Collins T, et al. (1996) The t(7;11)(p15;p15) translocation in acute myeloid leukaemia fuses the genes for nucleoporin NUP98 and class I homeoprotein HOXA9. Nat Genet 12: 159–167.
88. Kamps MP, Murre C, Sun XH, Baltimore D (1990) A new homeobox gene contributes the DNA binding domain of the t(1;19) translocation protein in pre-B ALL. Cell 60: 547–555.
89. Hatano M, Roberts CW, Minden M, Crist WM, Korsmeyer SJ (1991) Deregulation of a homeobox gene, HOX11, by the t(10;14) in T cell leukemia. Science 253: 79–82.
90. Ulrich CM, Carlson CS, Sibert J, Poole EM, Yu JH, et al. (2005) Thromboxane synthase (TBXAS1) polymorphisms in African-American and Caucasian populations: evidence for selective pressure. Hum Mutat 26: 394–395. 91. Shen RF, Tai HH (1998) Thromboxanes: synthase and receptors. J Biomed Sci
5: 153–172.
92. Moussa O, Riker JM, Klein J, Fraig M, Halushka PV, et al. (2008) Inhibition of thromboxane synthase activity modulates bladder cancer cell responses to chemotherapeutic agents. Oncogene 27: 55–62.
93. Nasarre P, Kusy S, Constantin B, Castellani V, Drabkin HA, et al. (2005) Semaphorin SEMA3F has a repulsing activity on breast cancer cells and inhibits E-cadherin-mediated cell adhesion. Neoplasia 7: 180–189.
94. Karolchik D, Baertsch R, Diekhans M, Furey TS, Hinrichs A, et al. (2003) The UCSC Genome Browser Database. Nucleic Acids Res 31: 51–54.
95. Boyle EI, Weng S, Gollub J, Jin H, Botstein D, et al. (2004) GO::TermFinder– open source software for accessing Gene Ontology information and finding significantly enriched Gene Ontology terms associated with a list of genes. Bioinformatics 20: 3710–3715.