www.biogeosciences.net/10/327/2013/ doi:10.5194/bg-10-327-2013
© Author(s) 2013. CC Attribution 3.0 License.
Biogeosciences
Ammonia emissions from cattle urine and dung excreted on pasture
J. Laubach1, A. Taghizadeh-Toosi2,*, S. J. Gibbs3, R. R. Sherlock2, F. M. Kelliher4, and S. P. P. Grover1,** 1Landcare Research, Lincoln, New Zealand
2Department of Soil and Physical Sciences, Lincoln University, Lincoln, New Zealand 3Department of Agricultural Sciences, Lincoln University, Lincoln, New Zealand 4Ag Research, Lincoln Research Centre, Lincoln, New Zealand
*now at: Department of Agroecology, Aarhus University, Tjele, Denmark
**now at: Department of Civil Engineering, Monash University, Melbourne, Australia
Correspondence to:J. Laubach (laubachj@landcareresearch.co.nz)
Received: 30 August 2012 – Published in Biogeosciences Discuss.: 26 September 2012 Revised: 7 December 2012 – Accepted: 19 December 2012 – Published: 23 January 2013
Abstract.Twelve cattle were kept for three days in a circular area of 16 m radius on short pasture and fed with freshly-cut pasture. Ammonia (NH3) emissions from the urine and
dung excreted by the cattle were measured with a microme-teorological mass-balance method, during the cattle presence and for 10 subsequent days. Daily-integrated emission rates peaked on Day 3 of the experiment (last day of cattle pres-ence) and declined steadily for five days thereafter. Urine patches were the dominant sources for these emissions. On Day 9, a secondary emissions peak occurred, with dung pats likely to be the main sources. This interpretation is based on simultaneous observations of the pH evolution in urine patches and dung pats created next to the circular plot. Feed and dung samples were analysed to estimate the amounts of nitrogen (N) ingested and excreted. Total N volatilised as NH3 was 19.8 (±0.9) % of N intake and 22.4 (±1.3) %
of N excreted. The bimodal shape of the emissions time se-ries allowed to infer separate estimates for volatilisation from urine and dung, respectively, with the result that urine ac-counted for 88.6 (±2.6) % of the total NH3emissions. The
emissions from urine represented 25.5 (±2.0) % of the
ex-creted urine-N, while the emissions from dung amounted to 11.6 (±2.7) % of the deposited dung-N. Emissions from
dung may have continued after Day 13 but were not resolved by the measurement technique. A simple resistance model shows that the magnitude of the emissions from dung is con-trolled by the resistance of the dung crust.
1 Introduction
Ammonia (NH3) is generated at the soil surface, often in
abundant quantities, shortly following the surface application of any source of ammoniacal-N (NHx-N, combining NH3-N
and NH+4-N) that also induces an increase in soil-surface pH. Sources include urea and other ammoniacal fertilisers, am-moniacal wastes and ruminant urine (Sherlock et al., 1995). Such NH3is susceptible to volatilisation at rates which can
vary extensively depending on the crop, cultural conditions, soil properties, dung or urine deposition rates and method of fertiliser application: e.g. for urea from 1.7 % to 56 % of the applied N (Ryden et al., 1987; Jarvis et al., 1989; Sherlock et al., 1989, 2008), or for slurry from 4 % to over 60 % (Sinter-mann et al., 2012). Ammonia volatilisation from agricultural soils is a dominant factor in the formation of atmospheric secondary aerosols due to its reaction with nitric and sul-phuric acids in the atmosphere (Nemitz et al., 2009). These aerosols contribute to the formation of acid rain (Bobbink et al., 1992). Ammonia volatilisation decreases methane (CH4)
oxidation rates in soils (Mosier et al., 1997), and acts as an indirect source of nitrous oxide (N2O) when the NH3is
de-posited downwind onto land surfaces (van der Eerden, 1982; Bobbink et al., 1992; Barthelmie and Pryor, 1998). As NH3
is emitted, it is transported away from the soil surface by the wind both vertically and horizontally. These conditions are far removed from those typically experienced under labora-tory conditions and consequently emissions under field con-ditions can differ substantially from NH3volatilisation losses
Ammonia emissions can be measured under field condi-tions by micrometeorological methods. Laubach et al. (2012) compared several such methods to measure and model the NH3emissions from a circular plot of pasture soil, of 15 m
radius, which had been treated with dairy cow urine de-posited in a regular array of 132 “urine patches”. The treat-ment rate used simulated the urine amounts and number of urination events expected from a dozen dairy cows grazing that area for 24 h (thereby simulating a grazing time and stocking density that are typical for rotational grazing prac-tice on dairy farms in Canterbury, New Zealand). Laubach et al. (2012) concluded that of the tested methods, the mass-budget method was the most accurate. This method is applied in the experiment reported here, which represents a more re-alistic farming situation where the emissions from both urine and dung are measured as they are excreted by the cattle in situ. Similar experiments were conducted by Bussink (1992, 1994) in the Netherlands.
Apart from the practical challenges of handling live cattle around measurement equipment, an added difficulty of the in-situ approach is that neither the amounts of excreta de-posited, nor their N contents, can be controlled. These can, however, be estimated, provided the feed intake of the cattle is known. In order to control, measure and chemically char-acterise the feed intake in this experiment, the cattle were prevented from grazing by mowing the pasture prior to the start, and offering them grass that had been freshly harvested nearby (“cut and carry”). While the provision of feed as such resembles feedlot practice rather than grazing, the experi-mental setup differed from true feedlots in several important aspects: the feed composition provided was equal to that in a grazing situation, the excreta were deposited on pasture soil with short herbage cover and left to their natural decompo-sition processes, and the cattle were removed after 3 d, leav-ing the excreta undisturbed after that time while NH3
emis-sions were continuously measured until close to the resolu-tion limit of the measurement method.
The results of this experiment therefore quantify the com-bined effect of NH3emissions from urine and dung, in
con-ditions similar to a real rotational-grazing practice, and in weather conditions comparable to the experiment of Laubach et al. (2012). The observed emissions are further interpreted in the context of conversion processes in the dung, which were simultaneously investigated by analysing samples re-peatedly taken from dung pats that had been created in a con-trolled fashion.
2 Materials and methods
2.1 Site and schedule
The experiment was conducted in a paddock located 3 km south of Lincoln University, New Zealand (43◦40.45′S, 172◦28.22′E, 4 m a.s.l.). The soil was classified as a
Temple-ton silt loam (N. Smith and P. Almond, Lincoln University, personal communication, 2011). A circle with 16 m radius was fenced as the experimental plot and the pasture mown to ca. 5 cm height. For the first three days, 12 non-lactating cat-tle with average live-weight of 470 kg were kept in the exper-imental plot. The stocking density represented by this setup (150 animals ha−1) was typical for rotational grazing prac-tice in New Zealand, but the cattle-presence period was 3 to 6 times longer than the feed supply in a real-world grazing situation would normally last. This longer period was chosen so that a sufficient amount of urine and dung was deposited to produce a well-resolvable NH3emission signal. Implications
of the higher excreta density are discussed in Sect. 4.1. The cattle were excluded from an area of 1.4 m radius in the centre of the circle, where the NH3 samplers were
in-stalled. Meteorological and soil measurements (details be-low) were conducted outside the circle, ca. 40 m E of the cir-cle’s centre.
The start of the experiment was defined as the time when the cattle entered the fenced circle, at 16:05 LT on 8 March 2011. The cattle departed at 16:20 LT on 11 March, 3.01 d later, and the NH3measurements were discontinued in
the morning of 21 March, at 12.75 d.
2.2 Feed supply and analyses
The cattle were provided with freshly-cut pasture made up mainly from ryegrass (Lolium perenne) and white clover (Trifolium repens). The feed originated from a paddock nearby. It was provided ad libitum, twice daily, at 9:00 LT and 16:00 LT. The feed was laid out around the perimeter of the plot, to encourage the cattle to spread evenly across the area – which they did, judging from casual observation of their behaviour as well as from the distribution of dung pats, inspected after the cattle had left.
The offered feed was weighed. Feed samples were taken, dried, dry matter (DM) contents determined, and subsamples taken for chemical analysis. Prior to the morning feeding, any refused feed from the previous day was raked together and also weighed and its DM content determined. DM digestibil-ity was determined by near-infrared reflectance spectroscopy (NIRS). Total carbon (C) and nitrogen (N) in the grass sam-ples were obtained with an elemental analyser (Vario-Max CN, Elementar GmbH, Hanau, Germany), the samples being combusted at 900◦C in an oxygen atmosphere. This process converted any elemental C and N into CO2, N2 and NOx.
The NOxwas subsequently reduced to N2. The CO2and N2
2.3 Urine and dung measurements
In order to characterise the physical and chemical processes causing NH3emissions from the excreta, a few urine patches
and dung pats were created to measure pH and take sam-ples for laboratory analyses. These urine patches and dung pats were placed outside the circular cattle area, near the me-teorological sensors. On each of four subsequent afternoons, firstly when the cattle entered the circle and finally when they departed, one urine patch and two dung pats were created. The daily intervals were intended to represent the variabil-ity in the evolution of soil and weather conditions that the excreta produced by the cattle in the circle would have been subjected to, depending on their time of deposition.
The urine required had been collected at the Lincoln Uni-versity dairy farm and was stored at 4◦C until needed. The urine patches were created with the method of Laubach et al. (2012): for each patch, 1.5 L urine was poured from a plas-tic bottle into a funnel with bendable tubing attached to the outlet. The tubing outlet was at 1.2 m above ground, and the urine ran out within 15 to 20 s, covering a soil area of about 0.25 m2.
The dung was collected inside the experimental plot, from selected pats that appeared freshest, and then applied at the target location by filling a ring of 25 cm diameter that was placed on the ground, to a height of 3 to 5 cm. The ring was subsequently removed. Of each daily pair of dung pats, one was designated for surface pH measurements, the other for the removal of samples of the crust and the in-terior. Crust samples were taken daily, one from each of these four pats. Interior samples were taken from one pat per day, in triplicates, and the next pat the next day etc., so that effectively each pat was sampled every fourth day. Upon arrival in the lab, the dung crust and dung interior sam-ples were frozen, then weighed and placed in a freeze-dryer (FD 5.5, Cuddon Ltd., Blenheim, NZ) for 48 h. After that they were re-weighed and their gravimetric moisture contents were determined. The amounts of ammonium-N (NH+4-N), nitrite-N (NO−2-N), nitrate-N (NO−3-N) were obtained with a twin-channel flow injection analyser (FS 3000, Alpkem, Col-lege Station, TX, USA). Total C and N of dung subsamples were obtained with the same elemental combustion method as for the grass samples.
Since a hard hydrophobic crust formed quite rapidly on the dung pats, their surface pH was measured in the field, using a portable pH electrode (HI 9025, Hanna Instru-ments, Woonsocket, RI, USA) with a flat-surface electrode (Broadley-James, Irvine, CA, USA). Measurements were made in the middle of each daytime NH3collection period,
on the surface of one dung pat from each creation day (the one not used for taking samples) and also on the surface of each urine patch. Each measurement consisted of five repli-cate readings, taken at different locations on the surface. The pH of the dung interior was determined less frequently, using
the samples taken to the lab, with the same portable electrode as in the field.
2.4 Meteorological and soil measurements
Wind speed was measured by five cup anemometers (A101M, Vector Instruments, Rhyl, Co. Clwyd, UK) with matched calibrations. They were installed at five sampling heights, 0.25, 0.50, 0.75, 1.25 and 2.10 m above the ground on a mast 40 m E of the circle’s centre. Rainfall was recorded by a tipping-bucket rain gauge (Ogawa Seiki, Tokyo, Japan) with a resolution of 0.167 mm. Soil temperature was mea-sured by thermocouples buried at two depths (2 and 5 cm), in two replicates, near the wind profile mast. Soil moisture was monitored continuously with five water content reflectome-ters (CS-616, Campbell Scientific, Logan, UT, USA). These were buried horizontally, four of them at 2 cm depth, one un-der each urine test patch, and one at 5 cm depth in urine-free soil. The soil moisture data were corrected for temperature in post-processing. All meteorological variables were recorded by a datalogger (CR-3000, Campbell Scientific, Logan, UT, USA), as 10-min averages.
2.5 Ammonia collection and mass-budget method
NH3emission rates were determined with the
micrometeoro-logical mass-budget method (Beauchamp et al., 1978; Den-mead, 1995). In the centre of the fenced circle, vertical pro-files of the horizontal NH3flux were measured with
“Leun-ing samplers” (Leun“Leun-ing et al., 1985). These devices have a vertical rotation axis that allows them to point into the wind and respond quickly to wind direction changes, similar to a wind vane. As air passes continuously through a sampler, the NH3content of that air is completely removed by
reac-tion with a solid oxalic acid coat. This coat must be applied to a complex array of internal surfaces prior to sampling. At the end of the sampling period, the sampler needs to be exchanged for an identical one in order to continue collec-tion, while the reaction product, (NH4)2C2O4 (ammonium
oxalate), is retrieved in the lab by a discharging procedure (described in Laubach et al., 2012) and converted to NHxin
aqueous solution.
NH3 samplers were installed at the same five heights as
the cup anemometers. A simple mass budget is constructed in the atmospheric surface layer, for the vertical plane that contains the measurement mast and is aligned with the wind direction. In this mass budget, all the NH3gas carried
on one of four masts that had been placed to the NW, NE, SE and SW, whichever suited best the anticipated wind direction. Further details concerning the evaluation of the NH3profiles
and subsequent computation of the NH3 emission rate are
given in Laubach et al. (2012) and in the Supplement. Nighttime NH3 collection periods were 14 to 16 h long.
During the cattle presence and the following two days, day-time collection periods lasted 4 h. They were increased to 5 h for the next two days and then to a single day-time period, between 7 and 8 h long, for three days. The final collection period lasted 64 h (three nights and the two intervening days).
2.6 Ammonia analysis
Solutions extracted from the NH3 samplers were initially
analysed with an ion-specific electrode (ISE-10-10-00, HNU Systems, Newton, MA, USA), as in Laubach et al. (2012). However, the subsequently computed NH3 emission rates
were unexpectedly high. A few NH3subsamples were then
re-analysed by two different methods, on a flow injection analyser (FIA, the same as for the dung analyses) and on a clinical chemistry analyser (Daytona LT090, Randox Ltd., Crumlin, Co. Antrim, Northern Ireland). Both these methods confirmed that the prepared NH3standards for the electrode
were correct, and both indicated that the field-collected NH3
concentrations were by a factor 2 to 3 smaller than deter-mined by the NH3 electrode calibrated against these
stan-dards. From considerations detailed in the Appendix, it was concluded that the electrode was strongly sensitive to the presence of volatile amines, which were probably eructated by the cattle.
Subsamples from all NH3 collections were thus
re-analysed in a single batch on the clinical chemistry analyser (CCA). This instrument uses an enzymatic reaction to strip all NH3from the test solution and measures the difference in
UV absorbance at 340 nm before and after the reaction. The precision of this method is specified by the manufacturer as 1 to 4 % of the absolute reading (range-dependent). This is comparable to the 2.3 % relative error estimated for the NH3
electrode (Laubach et al., 2012). However, the detection limit is a factor 20 larger than for the electrode, which is likely to affect the accuracy of the samples collected at the upper heights towards the end of the experiment, and the upwind background samples throughout.
As an additional check, two selected samples were anal-ysed for their total Kjeldahl nitrogen content (Hill Laborato-ries, Hamilton, New Zealand).
3 Results
3.1 Soil and weather conditions
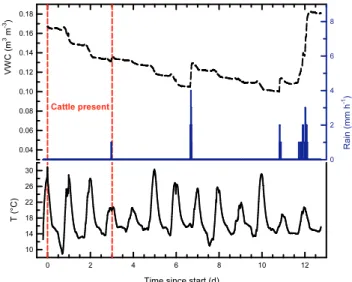
Some rain fell prior to the experiment, on 5 and 6 March, and the soil dried from 0.17 to 0.10 m3H2O (m3soil)−1
dur-ing the first week of measurements (Fig. 1). Only a negligible
7LPHVLQFHVWDUWG 7 & 9 : & P P 5 D LQ P P K &DWWOHSUHVHQW
Fig. 1.Temporal evolution of volumetric water content (top) and soil temperature (bottom) at 2 cm depth, as well as rainfall intensity (centre). The origin of the time axis is at 16:05 LT on 8 March 2011, when the cattle entered the circular plot.
soil moisture increase was observed when 0.3 mm of drizzle fell at 2.98 d, just before the cattle departed. Rain events that noticeably increased soil moisture occurred on three occa-sions: 3 mm at 6.66 to 6.72 d after the start of the experiment, 1 mm at 10.81 to 10.88 d, and 5 mm intermittently between 11.72 and 12.11 d. Soil moisture measured under the urine test patches increased by 0.03 m3H2O (m3soil)−1
immedi-ately after their creation and gradually decreased towards background soil moisture over several days.
Soil temperature at 2 cm depth reached afternoon max-ima of 31, 28 and 27◦C on the start day and the following two days, respectively, favouring rapid urea hydrolysis in the freshly deposited excreta. The day of the cattle departure and the next day were overcast and cooler, with soil tempera-ture maxima of 20◦C. Peaks on the following four days were again above 25◦C. Nocturnal minima varied between 9 and 16◦C, and overall mean soil temperature of the 13 days of measurement was 18◦C, both at 2 cm and 5 cm.
3.2 Estimation of nitrogen deposited with the excreta
The total grass weight offered to the group of cattle on each of the 6 feeding occasions varied between 419 and 546 kg. The DM content was around 14 % in the morn-ings and 16 % in the afternoons (overall mean±SE was 15.2±0.5 %). This resulted in a total DM offered of 446 kg, of which 67 kg were refused. Each animal consumed 10.53 (±0.35) kg DM per day on average. Nitrogen content
as a fraction of DM was determined for each feeding oc-casion, as 2.59 (±0.07) % (mean±SE). The total N intake
throughout the 3-d period was thus 9.81 (±0.42) kg,
repre-senting 0.273 (±0.012) kg N d−1animal−1. Some of this N
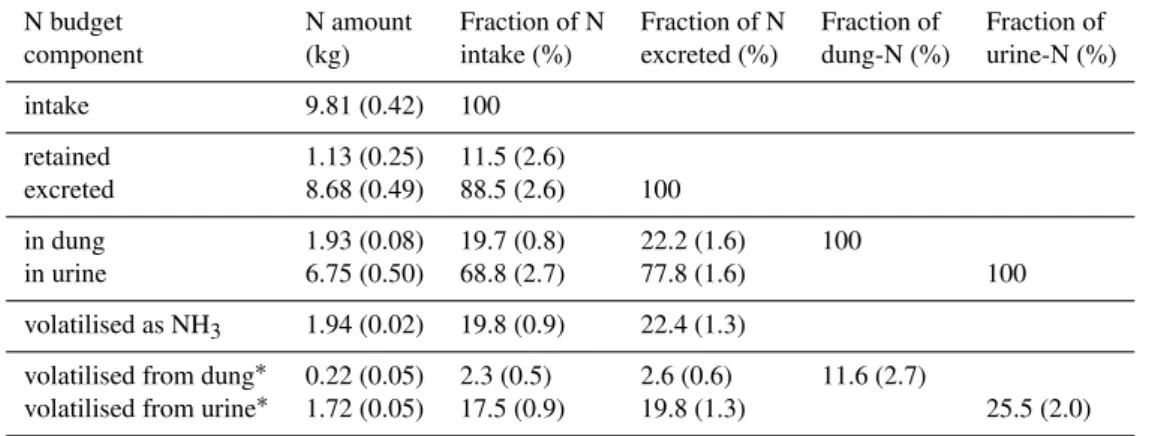
Table 1.Amounts of nitrogen fed, deposited and volatilised as well as their ratios. Uncertainties (in parentheses) are propagated standard errors.
N budget N amount Fraction of N Fraction of N Fraction of Fraction of
component (kg) intake (%) excreted (%) dung-N (%) urine-N (%)
intake 9.81 (0.42) 100
retained 1.13 (0.25) 11.5 (2.6)
excreted 8.68 (0.49) 88.5 (2.6) 100
in dung 1.93 (0.08) 19.7 (0.8) 22.2 (1.6) 100
in urine 6.75 (0.50) 68.8 (2.7) 77.8 (1.6) 100
volatilised as NH3 1.94 (0.02) 19.8 (0.9) 22.4 (1.3)
volatilised from dung∗ 0.22 (0.05) 2.3 (0.5) 2.6 (0.6) 11.6 (2.7)
volatilised from urine∗ 1.72 (0.05) 17.5 (0.9) 19.8 (1.3) 25.5 (2.0)
∗The urine–dung split was not measured, but inferred by plausibility arguments from the temporal evolution of the volatilisation rates
and the pH observations (see Sect. “Discussion”).
(LW) gain, the balance was excreted as urine and dung (since the cattle were non-lactating). These N amounts are esti-mated as follows, and summarised in Table 1.
The amount of dung excreted can be estimated as a frac-tion of DM intake, where the fracfrac-tion equals 100 % mi-nus digestibility. The DM digestibility of the pasture was 80.3 (±0.6) % (mean±SE of 6 feeding occasions), which
gives the total dung DM as 74.7 (±2.5) kg. The N content
of dung DM is assumed to be in proportion to the N con-tent in the feed DM, thus taken as 2.59 % of dung DM. (This fraction is corroborated by measurements of the ini-tial N fractions in the four dung pats created on the start day and the following three afternoons, which ranged from 2.10 % to 2.88 %.) Hence, the deposited amount of dung-N was 1.93 (±0.08) kg.
It is estimated that each animal gained on average 1.25 (±0.25) kg LW per day, based on reference tables for nutritional requirements (Agricultural Research Council, 1980). For 12 cattle over 3 d, this amounts to 45 (±9) kg LW
gain. The amount of N retained in the weight gain is as-sumed to be 2.5 (±0.25) % of that (default value used by
the Helsinki Commission of the European Union), result-ing in a total of 1.13 (±0.25) kg N retained. This represents
11.5 (±2.6) % of the N intake.
Subtracting dung-N and N retained from the total N in-take provides an estimate of the N amount deposited with urine, of 6.75 (±0.50) kg. This represents a daily per-capita
excretion of 0.188 (±0.014) kg N d−1animal−1. Combining
urine-N and dung-N, the total amount of excreted N was 8.68 (±0.49) kg, equivalent to an average application den-sity of 111 kg ha−1. Urine accounted for 77.8 (±1.6) % and
dung for 22.2 (±1.6) % of the excreted N.
3.3 Ammonia emissions
The evolution of NH3-N emission rates is shown in Fig. 2,
along with the mean N excretion rates, estimated as the
'
1
'
W
J
K
WRWDO1H[FUHWHGNJ
7LPHVLQFHVWDUWG
'
1
'
W
J
K
WRWDO1YRODWLOLVHGNJ
Fig. 2. Temporal evolution of N excretion rate of 12 cattle dur-ing their 3-day presence, estimated as the difference of N intake and N retained (top), and NH3-N volatilisation rate (bottom). Error bars for the latter represent estimated measurement uncertainty and are placed at the mid-times of the NH3collection periods, whose lengths are marked by the horizontally constant parts of the con-necting solid line.
12.6 and 12.0 µg N m−2s−1. After the cattle had departed,
emission rates stayed high for another day. For the remaining 9 days, volatilisation rates generally decreased. The residual emission rate over the final collection period, from 10.07 d to 12.75 d, was only 0.65 g N h−1, one magnitude less than emission rates of the first week.
The total amount of NH3-N volatilised was 1.94 kg N, with
a cumulative propagated standard error of 0.02 kg N, com-puted as described in Laubach et al. (2012). This represents 19.8 (±0.9) % of the cattle’s N intake and 22.4 (±1.3) % of
the N excreted (Table 1). Expressed per area, the N loss was 24.7 kg ha−1.
3.4 Evolution of pH in urine patches and dung pats
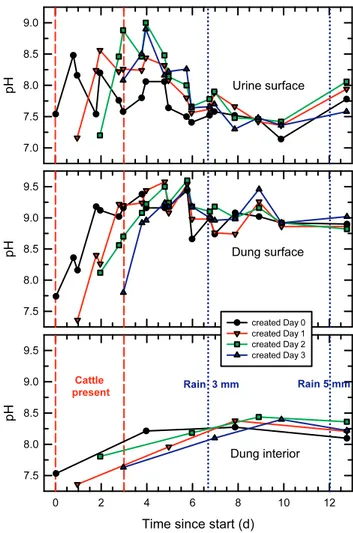
Figure 3 shows the evolution of the pH at the urine patch and dung pat surfaces and inside the dung pats, with separate symbols for each individual patch or pat (created on succes-sive days). For each urine patch, the maximum soil surface pH, between 8.5 and 9.0, occurred one day after its creation, indicating the completion of urea hydrolysis. After that, the pH decreased steadily while NH3 volatilisation rates were
high (Fig. 2). Six days after the start, the pH had fallen to below 7.7 for all patches. The two major rainfall events, with 3 mm and 5 mm yield, caused temporary increases in urine patch surface pH and synchronised the subsequent pH evo-lution for all four patches. It is unclear, though, whether the rain events had any significant impact on the NH3emissions.
Initial pH values at the dung pat surfaces were between 7 and 8, as at the urine patch surfaces (Fig. 3, middle panel). They then rose more slowly than in the urine and peaked 3 to 4 d after the dung pat’s creation, at a consistent value of 9.5 (±0.1). After that, the dung surface pH decreased slowly and steadily, except that all pats showed a secondary peak, 8 d after the start for the oldest pat and 9 d after the start for the others (representing ages of 6 to 8 d for them). Dung sur-face pH at the end of the experiment was still elevated, at 8.8 (±0.2), and consistent between pats.
For each dung pat, the interior pH (Fig. 3, bottom panel) was consistently lower than the surface pH, and it rose more slowly, peaking about 7 d after the pat’s creation (the exact timing is somewhat uncertain because samples from the same pat were only taken every 3 or 4 d). All four pats were sam-pled at the end of the experiment and showed an interior pH of 8.4 (±0.2), still markedly above neutral.
3.5 Moisture and mineral N of dung samples
The dung-interior samples contained 66 to 89 % water on a mass basis (mean±SE of 48 samples: 82.7±0.6 %), and
moisture did not show a trend over time, which means there was plenty of dung solution available throughout. The wa-ter content of the dung-crust samples showed no clear trend either. It was significantly lower than in the interior but also more variable, from 8 to 82 % (mean±SE of 37 samples was
S
+
7LPHVLQFHVWDUWG
S
+
FUHDWHG'D\ FUHDWHG'D\ FUHDWHG'D\ FUHDWHG'D\
S
+
&DWWOH
SUHVHQW 5DLQPP 5DLQPP
8ULQHVXUIDFH
'XQJVXUIDFH
'XQJLQWHULRU
Fig. 3. Temporal evolution of pH on urine patch surfaces (top panel), dung pat surfaces (middle) and inside dung pats (bottom). The period of cattle presence is indicated by vertical dashed lines, and the two rain events with more than 1 mm yield are marked by dotted lines.
49.7±2.8 %). The variability may partly stem from
incom-plete separation of dung interior material sticking to the crust sample.
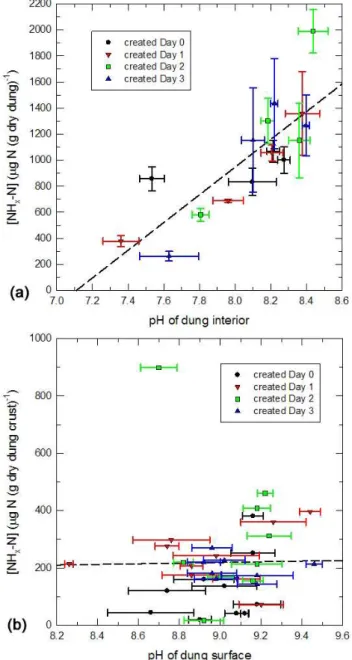
The NHx-N content of the dung interior was significantly
correlated to pH measured in the same samples (Fig. 4a), while [NO−2-N] and [NO−3-N] of the dung interior were not significantly correlated to pH (R2=0.08 for either species, not shown). For the dung crusts, neither [NHx-N] (Fig. 4b)
nor [NO−2-N] nor [NO−3-N] correlated to pH.
4 Discussion
4.1 Ammonia loss fractions
The extent of NH3volatilisation from dung tends to be much
Fig. 4. (a)NHx-N concentration in samples from the dung interior versus pH of the same samples. The different dung pats are identi-fied by different symbols (same as in Fig. 3). Error bars mark stan-dard errors of the mean of 3 replicates. The dashed line represents linear regression (R2=0.66).(b)Same for NHx-N concentration of dung-crust samples versus pH on the dung surface (mean of 5 repli-cates). The linear regression hasR2=0.0003.
1987) and Finland (Saarij¨arvi et al., 2006) and 4.5 % from chamber studies carried out in New Zealand (Sugimoto et al., 1992). The proportion of total urinary-N volatilised as NH3-N is typically 10 to 40 %, with the higher values during
warm summer conditions and the lower values in the cooler seasons (Ball et al., 1979; Whitehead et al., 1989; White-head and Raistrick, 1991, 1992; Bol et al., 2004). In New Zealand, Sherlock and Goh (1984) measured NH3-N
emis-sions for urine-treated plots of 22.2 %, 24.6 %, and 12.2 % of total urinary-N in summer, autumn, and winter, respectively. The total N losses from urine and dung combined are there-fore most likely of order 10 to 30 %. The present result of 22.4 % N loss falls into this range, yet the range of reported measurements is even wider, from 3 to 52 % (Petersen et al., 1998).
Past experiments similar to the present one were under-taken by Bussink (1992, 1994), with cattle grazing circular plots repeatedly over the course of a year, and fertilisation of the pasture following each grazing occasion. There, the N loss fractions for summertime grazing events were of order 15 % only, and in the cooler seasons they were less than 10 %. The N excretion rate (urine and dung combined) reported by Bussink (1992, 1994) was typically 40 to 80 kg ha−1, roughly
half of that in the present experiment. The excreta density in the latter was higher because of the unrealistically long pe-riod of animal presence. A consequence of this was an in-creased probability for urine and dung being co-deposited in the same location, which could have increased the rate of urea hydrolysis because of the interaction of urinary urea and faecal urease. This probability can be estimated from the re-spective number of urinations and defecations and the aver-age dung pat size. An approximate count of dung pats, after the cattle had departed, gaveN=445 (±23). Dung pat size
was not measured and is guessed as a=0.1 m2. Given the
fenced surface areaA=785 m2, the dung cover fraction was
thusp=N a/A=0.057. This is the probability for a single
urination to occur in a defecation’s location (regardless of the timing of both events). For cattle, urination counts are typi-cally about 80 % of defecation counts (Haynes and Williams, 1993; White et al., 2001), which gives an estimated total of 356 urinations. Using the binomial probability distribution, it results that the most likely number of urine patches being located with a dung pat was 20. The occurrence of 20 co-locations would imply that 5.6 % of all urine-N and 4.5 % of all dung-N was potentially subject to interaction with each other. However, even if such interaction altered the volatili-sation rate considerably (e.g. doubled it), the effect of that on the total N volatilised would still be small (of order 5 %).
Bussink (1994) showed for his data that on an annual basis, the amount of N lost as NH3 increased more than
linearly with increasing amount of N applied. Hence, the higher N application rate in the present experiment may have been a cause for the N volatilisation rate to be higher than in Bussink’s studies. However, when Laubach et al. (2012) mimicked a realistic urine application pattern for grazing cattle, the NH3 loss amounted to 25.7 (±0.5) % of the
N applied in addition to already high N levels would be volatilised. The present results are compatible with this find-ing.
4.2 Contributions of urine and dung to ammonia
volatilisation
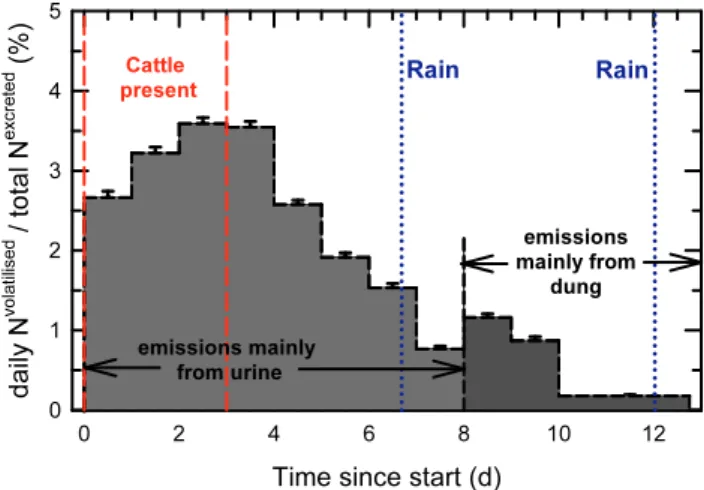
In the present experiment, the daily N losses increased dur-ing the first 3 d, while excreta were bedur-ing voided onto the ex-perimental plot, and then decreased during the following 5 d. This pattern was unambiguously explained by the dominance of volatilisation from urine, which provided the major part of all deposited N. On Days 9 and 10 of the experiment, though, the NH3volatilisation was larger than on Day 8 (Fig. 5). This
secondary maximum in the NH3loss trajectory occurred at
the same time that the pH of the dung interior reached its overall maximum, and the pH of the dung surface attained a secondary maximum (Fig. 3). It thus appears plausible that the secondary maximum in NH3 emissions on Day 9 was
caused by volatilisation from dung, and that dung emissions also provided the dominant contribution to N loss thereafter. Similar bimodal curves of NH3 emissions over time were
obtained by Jarvis et al. (1989) in experiments on grazed paddocks, and by Kellems et al. (1979) in laboratory experi-ments with various mixtures of cattle urine and dung, where the larger and earlier peak increased with increasing urine content and the smaller and later peak with increasing dung content. Sugimoto et al. (1992) measured NH3volatilisation
rates from dung and found that they peaked after 15 d when wet and after 20 d when dry, during cooler conditions than in the present experiment. This supports the interpretation that a peak in dung emissions at about 9 d in the current experi-ment was plausible. It also suggests that volatilisation from dung probably continued at low levels after 13 d, but sam-pling ceased then because the collected NH3 amounts
ap-proached the resolution limit of the method.
In Fig. 5, the transition between the NH3emissions mainly
from urine to those mainly from dung is indicated by a ver-tical dashed line at 8 d. In reality there is an overlap of the two modes, but for budgeting purposes this is ignored here and it is assumed that all emissions before this time orig-inate from urine, and all emissions thereafter from dung. The former amount to 1.72 kg N and the latter to 0.22 kg N, with an uncertainty estimated as 0.05 kg N for either, to ac-count for the crude separation method. This implies that 88.6 (±2.6) % of the volatilised N originated from urine, an even larger fraction than the urine fraction of the deposited N (77.8 %). Relative to the total N excreted, the emissions from urine and dung represent 19.8 % and 2.6 %, respec-tively (Table 1). Relative to the amounts of urine-N and dung-N, of 6.75 kg and 1.93 kg, respectively, they represent loss rates of 25.5 (±2.0) % from urine and 11.6 (±2.7) % from
dung. The value for urine agrees with that from Laubach et al. (2012), obtained in similar weather conditions. The value for dung exceeds the numbers cited at the start of Sect. 4.1,
7LPHVLQFHVWDUWG
G
D
LO\
1
Y
R
OD
WL
OLV
H
G
W
R
WD
O
1
H
[
F
UH
WH
G
&DWWOH
SUHVHQW 5DLQ 5DLQ
HPLVVLRQVPDLQO\ IURPXULQH
HPLVVLRQV PDLQO\IURP
GXQJ
Fig. 5.Day-to-day evolution of N loss fraction due to volatilisation, relative to the amount of N excreted by 12 cattle over the first 3 days. The vertical dashed line at 8 d marks when N loss rates cease to be dominated by volatilisation from urine, and emissions from dung probably begin to constitute the major fraction. The times of the two rain events with more than 1 mm yield are marked by dotted lines.
but may still be an underestimate because it potentially ex-cludes emissions after 13 d. Nevertheless, it is less than half the loss rate for urine, hence for refined NH3inventories it
may be justified to define different emission factors for urine and dung.
Even though the urine–dung split inferred here is only based on plausibility arguments, there is no doubt that the ab-solute amounts of N volatilised from urine are typically one magnitude larger than those from dung. After 6 d, the soil surface pH had fallen to below 7.7 for all urine patches. By this time, the area-integrated NH3emission rate had dropped
to less than 10 g N h−1 (Fig. 2), and 79 % of all observed emissions had occurred. The main trends for urine patch sur-face pH and NH3emissions are thus correlated, as has been
shown previously (Laubach et al., 2012).
4.3 Processes controlling the volatilisation from urine and dung
The essential steps for NH3volatilisation from dung are the
same as in urine-treated soil, namely: an elevation in the pH of the volatilisation surface, NH+4 formation in the liquid phase, equilibrium transition of that NH+4 into NH3 in the
gas phase, and its diffusion through a porous medium into the atmosphere.
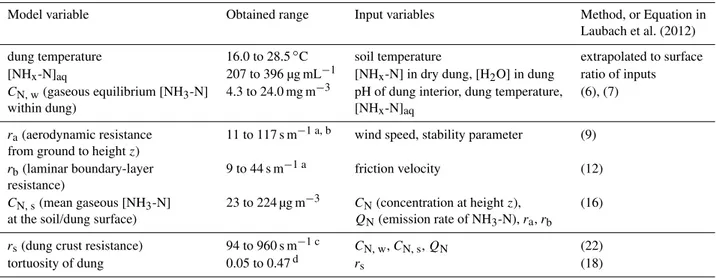
Table 2.Estimation of variables required for a resistance-model description of the NH3volatilisation from dung pats, analogous to that for urine-treated soil patches by Laubach et al. (2012), for Days 6 to 13.
Model variable Obtained range Input variables Method, or Equation in
Laubach et al. (2012)
dung temperature 16.0 to 28.5◦C soil temperature extrapolated to surface
[NHx-N]aq 207 to 396 µg mL−1 [NHx-N] in dry dung, [H2O] in dung ratio of inputs
CN, w(gaseous equilibrium [NH3-N] 4.3 to 24.0 mg m−3 pH of dung interior, dung temperature, (6), (7)
within dung) [NHx-N]aq
ra(aerodynamic resistance 11 to 117 s m−1 a, b wind speed, stability parameter (9)
from ground to heightz)
rb(laminar boundary-layer 9 to 44 s m−1 a friction velocity (12)
resistance)
CN, s(mean gaseous [NH3-N] 23 to 224 µg m−3 CN(concentration at heightz), (16)
at the soil/dung surface) QN(emission rate of NH3-N),ra,rb
rs(dung crust resistance) 94 to 960 s m−1 c CN, w,CN, s,QN (22)
tortuosity of dung 0.05 to 0.47d rs (18)
aDepends on roughness length, assumed as 0.02 m. bIncreases with height (maximum range given). cDepends on dung cover fraction, assumed as 0.057.
dDepends on dung crust thickness, assumed as 1 mm.
hydrolysis is often already completed at the time of appli-cation. As volatilisation proceeds, a subsequent reduction in surface pH occurs as a consequence of the chemical trans-formation of NH+4 to NH3 with the accompanying release
of a proton into the soil solution. This re-acidifies the soil surface and after some time a surface soil pH arises which is inadequate to sustain further NH3volatilisation (Sherlock
and Goh, 1985). In the present experiment, that time was ap-proximately 8 d.
In the case of dung pats, the initial rise in dung-surface pH is not due to urea hydrolysis since dung contains little or no urea (Ryden et al., 1987; Kirchmann and Lundvall, 1998). Instead the rise in pH is readily explained by the transforma-tion of the bicarbonate ion, HCO−3, into CO2(Sommer and
Sherlock, 1996). In contrast to the transformation of NH+4 to NH3, which releases a proton, the transformation of HCO−3
into CO2 releases a hydroxyl ion (OH−)into the dung pat
thereby increasing its pH. Despite a lack of urea hydrolysis, dung contains some NHx. In the dung interior, its
concentra-tion ranged from 263 to 1990 µg N (g dry dung)−1(Fig. 4a), with a mean of 1024 µg N (g dry dung)−1. The latter value represented only 4 % of the total N content of the dung, and the estimated N release from dung over 13 d was 3 times larger, which means new NHxmust have been formed in the
dung on a time scale of days, rather than hours, compara-ble to the time scale of the volatilisation process. A complete model of the dynamics of volatilisation from dung (not de-rived in this study) must therefore include the chemistry of NHxformation.
In the dung interior, [NHx-N] was positively correlated
to pH (R2=0.66, Fig. 4a), almost as strongly as it was
in the urine-patch soil samples of Laubach et al. (2012), whereR2=0.77. Such a high correlation between pH and [NHx-N] in dung was also reported by Kirchmann and
Lund-vall (1998). The regression line in Fig. 4a has a slope of 1064 µg N (g dry dung)−1per pH unit and predicts vanish-ing [NHx-N] at a pH of 7.1, i.e. for near-neutral solution.
To-gether with the high moisture content, these data suggest that the dung pats contained all necessary ingredients to build up considerable NH3volatilisation potential. The actual
volatil-isation rate was controlled by the permeability of the solid dung crust, discussed next.
4.4 Resistance of the dung crust to NH3exchange
Laubach et al. (2012) employed a simple resistance model to understand the dynamics of NH3 volatilisation from
urine-treated soil. Considering a dung pat as a porous medium, similar to the topsoil layer, the same physical principles can be applied to describe its exchange of matter with the at-mosphere. To be meaningful, this approach is restricted here to the time period when emissions from urine did not over-whelm emissions from dung, i.e. from Day 6 onwards when dung pH exceeded urine pH (Fig. 3).
The model comprises three sequences of steps (Table 2). The first task is to compute the gaseous equilibrium NH3
concentration in the dung interior, from pH, temperature, and aqueous [NHx-N] in the dung. The pH was measured in
trip-licate (Fig. 3). Dung temperature was estimated by extrapo-lating the soil temperatures from two depths towards the sur-face. The value of [NHx-N]aqwas taken as the ratio of NHx
and H2O contents of the dung samples. This assumes that all
in the moisture content of the dung, which may be an over-estimate. The resulting gaseous equilibrium [NH3-N] ranges
from 4300 to 24 000 µg m−3, typically with 20 % uncertainty
(assuming 1 K temperature error and including sampling er-rors of the other inputs).
The second task is to compute the atmospheric resistance and then use it, together with the measured NH3 emission
rate and NH3 concentrations in the air, to infer the spatial
average of [NH3-N]gat the soil (and dung) surface. The
at-mospheric resistance consists of an aerodynamic (turbulent) part,ra, and a laminar-boundary-layer part,rb. Both depend
on roughness length, derived as 2 cm from the wind profiles, and both decrease with increasing wind speed. Here, typi-cal values found for ra+rb were 50 to 80 s m−1, and the
resulting [NH3-N]g at the soil surface ranged from 23 to
224 µg m−3.
The third task is to use the measured NH3 emission rate
and the concentration difference between inside and outside of the dung crust to derive a dung crust resistance,rs. For
this to be accurate, it would be necessary that NH3
emis-sions from urine had ceased. As this is not strictly true, the result should be interpreted as a magnitude estimate only. Further, the equilibrium concentration needs to be scaled with the area fraction within the circle covered by dung pats, which was estimated in Sect. 4.1 asp=0.057. Multiplying
the equilibrium concentration from above bypgives 240 to 1400 µg m−3, which is a factor 3 to 12 larger than [NH3-N]g
at the soil surface. With this,rsis obtained as 94 to 960 s m−1.
This is the same magnitude as the value of 119 s m−1found by Olesen and Sommer (1993) for the resistance of a thin surface crust on slurry tanks.
Sincers was 2 to 20 times larger thanra+rb, the dung
crust provided the dominant resistance to volatilisation. As-suming a typical thickness of about 1 mm, the tortuosity of the dung crust can be estimated fromrs. This gives the
fol-lowing values for Days 6, 7, 8, 9, 10, and 13, respectively: 0.21, 0.47, 0.11, 0.14, 0.08, and 0.05. All but the second value are within the range obtained for the soil in the ex-periment of Laubach et al. (2012), suggesting that the dung crust can indeed be modelled as a porous medium similar to soil. The drop in tortuosity over the last days corresponds with wetting by rain, which provides a plausible mechanism by reducing the air-filled pore space in the dung crust.
It is thus possible to understand the dynamics of the dung volatilisation with the resistance model. For the present ex-periment, the values in Table 2 should be taken as order-of-magnitude indications, given the various sources of uncer-tainty for some of the required parameters.
5 Concluding remarks
In two experiments, one with a regular urine-patch pat-tern deposited onto pasture (Laubach et al., 2012), the other with cattle excreta in situ, the observed NH3
emis-sion rates were consistent with each other, and also with emission rates found elsewhere in similar weather condi-tions. Expressed as fractions of deposited nitrogen, the N losses were 25.7 (±0.5) % from the urine-patch pattern, and
22.4 (±1.3) % from the cattle excreta. As both experiments
were conducted at the warmest time of the year, the emission rates were at the upper end of the range likely to occur in New Zealand.
The second experiment, reported here, also investigated some aspects of the dung processes that were different to those in urine patches. Over time the pH in the dung interior increased above 8 and was positively correlated with [NHx
-N], creating conditions conducive to volatilisation. To some degree this volatilisation occurs, though it is slowed down by the presence of the dung crust, providing a resistance to gaseous exchange between dung interior and the ambient air that is about one magnitude larger than the atmospheric re-sistances. In effect, the fractional loss of N from dung is less than half that from urine. Here, quantification of separate volatilisation rates for urine and dung was only by inference from the bimodal shape of the emissions time series; yet this inferred result is fully corroborated by the literature cited in Sects. 4.1. and 4.2.
Appendix A
Sensitivity of ammonia electrode to volatile amines
As mentioned in Sect. 2.6, the NH3concentrations in the
ex-tracted solutions measured with the NH3electrode exceeded
those measured with the CCA systematically by a factor 2 to 3. The CCA results appeared plausible and were confirmed by comparison to those obtained using an FIA. This suggests that the electrode measurements were subject to an unantici-pated analytical artefact, possibly interference by other basic compounds. Volatile amines (VA) are plausible candidates for this, as they are known to be emitted from animal hus-bandry (Schade and Crutzen, 1995). Indeed, the independent N analysis of two samples (Hill Laboratories, Hamilton, New Zealand) found that total Kjeldahl-N exceeded NHx-N
sig-nificantly, by 20 % and 100 %, respectively. Evidently, some non-NHx-N compounds must have been present, which may
have been VA. If the cattle or their dung emitted VA, these would have been collected by the NH3samplers and then, in
the extracted solution, could have biased the electrode read-ing just as if additional NH+4 ions had been present. Such a bias could not have occurred in earlier experiments with urea fertiliser and urine patches (Sherlock et al., 1995; Laubach et al., 2012), because there were no potential sources of VA at the respective sites.
According to Schade and Crutzen (1995), trimethylamine (TMA) is the dominant VA component emitted. Kuhn et al. (2011) investigated the co-emissions of TMA and NH3
ratios [TMA]/[NH3] of 0.017 to 0.078 from rumen juice
sam-ples, while emission ratios for dung and slurry were 3 or-ders of magnitude smaller. These results suggest that cattle eructate significant amounts of TMA from their rumen con-tents, along the same pathway as for their CH4emissions.
Dung, though, appears not to be a significant TMA source. Further, Kuhn et al. (2011) found TMA/NH3 emission
ra-tios of order 0.002 to 0.004 from hay and silage. It is un-clear whether this result would apply to freshly-cut pasture. As most of the feed was eaten rather quickly in the present experiment, and refused feed was removed before offering the next round, it appears unlikely that the grass acted as a significant source of VA. It should be noted that the discrep-ancy between electrode and CCA was reduced after the cattle had left, but did not disappear completely: at the two upper-most heights (which measure the lowest concentrations), the ratio of electrode to CCA readings approached 1 from about Day 6, but at the lower three heights, it stayed closer to 2.
Here, it was not attempted to reproduce in detail the in-fluence of TMA, or other VA, on measurements of known NH+4 concentrations with the electrode, since that was be-yond the scope of the current study. The NH3 electrode is
essentially a modified pH electrode. It relies on the diffusion of NH3molecules present in the sample (which is previously
made strongly basic with added OH−) through a hydropho-bic membrane to the electrode surface. It is known that the basicity levels of VA (CRC, 2007) are generally significantly greater than the basicity of NH3, implying that even low VA
concentrations, if present in the sample, could produce ele-vated electrode readings. For a crude estimate, it may be as-sumed that VA diffuse through the hydrophobic membrane like NH3, and that their aqueous solubilities (i.e. Henry’s
Law coefficients) are comparable to NH3. Then, a molar
ra-tio of methylamine to NHx-N of 0.05, or a molar TMA/NH3
ratio of 0.02, respectively, would be sufficient to cause an er-ror of a factor of 2 in the NHx-N reading, thanks to the VA’s
greater basicity. Subsequent tests involving modest additions of trimethylamine hydrochloride (TMAHCl) to NH+4-N solu-tions of known concentration, made basic with added OH−, did produce marked changes in electrode readings broadly consistent with the above estimates. Hence, it is likely that only small amounts of VA need to be trapped in the NH3
sampler, along with the NH3, for the results to be wildly
inac-curate. Further investigation is needed to more fully validate this conjecture.
Supplementary material related to this article is available online at: http://www.biogeosciences.net/10/ 327/2013/bg-10-327-2013-supplement.pdf.
Acknowledgements. This work was funded by New Zealand’s Ministry for Agriculture and Forestry in the Sustainable Land Management and Climate Change (SLMACC) programme. Thanks are due to Nathan Paton and several student helpers for handling the cattle as well as harvesting, weighing and distributing their feed, to Neil Smith and Tony McSeveny for technical support in the field, and to Diane Kearney for performing the CCA analyses.
Edited by: C. Spirig
References
Agricultural Research Council: The Nutrient Requirements of Ru-minant Livestock, Commonwealth Agricultural Bureaux, Farn-ham Royal, England, 1980.
Ball, R., Keeney, D. R., Theobald, P. W., and Nes,
P.: Nitrogen balance in urine-affected areas of a
New Zealand pasture, Agron. J., 71, 309–314,
doi:10.2134/agronj1979.00021962007100020022x, 1979. Barthelmie, R. J. and Pryor, S. C.: Implications of ammonia
emis-sions for fine aerosol formation and visibility impairment: A case study from the Lower Fraser Valley, British Columbia, Atmos. Environ., 32, 345–352, 1998.
Beauchamp, E. G., Kidd, G. E., and Thurtell, G. W.: Ammonia volatilization from sewage sludge applied to the field, J. Envi-ron. Qual., 7, 141–146, 1978.
Bobbink, R., Boxman, D., Fremstad, E., Heil, G., Houdijk, A., and Roelofs, J.: Critical loads for nitrogen eutrophication of terres-trial and wetland ecosystems based upon changes in vegetation and fauna, in: Critical loads for nitrogen, Report to the Nordic Council of Ministers, edited by: Grennfelt, P. and Th¨ornel¨of, E., 111–159, Copenhagen, Denmark, 1992.
Bol, R., Petersen, S. O., Christofides, C., Dittert, K., and Hansen, M. N.: Short-term N2O, CO2, NH3fluxes, and N/C transfers in a Danish grass-clover pasture after simulated urine deposition in autumn, J. Plant Nutr. Soil Sc., 167, 568–576, 2004.
Bussink, D. W.: Ammonia volatilization from grassland receiving nitrogen fertilizer and rotationally grazed by dairy cattle, Fert. Res., 33, 257–265, 1992.
Bussink, D. W.: Relationships between ammonia volatilization and nitrogen fertilizer application rate, intake and excretion of herbage nitrogen by cattle on grazed swards, Fert. Res., 38, 111– 121, 1994.
CRC: CRC Handbook of Chemistry and Physics, 88th Edn. 2007– 2008, edited by: Lide D. R., 8-42–8-51, CRC Press, 2007. Denmead, O. T.: Novel meteorological methods for measuring trace
gas fluxes, Philos. T. R. Soc. Lond., A351, 383–396, 1995. Fenn, L. B. and Hossner, L. R.: Ammonia volatilisation from
am-monium or amam-monium-forming nitrogen fertilizers, Adv. Soil S., 1, 123–169, 1985.
Haynes, R. J. and Williams, P. H.: Nutrient cycling and soil fertil-ity in the grazed pasture ecosystem, Adv. Agron., 49, 119–199, 1993.
Jarvis, S. C., Hatch, D. J., and Roberts, D. H.: The effects of grass-land management on nitrogen losses from grazed swards through ammonia volatilization; the relationship to excretal N returns from cattle, J. Agr. Sci., 112, 205–216, 1989.
ammonia, hydrogen sulfide and odors from cattle waste, J. Anim. Sci., 48, 436–445, 1979.
Kirchmann, H. and Lundvall, A.: Treatment of solid animal ma-nures: identification of low NH3emission practices, Nutr. Cycl. Agroecosys., 51, 65–71, 1998.
Kuhn, U., Sintermann, J., Spirig, C., Jocher, M., Ammann, C., and Neftel, A.: Basic biogenic aerosol precursors: Agricultural source attribution of volatile amines revised, Geophys. Res. Lett., 38, L16811, doi:10.1029/2011GL047958, 2011.
Laubach, J., Taghizadeh-Toosi, A., Sherlock, R. R., and Kelliher, F. M.: Measuring and modelling ammonia emissions from a regular pattern of cattle urine patches, Agr. Forest Meteorol., 156, 1–17, 2012.
Leuning, R., Freney, J. R., Denmead, O. T., and Simpson, J. R.: A sampler for measuring atmospheric ammonia flux, Atmos. Envi-ron., 19, 1117–1124, 1985.
Mosier, A. R., Delgado, J. A., Cochran, V. L., Valentine, D. W., and Parton, W. J.: Impact of agriculture on soil consumption of atmo-spheric CH4and a comparison of CH4and N2O flux in subarctic, temperate and tropical grasslands, Nutr. Cycl. Agroecosys., 49, 71–83, 1997.
Nemitz, E., Dorsey, J. R., Flynn, M. J., Gallagher, M. W., Hensen, A., Erisman, J.-W., Owen, S. M., D¨ammgen, U., and Sutton, M. A.: Aerosol fluxes and particle growth above managed grass-land, Biogeosciences, 6, 1627–1645, doi:10.5194/bg-6-1627-2009, 2009.
Olesen, J. E. and Sommer, S. G.: Modelling effects of wind speed and surface cover on ammonia volatilization from stored pig slurry, Atmos. Environ., 27A, 2567–2574, 1993.
Petersen, S. O., Sommer, S. G., Aaes, O., and Søegaard, K.: Am-monia losses from urine and dung of grazing cattle: Effect of N intake, Atmos. Environ., 32, 295–300, 1998.
Ryden, J. C., Whitehead, D. C., Lockyer, D. R., Thompson, R. B., Skinner, J. H., and Garwood, E. A.: Ammonia emission from grassland and livestock production systems in the UK, Environ. Pollut., 48, 173–184, 1987.
Saarij¨arvi, K., Mattila, P. K., and Virkaj¨arvi, P.: Ammonia volatilization from artificial dung and urine patches measured by the equilibrium concentration technique (JTI method), Atmos. Environ., 40, 5137–5145, 2006.
Schade, G. W. and Crutzen, P. J.: Emission of aliphatic-amines from animal husbandry and their reactions – potential source of N2O and HCN, J. Atmos. Chem., 22, 319–346, 1995.
Sherlock, R. R. and Goh, K. M.: Dynamics of ammonia volatiliza-tion from simulated urine patches and aqueous urea applied to pasture. I. Field experiments, Fert. Res., 5, 181–195, 1984. Sherlock, R. R. and Goh, K. M.: Dynamics of ammonia
volatiliza-tion from simulated urine patches and aqueous urea applied to pasture. II. Theoretical derivation of a simplified model, Fert. Res., 6, 3–22, 1985.
Sherlock, R. R., Freney, J. R., Smith, N. P., and Cameron, K. C.: Evaluation of a sampler for assessing ammonia losses from fer-tilized fields, Fert. Res., 21, 61–66, 1989.
Sherlock, R. R., Freney, J. R., Bacon, P. E., and van der Weerden, T. J.: Estimating ammonia volatilization from unsaturated urea fertilized and urine affected soils by an indirect method, Fert. Res., 40, 197–205, 1995.
Sherlock, R. R., Jewell, P., and Clough, T.: Review of New Zealand-specific FracGASM and FracGASF emission factors, Report to the Ministry of Agriculture and Forestry (Contract MAF-POL/CP02 AG-INVENT-XXA), 2008.
Sintermann, J., Neftel, A., Ammann, C., H¨ani, C., Hensen, A., Lou-bet, B., and Flechard, C. R.: Are ammonia emissions from field-applied slurry substantially over-estimated in European emission inventories?, Biogeosciences, 9, 1611–1632, doi:10.5194/bg-9-1611-2012, 2012.
Sommer, S. G. and Sherlock, R. R.: pH and buffer component dy-namics in the surface layers of animal slurries, J. Agr. Sci., Cam-bridge, 127, 109–116, 1996.
Spirig, C., Flechard, C. R., Ammann, C., and Neftel, A.: The an-nual ammonia budget of fertilised cut grassland – Part 1: Mi-crometeorological flux measurements and emissions after slurry application, Biogeosciences, 7, 521–536, doi:10.5194/bg-7-521-2010, 2010.
Sugimoto, Y., Ball, P. R., and Theobald, P. W.: Dynamics of nitrogen in cattle dung on pasture, under different seasonal conditions. 1. Breakdown of dung and volatilization of ammonia, Journal of the Japanese Society of Grassland Science, 38, 160–166, 1992. van der Eerden, L. J. M.: Toxicity of ammonia to plants, Agr.
Envi-ron., 7, 223–235, 1982.
White, S. L., Shelfield, R. E., Washburn, S. P., King, L. D., and Green Jr., J. T. : Spatial and time distribution of dairy cattle excreta in an intensive pasture system, J. Environ. Qual., 30, 2180–2187, 2001.
Whitehead, D. C. and Raistrick, N.: Effects of some environmental factors on ammonia volatilization from simulated livestock urine applied to soil, Biol. Fert. Soils, 11, 279–284, 1991.
Whitehead, D. C. and Raistrick, N.: Effects of plant material on ammonia volatilization from simulated livestock urine applied to soil, Biol. Fert. Soils, 13, 92–95, 1992.