*Correspondence: C.H.R. Serra. Departamento de Farmácia. Faculdade de Ciências Farmacêuticas – USP. Av. Prof. Lineu Prestes, n. 580, 05508-000 – São Paulo – SP, Brasil. E-mail: [email protected]
http://dx.doi.org/10.1590/S1984-82502015000200016
Dissolution efficiency and bioequivalence study using urine
data from healthy volunteers: a comparison between two tablet
formulations of cephalexin
Cristina Helena dos Reis Serra
1,*, Kyung Hee Chang
2, Thaisa Marinho Dezani
1, Valentina Porta
1,
Sílvia Storpirtis
11Department of Pharmacy, University of São Paulo, São Paulo, SP, Brazil, 2Libbs Pharmaceutical, São Paulo, SP, Brazil
The aim of the present study was to assess the bioequivalence of two cephalexin tablet formulations available in the Brazilian market (product A as reference formulation and product B as test formulation). Dissolution eficiency (DE%) was calculated for both formulations to evaluate their in vitro biopharmaceutical features. The oral bioequivalence study was performed in twenty-four healthy volunteers in a crossover design. Single oral dose (tablet containing 500 mg of cephalexin) of each product was administered with two weeks of washout period. Urinary concentrations of cephalexin were measured by high-performance liquid chromatography (HPLC) method and pharmacokinetics parameters were estimated by urinary excretion data. The bioequivalence was determined by the following parameters: the cumulative amount of cephalexin excreted in the urine, the total amount of cephalexin excreted in the urine and the maximum urinary excretion rate of cephalexin. DE values of
immediate-release cephalexin tablets (500 mg) were 68.69±4.18% for product A and 71.03±6.63% for product B.
Regarding the dissolution test of the two brands (A and B) analysed, both were in compliance with the
oficial pharmacopeial speciications, since the dissolution of both formulations was superior to 80% of the amount declared in the label after 45 minutes of test (A=92.09%±1.84; B=92.84%±1.08). The
results obtained indicated that the products A and B are pharmaceutical equivalents. Conidence intervals
for the pharmacokinetic parameters were in compliance with the international standards, indicating that products A and B can be considered bioequivalents and, therefore, interchangeable.
Uniterms: Tablets/formulations/bioequivalence study. Cephalexin/dissolution eficiency.
O objetivo do presente estudo foi avaliar a bioequivalência de duas formulações de cefalexina disponíveis no mercado brasileiro (produto A como formulação referência e produto B como formulação teste). A
eiciência de dissolução (DE%) foi calculada para ambas as formulações para avaliar suas características
biofarmacêuticas. O estudo de bioequivalência oral foi realizado em vinte e quatro voluntários sadios utilizando um desenho cruzado. Uma dose oral única (comprimido contendo 500 mg de cefalexina) de cada produto foi administrada com um período de washout de duas semanas. Concentrações urinárias
de cefalexina foram mensuradas por método de cromatograia líquida de alta eiciência (CLAE) e os
parâmetros farmacocinéticos foram estimados por dados de excreção urinária. A bioequivalência foi determinada pelos seguintes parâmetros: quantidade acumulada da cefalexina excretada na urina, quantidade total da cefalexina excretada na urina e a taxa de excreção máxima da cefalexina. Os
valores de DE dos comprimidos de liberação imediata de cefalexina (500 mg) foram 68,69±4,18% para o produto A e de 71,03±6,63% para o produto B. Com relação ao teste de dissolução das duas marcas analisadas (A e B), ambas apresentaram-se de acordo com as especiicações farmacopéicas, uma vez que a dissolução de ambas formulações foi superior a 80% da quantidade declarada após 45 minutos de teste (A=92,09%±1,84; B=92,84% ±1,08). Os resultados obtidos indicaram que os produtos A e B são
equivalentes farmacêuticos. Os intervalos de coniança para os parâmetros farmacocinéticos estavam
de acordo com os padrões internacionais, demonstrando que os produtos A e B podem ser considerados bioequivalentes e, portanto, intercambiáveis.
INTRODUCTION
Cephalexin is a semi-synthetic cephalosporin widely used in the treatment of infectious diseases and it is orally administered. Blood concentrations of the drug after usual therapeutic dose are high enough to produce bactericidal effect against most susceptible microorganisms (Ding et al., 2011; Mohamed et al., 2011).
It is rapidly and completely absorbed from the gastrointestinal tract via carrier-mediated transport system and is eliminated from the organism mainly by urinary excretion. In adults with normal renal function, following oral administration of a single 250-500 mg dose, peak blood concentration can be obtained within 1
hour. Approximately 70-90% of cephalexin is excreted
unchanged in urine (Chow et al., 1979; Ding et al., 2011;
Nightingale, Greene, Quintiliani, 1975).
In Brazilian market, cephalexin is available for oral administration in several brand formulations considered interchangeable. However, bioequivalence studies of these formulations were not yet developed. The substitution of a drug product for a similar requires that both products be considered pharmaceutically equivalent and bioequivalent. The fundamental reason for performing bioequivalence testing is to establish that there are no differences in safety and efficacy between the brand products, i.e., they are
therapeutically equivalent (Grass, 1997).
Large differences between the rate and eficiency of
absorption may occur when the same drug is administered in same dosage forms that might contain different excipients or are made through different processes. Sometimes, such factors may affect the appearance of the drug in plasma (providing different concentrations) or urinary excretion curve (Engel et al., 2012; Grass, 1997).
The pharmacokinetic parameters can be calculated from the accumulated amount of excreted drug in the urine sample in a particular time interval. However, it is necessary
that a signiicant amount of the unchanged drug be excreted in the urine, that the analytical method be speciic for the
unchanged drug, that the samples be collected with larger
frequency to determine the excretion proile and that the
sampling be made until the almost complete elimination of the drug (practically seven half-lives). The decline of the plasmatic concentration curves and drug urinary excretion rate can be described mathematically by the same equation. Thus, it is possible to assume that the parameters obtained from urinary excretion data reflect the drug absorption (Cawello et al., 2013; Shargel, Yu, 1993).
However, this hypothesis is valid only when the requirements mentioned above are attained. Thus, the pharmacokinetics parameters and, therefore, the
bioavailability and bioequivalence can be calculated from the urinary excretion data. Moreover, the studies in blood serum may be replaced by the use of urinary data of the drug due to its low costs and for being less invasive (Otoom, Hasan, Najib, 2004; Portolés et al., 2009; Shargel,
Yu, 1993).
The aim of this study was to evaluate the dissolution
efficiency (DE%) and bioequivalence of two tablet
formulations of cephalexin (500 mg) designated as product A (reference formulation) and product B (test formulation) available in the Brazilian market using urinary data from healthy human volunteers. Previously, the products were submitted to physical and physicochemical tests and HPLC method was developed and validated in order to quantify cephalexin in urine samples.
MATERIAL AND METHODS
Tablets
Tablets of cephalexin 500 mg available in the Brazilian market were designated as product A (reference formulation) and product B (test formulation) and they were used in this study.
Dissolution profiles
Dissolution proiles were obtained using Hanson
Research Corporation Dissolution System in the following conditions: apparatus I (basket, 40 mesh), 100 rpm, 900 mL of distilled water (dissolution medium) maintained
at 37.0 ± 0.5 °C. Six tablets were analysed in every assay
and samples were collected at 5, 7, 10, 15, 20, 30, 40, 45,
50 and 60 min. Cephalexin concentration was determined using UV spectrophotometer with a wavelength of 262
nm. Dissolution efficiency (DE%) was calculated and
this value represent the area under the dissolution curve
up to a speciied time and it is expressed as a percentage
of the rectangle area (Cutrignelli et al., 2011; Khan, 1975; Nagabhushanam, Rao, Prabhakar, 2011).
Bioequivalence study
The protocol of the in vivo assay was approved by the Ethical Committee of the University Hospital from University of São Paulo. Twenty four male and female
healthy volunteers, age between 21-35 years and weighting
the study, according to the principles outlined in the Declaration of Helsinki. Medical history, physical examination and several laboratory tests (complete blood count, hematocrit, serum alkaline phosphatase, serum glutamate pyruvate transaminase, serum glutamate oxalate pyruvate transaminase, creatinine clearance and urinalysis) were carried out prior the study. The results of these examinations were within the normal limits for all volunteers. Each subject was asked about general health and known drug allergies. The volunteers were instructed to adhere to a standard protocol and to abstain from taking any medication one week before and during the study.
The study was conducted in an open, randomized two period cross-over design, according to Latin square design. All subjects received single dose of cephalexin 500 mg. Two brands of cephalexin 500 mg in conventional tablets were employed: the reference formulation (product A) and the test formulation (product B).
The subjects were divided into two groups. In
the irst period of the study, volunteers from one group
received product A and volunteers from the other group received product B. Two weeks later, this procedure was repeated by inverting the groups. Each subject fasted overnight prior to the experiment, and no food was allowed for 4 hours after cephalexin oral administration. The drug was administered with 500 mL of water.
Blank urine samples were obtained from each volunteer prior to dosing. Quantitative urine collections were obtained during each of the following time intervals:
30, 60, 90, 120, 180, 240, 300, 360, and 420 min. A volume
of 250 mL of water were administered after each urine collection. A standard lunch was ingested by all subjects 4 hours after dosing. Urine volume and pH were measured and an aliquot of each sample was frozen until analysis by HPLC.
Cephalexin quantification in human urine
Urinary concentrations of cephalexin were determined by a validated high performance liquid chromatographic (HPLC) method with UV detection at 254 nm. The drug was extracted from 500 µL urine using
300 mg of NaCl, 25 µL of HCl 0.75 N and 3.0 mL of
acetonitrile. Then, each sample was mixed using a vortex stirrer for one minute and centrifuged for 10 min at 2000 rpm. A volume of 2.5 mL of the supernatant were separated and evaporated to dryness under a N2 stream at 37 °C. The residue was reconstituted with 500 µL of mobile phase and 20 µL were injected into the chromatographic system. Chromatography was performed at room temperature using a 15.0 cm x 4.6 mm Supelcosil 5 µm LC18 column
(SUPELCO) and the mobile phase was constituted by
0.25 N acetate buffer pH 3.0 (65%) and methanol (35%) at a low-rate of 1 mL.min-1.
Validation was accomplished through determination of recovery, linearity, quantification limit, precision,
accuracy, speciicity and stability (ANVISA, 2003; ICH,
2005).
Bioequivalence evaluation
Since cephalexin is almost 100% excreted
unchanged in urine, the pharmacokinetic parameters for bioequivalence determination were established using urinary excretion data. Urine samples were collected at various time periods after dosing and were analysed for cephalexin. A graph of the cumulative amount of excreted drug versus time intervals of collection was obtained. Cumulative amount of excreted cephalexin (Duc) was determined by adding the amount of drug excreted in each time interval to the amount of drug excreted recovered in the previous time intervals. The total amount of drug recovered from urine after all excretion period was designed by Du∞. In this study the Du∞ was obtained from the cumulative excretion at 420 min, using the following
equation (Arancíbia, 1991; Shargel, Yu, 1993):
(Duc)i = Du
∞– [ 1 / e -k∆t] [ (Duc)
i+1 – (Duc)i ]
where (Duc)i is the cumulative amount of cephalexin excreted at a specific time; (Du)i+1 is the cumulative amount of cephalexin excreted at the immediately following time; k is the constant rate for elimination; and
∆t is the time interval.
The drug urinary excretion rate (dDu/dt)cannot be determined experimentally for any given instant. An average urinary excretion rate is then calculated for every collection period. The average values of dDu/dt were natural logarithmic (ln) transformed and plotted against the midpoint time of the collection period (tm). The maximum cephalexin urinary excretion rate [(dDu/dt)max] and the middle-time (tmmax) to reach [(dDu/dt)max] were registered. The elimination constant rate (k) was determined by linear regression of the terminal phase of the logarithmically transformed “dDu/dt x tm” curve. The elimination half-life (t½)β was calculated dividing 0.693 for k.
When all drug has been excreted (t=∞) the fraction of dose absorbed after a single oral dose is given by the following equation:
where F is the fraction of dose absorbed; k is the constant rate for elimination; ke is the constant rate of renal excretion; Du∞ is the total amount of drug recovered after excretion and D0 is the drug dose.
However, since elimination of the drug is usually and totally effected by renal excretion, ke=k and:
F = Du∞ / D 0
Analysis of variance (ANOVA) was performed for the values of the following pharmacokinetic parameters: cumulative amount of excreted cephalexin (Duc); total cumulative amount of cephalexin excreted (Du∞); maximum excretion rate of cephalexin [(dDu/dt)max]; middle-time of maximum excretion rate of cephalexin (tmmax); excretion constant rate of cephalexin (k) and cephalexin elimination half-life (t½)β. Factors accounting for the following variation sources were considered: sequence, subjects,
period and treatment. The 90% conidence interval (90%
CI) for the ratio between the test and the reference [Duc, Du∞ and (dDu/dt)
max] were calculated. Bioequivalence is
conirmed if the 90% CI are within 80-125%.
RESULTS AND DISCUSSION
Dissolution profiles and dissolution efficiency (DE%)
Figure 1 shows the dissolution proiles of products
A and B. DE values of immediate-release cephalexin
tablets (500 mg) were 68.69±4.18% for product A (p=0.23;
statistically significant difference was considered if
p≤0.05) and 71.03±6.63% for product B.
Cephalexin quantification in urine
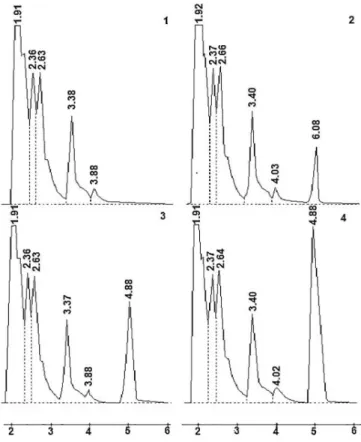
The chromatograms of urine showed good resolution
for all analysis and the retentions times of cephalexin were about 5 minutes (Figure 2). Calibration curve
parameters of cephalexin quantiication in human urine by chromatographic method were: slope of 10872, y-intercept of 131442 and correlation coeficient (r²) of 0.9974.
The proposed method showed 84.85% of recovery,
linearity between 10 and 500 µg.mL-1, quantiication limit of 10 µg.mL-1, intra-assay precision between 2.05 and
6.00%, inter-assay precision between 1.87 and 2.99%, intra-assay recovery between 81.12 and 92.36%, and inter-assay recovery between 80.08 and 88.84%. The samples
were stable for 120 days at -20 °C and the organic extracts were stable after reconstitution with mobile phase for 48 hours at room temperature.
The proposed method is suitable for cephalexin
quantiication in urine samples, showed good speciicity,
sensitivity, linearity, precision and accuracy, thereby enabling its use in bioequivalence assays.
Bioequivalence study
Table I shows the mean of cumulative amount of cephalexin excreted in urine after oral administration of products A and B (immediate-release tablets) to 24 healthy
FIGURE 1 - Dissolution profiles of immediate-release cephalexin tablets (500 mg), A and B products. The figure represents the dissolution percentages (arithmetic mean) and the standard deviations (n=6)
FIGURE 2 - Chromatogram of blank human urine (1), blank human urine with cephalexin 25.0 µg.ml-1 (2), 50.0 µg.mL-1 (3)
volunteers. Mean of cumulative amount of cephalexin excreted (Duc), mean of total amount of cephalexin excreted (Du∞) and mean of urinary recovery percentage of cephalexin in two formulations (A and B) are shown in Table II. Very similar mean cumulative amount of cephalexin excreted x time profiles were observed for
products A and B after oral administration (Figure 3).
Ta b l e I I I s u m m a r i z e s t h e m e a n v a l u e s o f pharmacokinetic parameters of both products (A and B) after oral administration of cephalexin immediate release tablets to 24 healthy volunteers. Urinary excretion rates of cephalexin (dDu/dt) for each product are shown in Figure 4.
Analysis of variance (ANOVA) according to a cross-over model was performed to ln-transformed data of products A and B pharmacokinetic parameters. Results are summarized in Table IV.
Table V reports the 90% conidence interval for the
ratios of Duc, Du∞ and (dDu/dt)
max of products A and B. The results of the present study indicate that there are
no statistically signiicant differences between products A
TABLE I - Mean of cumulative amount of cephalexin excreted
(Duc) at each time interval following oral administration of
immediate-release tablets (A and B products, n=24)
Time intervals (min)
A B
Duc (mg) % Duc (mg) %
0-30 9.64 1.93 7.68 1.54
30-60 93.21 18.64 93.87 18.77
60-90 207.22 41.44 192.52 38.50
90-120 285.30 57.06 269.20 53.84
120-180 361.64 72.34 356.26 71.25
180-240 393.81 78.76 397.15 79.43
240-300 409.92 81.98 414.13 82.83
300-360 417.59 83.52 423.17 84.63
360-420 422.08 84.42 428.39 85.68
TABLE II - Mean of cumulative amount of cephalexin excreted
(Duc), mean of total amount of cephalexin excreted (Du∞),
mean of urinary recovery percentage of cephalexin and fraction
of absorbed dose (F) after oral administration of
immediate-release tablets (products A and B, n=24). Values represent mean ± standard deviation
Products A B
Duc (mg) 422.08 ± 55.29 428.39 ± 46.37
Recovery (%) 84.42 ± 11.06 85.68 ± 9.27 Du∞(mg) 427.18 ± 54.81 434.58 ± 47.58
F (%) 85.44 ± 10.96 86.92 ± 9.52
TABLE III - Mean of pharmacokinetics parameters after oral administration of cephalexin (A and B products, n=24). Values represent mean ± standard deviation
Products (dDu/dt)max
(mg.min-1)
tm max
(min)
k (min -1)
t (½) β (min)
A 4.01±0.59 73.10±23.50 0.0123±0.0019 57.60±8.17
B 4.00±1.02 78.80±22.20 0.0120±0.0020 59.19±8.52
[(dDu/dt)max] = maximum rate of cephalexin excretion; tmmax = middle-time of maximum rate of cephalexin excretion; k = cephalexin
excretion constant rate and t(1/2)β = cephalexin elimination half-life
FIGURE 3 - Mean of cumulative amount of cephalexin excreted
in urine (Duc) followed by oral administration of
immediate-release tablets (A and B products, n=24). Bars indicate standard deviation.
and B in the in vitro dissolution studies and the cumulative urinary excretion of cephalexin at various time points. No
statistically signiicant differences were observed for the
pharmacokinetic parameters and the urine data indicate that both products are bioequivalent.
permeability across the gastrointestinal tract (Dahan, West, Amidon, 2009; Dezani et al., 2013a; Dezani et al.,
2013b). Because of the critical nature of the irst two of
these steps, in vitro dissolution may be relevant to predict in vivo performance. Based on this general consideration, in vitro dissolution tests for immediate-release solid oral dosage forms, such as tablets and capsules, are used to: assess the lot-to-lot quality of a drug product; guide development of new formulations; and ensure continuing product quality and performance after certain changes, such as changes in the formulation, in the manufacturing
process, in the site of manufacturing, and in the scale-up of the manufacturing process.
Regarding to the dissolution test of the two brands (A and B) analysed, both were in accordance with the
oficial pharmacopeial speciications, since the dissolution of both formulations was superior to 80% of the amount declared in the label after 45 minutes of test (A= 92.09%
± 1.84; B = 92.84% ± 1.08). In general, these dissolution
standards are single-point dissolution tests, not proiles.
However, a further parameter suitable for the evaluation of in vitro dissolution was suggested by Khan (1975), who
introduced the idea of dissolution eficiency (DE%). This is deined as the area under the dissolution curve up to a
certain time t, expressed as a percentage of the rectangle
area described by 100% dissolution in the same time (Khan, 1975; USP, 2010).
The DE% was calculated for both formulations to
accurately evaluate of their in vitro biopharmaceutical
features. Statistical analysis (ANOVA) of DE% values
did not show any significant differences between the
dissolution proiles for products A and B (p=0.23). The concept of Dissolution Eficiency has some advantages
over the single point dissolution test. The first is that
summation of drug release data into a single igure enables
a ready comparison to be made between a large numbers of formulations. The second advantage, and probably the most important, is that it can be theoretically related to
FIGURE 4 - Mean of urinary excretion rates (dDu/dt) followed by oral administration of cephalexin immediate-release tablets (A and B products, n=24).
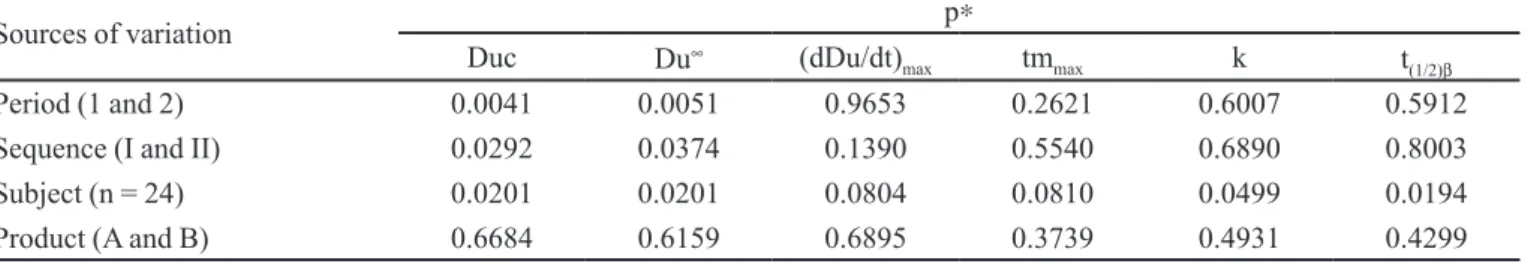
TABLE IV - Values of p obtained after statistical analysis (ANOVA) of ln-transformed data for the following pharmacokinetic
parameters: cumulative amount of cephalexin excreted (Duc); total cumulative amount of cephalexin excreted (Du∞); maximum
rate excretion of cephalexin [(dDu/dt)max]; middle-time of maximum excretion rate of cephalexin (tmmax); cephalexin excretion
constant rate (k), cephalexin elimination half-life (t(1/2)β)
Sources of variation p∗
Duc Du∞ (dDu/dt)
max tmmax k t(1/2)β
Period (1 and 2) 0.0041 0.0051 0.9653 0.2621 0.6007 0.5912
Sequence (I and II) 0.0292 0.0374 0.1390 0.5540 0.6890 0.8003
Subject (n = 24) 0.0201 0.0201 0.0804 0.0810 0.0499 0.0194
Product (A and B) 0.6684 0.6159 0.6895 0.3739 0.4931 0.4299
∗statistically signiicant difference was considered if p≤0,05
TABLE V - Conidence intervals (90%) for the ratio of ln-transformed data of Duc, Du∞ and (dDu/dt)
max, after oral administration
of cephalexin immediate-release tablets (A and B products, n=24)
Pharmacokinetic parameter Conidence Intervals (%)
Lower Limit Upper Limit
Duc 96.81 105.60
Du∞ 96.99 105.81
in vivo data. If it is assumed that the absorption of a drug depends on its degree of solubilization and on the time this solution is in contact with a suitable absorptive region of the gastrointestinal tract, it can be seen that the Dissolution
Eficiency as described is a function of these two variables. It seems be more logical and realistic use DE% to compare
and express in vitro results of several formulations instead of taking a single-point from the dissolution tests.
Thus, no discrepancies between both cephalexin brands were found in dissolution tests. However, to conclude if these pharmaceutical products are therapeutic equivalents, the in vivo bioequivalence studies are needed.
The bioequivalence study using A and B products was based on an open randomized two period crossover design with twenty-four male and female healthy volunteers. Pharmacokinetics parameters used in this evaluation were obtained from urinary excretion data of
cephalexin. According to speciication of FDA/USA, the
evaluation of the bioavailability implies in determination of the amount of drug absorbed and in the rate of this
process (FDA, 2003; USP, 2010). As bioequivalence refers
to the comparative study of bioavailability of two dosage forms or products that contain the same drug in the same amount, the pharmacokinetic parameters selected should
relect the absorption process (Shargel, Yu, 1993).
The pharmacokinetic parameters can be calculated from the accumulated amount of drug excreted in the urine in a certain time interval. However, it is necessary that a significant amount of the unchanged drug be
excreted in the urine, the analytical method be speciic
for the unchanged drug, the samples be collected with larger frequency to determine the excretion profile and the collection be made until the almost complete elimination of the drug (practically seven half-lives). The decline of the plasmatic curves and drug urinary excretion rate can be described mathematically by the same expression, so it is possible to assume that the
parameters obtained from urinary excretion data relect
drug absorption. However, this hypothesis is valid only when the requirements mentioned above are attained. In that way, the pharmacokinetics parameters, and therefore, the bioavailability and bioequivalence, can be calculated from the urinary excretion data (Kuchake et al., 2009;
Otoom, Hasan, Najib, 2004; Shargel, Yu, 1993).
The analytical method developed for cephalexin
quantiication in urine samples showed good speciicity,
sensitivity, linearity, precision and accuracy, enabling its use in bioequivalence trials.
Urinary recoveries of cephalexin excreted unchanged (Duc) after oral administration for both formulations (A
= 85.44%; B = 86.92%) indicated that the main route of
elimination is renal excretion. The results were similar
to those found by Nakagawa and colleagues (1978) that obtained 81.6% of recovery 6 hours after the administration
of 250 mg cephalexin capsules (Nakagawa et al., 1978).
Finkelstein and colleagues (1978) reported that 90.6% and 89.6% were recovered in the urine 24 hours after the
administration, respectively, of cephalexin capsules and tablets (Finkelstein et al., 1978). Posterior studies found
recoveries of 92.0% and 95.0% of the administered dose 6
and 24 hours after drug administration (Martinez-Pacheco et al., 1988).
Values obtained for maximum excretion rate of cephalexin were very similar for both products (A = 4.01 ± 0.59 mg.min-1; B = 4.01 ± 1.02 mg.min-1). These results are in agreement with that described by other authors (5.0 mg.min-1). Values of tm
max were also similar
(A = 73.10 ± 23.50 min; B = 78.80 ± 22.20 min). Jung and colleagues (1991) obtained tmmax of 75 and 105 min, respectively, after the administration of 500 mg cephalexin capsules and tablets (Jung et al., 1991).
The elimination half-life is a biological constant that characterises the kinetic of the drug. The medium values of elimination half-life (t(½)β) for normal individuals are in agreement with that described by other authors,
in the range of 36 to 126 min (Nightingale, Greene, Quintiliani, 1975). Mean values of 50 ± 10 min after oral administration to normal fasting individuals were reported (Chow et al., 1979; Finkelstein et al., 1978; Greene et al., 1976). Concomitant administration of food changes
the elimination half-life to 77 min (Greene, Quintiliani, Nightingale, 1975).
The elimination rate constant (k) was determined by linear regression of the terminal phase of the logarithmically transformed “dDu/dt x tm” curve. The elimination rate constant (k) can be represented by the sum of the non-biotransformed drug urinary excretion rate constant (ku) and the biotransformed drug elimination rate constant (km) (Rowland, Tozer, 1995). However, since cephalexin does not suffer hepatic biotransformation, being completely eliminated by renal excretion, k is equal to ku. The results obtained for products A and B were in agreement with data described by Chow and colleagues
(1979) and Finkelstein and colleagues (1978), which
found k values of 0.015 ± 0.003 min-1 (Chow et al., 1979; Finkelstein et al., 1978).
A n a l y s i s o f v a r i a n c e w a s p e r f o r m e d o n pharmacokinetic parameters after natural logarithmic (ln) transformation. Factors related to variation sources were considered: sequence, subjects, period and treatment.
parameters, intra-individual variation is greater than
inter-individual variation and it conirms the need of using a
crossover design for the assay (Jackson, 1994).
Sequence effect was observed for Duc and Du∞. This effect could be due to a difference between the individuals randomly assigned to the two groups, to an unequal carryover effect between the tested products or to product-period interaction (Jackson, 1994). United States Pharmacopeia (2010) states that this effect occurs
in 10% of all bioequivalence assays and it can be ignored
if the assay was performed using single dose in healthy volunteers; if the drug is not an endogenous substance; if an appropriate washout period among the two phases
is allowed and if it is in conformity with scientiic and statistical approaches. All these conditions were fulilled in
the present study. According to Orsmby (1994), if there are no suspicious facts, as different from zero concentrations of the drug at the beginning of the second period of the assay, the group effect can be ignored (Orsmby, 1994).
No signiicant treatment effect was found for any
of the pharmacokinetic parameters evaluated, which indicates that there is no difference between products
A and B. The 90% confidence intervals for the ratio
between the test and the reference average of Duc, Du∞ and (dDu/dt)max were calculated. Bioequivalence was
conirmed with the results within the interval 80-125%.
Period effect was found for Duc and Du∞ but does not invalidate the assay (Jackson, 1994). Conidence intervals
for the pharmacokinetic parameters evaluated were according to international standards.
Based on this study, some drugs can be evaluated in order to predict absorption through urinary excretion data, mainly when non-metabolized substances are studied. Due to high invasiveness of bioequivalence/bioavailability conventional studies, the prediction of absorption can be performed using the methodology proposed in this study, as well as pharmacokinetics parameters. Furthermore, urinary excretion methodology represents low costs, it is less invasive method and its throughput is viable when compared to conventional method with blood samples. Besides that, the involvement of healthy volunteers should be taken in account. The meal control and pre-treatment procedures before and during the experiments must be responsibility of the researchers as well as the volunteers to avoid variation in the methodology. Thus, the conditions must be established and standardized to minimize errors during the study (Cawello et al., 2013; Otoom, Hasan, Najib, 2004; Portolés et al., 2009; Shargel, Yu, 1993).
The rate and extension of a drug excreted in the
urine relect the rate and extent of its absorption process (Shargel, Yu, 1993). Thus, it is possible to evaluate
bioavailability/bioequivalence of two formulations using parameters derived from urinary excretion. Several reports in the literature indicate that urinary excretion data can be used for studies of bioavailability and bioequivalence between different medicinal products (Wagenlehner et al., 2006; Tubic et al., 2006; Otoom, Hasan, Najib, 2004; Shah et al., 2002; Pillai et al., 2001) since the graph obtained from urinary excretion rate (dXu/dt) versus time (t), result in a curve very similar to the curve obtained from plasma versus time. Thus, according to Shargel and Yu (1993), the plasma concentration-time curve and excretion rate of a drug are overlapping. Thus, the parameters for elimination of drug in urine reflect those related to its absorption (Serra, Storpirtis, Gonçalves, 2011).
CONCLUSION
Cephalexin is a drug widely used for infectious diseases. However, bioavailability data of this substance is scarce in the literature, especially using urine excretion data.
The bioavailability study of the cephalexin using human urine shows that A and B products can be considered bioequivalents and, therefore, interchangeable.
Based on this study, the methodology can be applied to other drugs that are excreted unchanged. For new compounds, the permeability characterization can be a previous test before bioequivalence/bioavailability studies and then, complemented with studies using urinary excretion data to predict the absorption of a drug.
REFERENCES
ARANCÍBIA, A. Calidad biofarmacêutica. Estudos in vitro e
in vivo. Acta Farm. Bonaer., v.10, n.2, p.123-133, 1991.
AGÊNCIA NACIONAL DE VIGILÂNCIA SANITÁRIA.
ANVISA. Resolução RE n. 899, de 29 de maio de 2003.
Aprova o guia para validação de métodos analíticos e
bioanalíticos. Diário Oicial da União, Brasília, Seção 1,
p.56-59, 2 jun. 2003.
CAWELLO, W.; BÖKENS, H.; NICKEL, B.; ANDREAS, J.O.; HALABI, A. Tolerability, pharmacokinetics, and bioequivalence of the tablet and syrup formulations of lacosamide in plasma, saliva and urine: Saliva as a surrogate
of pharmacokinetics in the central compartment. Epilepsia,
CHOW, M.; BURKE, R.Q.; CUNHA, A.; THOMPSON, M.; FINKELSTEIN, E. Pharmacokinetics of high-dose oral
cephalosporins. J. Clin. Pharmacol., v.19, n.4, p.185-194,
1979.
CUTRIGNELLI, A.; TRAPANI, A.; LOPEDOTA, A.; FRANCO, M.; MANDRACCHIA, D.; DENORA, n.; LAQUINTANA, v.; TRAPANI, G. Griseofulvin/Carrier blends: Application of partial least squares (PLS) regression analysis for estimating the factors affecting the dissolution
eficiency. AAPS PharmSciTech, v.12, n.4, p.1019-1030,
2011.
DAHAN, A.; WEST, B.T.; AMIDON, G.L. Segmental-dependent membrane permeability along the intestine following oral drug administration: evaluation of a triple single-pass intestinal perfusion (TSPIP) approach in the rat.
Eur. J. Pharm. Sci., v.36, p.320-329, 2009.
DEZANI, A.B.; PEREIRA, T.M.; CAFFARO, A.M.; REIS, J.M.; SERRA, C.H.R. Determination of lamivudine and
zidovudine permeability using a different ex vivo method
in Franz cells. J. Pharmacol. Toxicol. Methods, v.67, p.194-202, 2013a.
DEZANI, A. B.; PEREIRA, T. M.; CAFFARO, A. M.; REIS, J. M.; SERRA, C. H. R. Equilibrium solubility versus instrinsic dissolution: characterization of lamivudine,
stavudine and zidovudine for BCS classiication. Braz. J. Pharm. Sci, v.49, n.4, p.855-863, 2013b.
DING, Y.; JIA, Y.Y.; LI, F.; LIU, W.X.; LU, C.T.; ZHU, Y.R.; YANG, J.; DING, L.-K.; YANG, L.; WEN, A.-D.
The effect of staggered administration of zinc sulphate
on the pharmacokinetics of oral cephalexin. Br. J. Clin.
Pharmacol., v.73, n.3, p.422-427, 2011.
ENGEL, A.; OSWALD, S.; SIEGMUND, W.; KAISER, M.
Pharmaceutical excipients inluence the function of human
uptake transporting protein. Mol. Pharm., v.9, n.9,
p.2577-2581, 2012.
FINKELSTEIN, E.; QUINTILIANI, R.; LEE, R.; BRACCI, A.; NIGHTINGALE, C.H. Pharmacokinetics of oral
cephalosporins: cephradine and cephalexin. J. Pharm. Sci.,
v.67, n.10, p.1447-1450, 1978.
GRASS, G.M. Simultaneous models to predict oral drug absorption from in vitro data. Adv. Drug Deliv. Rev., v.23, n.1-3, p.199-219,1997.
GREENE, D.S.; FLANAGAN, D.R.; QUINTILIANI, R.; NIGHTINGALE, C.H. Pharmacokinetics of cephalexin: an evaluation of one- and two-compartment model
pharmacokinetics. J. Clin. Pharmacol., v.16, n.5-6,
p.257-264, 1976.
INTERNATIONAL CONFERENCE ON HARMONISATION O F T E C H N I C A L R E Q U I R E M E N T S F O R REGISTRATION OF PHARMACEUTICALS FOR HUMAN USE. ICH. Quality Guidelines. Analytical
Validation Q2. Validation of analytical procedures: text
and methodology: Q2(R1). S.l.: ICH, 2005. 17 p. Available
at: <http://www.ich.org/fileadmin/Public_Web_Site/ ICH_Products/Guidelines/Quality/Q2_R1/Step4/Q2_R1__ Guideline.pdf>. Accessed on: 05 Ago 2014.
JACKSON, A. J. Generics and bioequivalence. Boca Raton:
CRC Press, 1994. 203 p.
JUNG, H.; PEREZ, R.; FERNANDEZ, L.; FUENTES, I.; RODRIGUEZ, J.M. Bioavailability of cephalexin dosage
forms. Drug Dev. Ind. Pharm., v.17, n.16, p.2173-2183,
1991.
KHAN, K.A. The concept of dissolution eficiency. J. Pharm. Pharmacol., v.27, n.1, p.48-49, 1975.
KUCHAKE, v.G.; PATIL, p.H.; MAHAJAN, H.S.; INGLE, p.V. ; SURANA, S.J.; THAKARE, M.M. Determination
of bioequivalence of two oral formulations of gatiloxacin
tablets in healthy male volunteers using urinary excretion data. Res. J. Pharm. Phar., v.1, n.2, p.73-78, 2009.
MARTINEZ-PACHECO, R.; VILA-JATO, J.L.; CONCHEIRO, A.; SOUTO, C.; LOSA, C.M.; RAMOS, T. Effect of compression force on biopharmaceutical characteristics of eudragit RS-based cephalexin tablets. Int. J. Pharm., v.47, n.1-3, p.37-42, 1988.
MOHAMED, S.S.; MUSTAFA, M.A.; AHMED, E.A.; ALGARAI, n.A.; ALAWAD, Z.A.; ALI, A.A. Comparative pharmacokinetics and bioequivalence studies of three oral
cephalexin monohydrate formulations. Jordan J. Pharm.
Sci., v.4, n.2, p.89-96, 2011.
NAGABHUSHANAM, M.V. ; RAO, C.V. P. ; PRABHAKAR, C. Hydrophilic polymers for dissolution enhancement of celecoxib. Int. J. Pharm. Pharm. Sci., v.3, n.5, p .547-549,
NAKAGAWA, T.; HAGINAKA, J.; YAMAOKA, K.; UNO, T.
Direct high-speed liquid chromatographic determination of cephalexin in urine. J. Chromatogr., v.147, p.509-512, 1978.
NIGHTINGALE, C. H.; GREENE, D. S.; QUINTILIANI, R. Pharmacokinetics and clinical use of cephalosporin antibiotics. J. Pharm. Sci., v.64, n.12, p.1899-1927, 1975.
ORSMBY, E. Statistical methods in bioequivalence.In:
JACKSON, A.J., (Ed.). Generics and bioequivalence. Boca
Raton: CRC Press, 1994. p. 1-27.
O T O O M , S . ; H A S A N , M . ; N A J I B , n . C o m p a r a t i v e bioavailability of two cefadroxil products using serum
and urine data in healthy human volunteers. Clin. Exp.
Pharmacol. Physiol., v.31, n.7, p.433-437, 2004.
PILLAI, G.; ELLARD, G.A.; SMITH, p.J.; FOURIE, p.B. The potential use of urinary excretion data for assessing the relative bioavailability of rifampicin in fixed dose
combination anti-tuberculosis formulations. Int. J. Tuberc.
Lung Dis., v.5, n.8, p.691-695, 2001.
PORTOLÉS, A.; PRIETO, E.; CALVO, A.; LAREDO, L.; FERNANDEZ, n.; VARGAS, E. Truncated area under the urinary excretion rate curve in the evaluation of alendronate bioequivalence after a single dose in healthy volunteers.
Arzneimittelforschung, v.59, n.8, p.397-402, 2009.
ROWLAND, M.; TOZER, T. N. Clinical pharmacokinetics:
concepts and applications. 3.ed. Philadelphya: Lea &
Febiger, 1995. 601 p.
SERRA, C.H.R.; STORPIRTIS, S.; GONÇALVES, J.E. Excreção urinária de fármacos. In: STORPIRTIS, S.; GAI, M. N. ; GONÇALVES, J. E.; CAMPOS, D. R. C. (Eds.)
Farmacocinética básica e aplicada. São Paulo:
Guanabara-Koogan, 2011. p. 50-57.
SHAH, S.A.; RATHOD, I.S.; SAVALE, S.S.; PATEL, D.B.
Determination of bioequivalence of lomeloxacin tablets
using urinary excretion data. J. Pharm. Biomed. Analysis,
v.30, n.4, p.1319-1329, 2002.
SHARGEL, L.; YU, A. B. C. Applied biopharmaceutics and pharmacokinetics. 3. ed. Connecticut: Prentice-Hall, 1993.
625 p.
TUBIC, M.; WAGNER, D.; SPAHN-LANGGUTH, H.; WEILER, C.; WANITSCHKE, R.; BÖCHER, W.O.; LANGGUTH, p.Effects of controlled-release on the pharmacokinetics and absorption characteristics of a
compound undergoing intestinal eflux in humans. Eur. J. Pharm. Sci., v.29, n.3-4, p.231-239, 2006.
UNITED STATES PHARMACOPEIAL CONVENTION.
USP. USP 33 NF 28. United States Pharmacopeia 33 [and]
The National Formulary 28. Rockville: United States
Pharmacopeial Convention, 2010. 3v.
FOOD AND DRUG ADMINISTRATION. FDA. Center
for Drug Evaluation and Research. Guidance for
industry: bioavailability and bioequivalence studies f o r o r a l l y a d m i n i s t e r e d d r u g p r o d u c t s - g e n e r a l
considerations. Rockville: FDA, 2003. p. 1-26.
Available at: <http://www.fda.gov/downloads/Drugs/ GuidanceComplianceRegulatoryInformation/Guidances/
ucm070124.pdf>. Accessed on: 12 Ago 2014.
WAGENLEHNER, F.M.E.; KINZIG-SCHIPPERS, M.; SÖRGEL, F.; WEIDNER, W.; NABER, G. Concentration in plasma, urinary excretion and bactericidal activity of levofloxacin (500mg) versus ciprofloxacin (500mg) in
healthy volunteers receiving a single oral dose. Int. J.
Antimicrob. Agents, v.28, n.6, p.551-559, 2006.
Received for publication on 27th March 2014