Study of the hearing in children
born from pregnant women
exposed to occupational noise:
Assessment by distortion
product otoacoustic emissions
Summary
Eduardo Bezerra Rocha 1, Marisa Frasson deAzevedo 2, João Aragão Ximenes Filho 3
1 MD. Otorhinolaryngologist - SBORL; M.S in Human Communication - UNIFESP-EPM/ UNIFOR. Professor.
2 PhD in Human Communication - UNIFESP, Adjunct Professor and Vice-chairperson of the Hearing Disorders Department - Speech and Hearing Therapy - EPM. 3 PhD in Otorhinolaryngology - FMUSP, Guest Postgraduate Program Professor of Surgery - FMUFC.
Paper submitted to the ABORL-CCF SGP (Management Publications System) on April 17th, 2007 and accepted for publication on April 18th, 2007. cod. 4454.
A
im: To detect early on a probable hearing loss in childrenof women exposed to occupational noise during their pregnancy and to verify if there is any difference between the children from those women exposed to occupational noise during their pregnancy and the ones from mothers that
do not work under the same conditions. Methods: Children
from women exposed to occupational noise during their pregnancy and children from women who were not exposed were evaluated through distortion product otoacoustic emissions, using the GSI 60 DPOEA SYSTEM equipment
and the frequency-ratio F2/F1 equal to 1.2 and the geometric
average of 2F1-F2. The intensity of the primary frequencies
were kept steady with values of L1=65dBSPL and L2=55dBSPL
for F1 and F2, respectively. Student T test in paired samples
and independent samples were used. Results: There were no
differences in the response amplitude of distortion product otoacoustic emissions between the control and the study groups. There was no statistically difference between male and female children in response amplitude for the two groups aforementioned; and there were no differences between
right and left ears from each group. Conclusion: We did
not observe hearing impairment in children whose mothers were exposed to occupational noise during pregnancy when compared to the children from mothers who were not. There was no difference between the right and left ears, nor between male and female children in each group.
Keywords: hearing, occupational/prevention, control, noise. ORIGINAL ARTICLE
INTRODUCTION
Although temporary, sound pollution is responsible for great harm. Such pollution, dealt upon as noise, can be social or occupational. Social noise is the one caused by discos, noisy cars, rock bands, usually of short dura-tion and that, if isolated and episodic, would hardly cause
hearing problems to men1.
In general, those who work exposed to noise levels above 85dBSPL and under long standing exposure must be monitored. Auditory monitoring can be carried out by means of threshold tonal audiometry, which determines the least sound intensity capable of causing auditory sensation in each frequency tested, using a pure sound stimulus, and this is the one most employed in factories.
Another method is evoked otoacoustic emmission2-9 which is obtained in response to previous sound stimula-tion, and it can be with pure tones - by distortion products of pre-established frequencies, which analyzes cochlear activities in specific frequencies10-13 or by a very short sound
stimulus, a “click” - transitory and that represent a global cochlear response11. It is an objective, quick, non-invasive
and easily applicable method 14-17, including the screening
of children in high risk nurseries18.
Until very recently, the concern in assessing the hearing of those exposed to noise was limited to males. However, with the need to contribute financially to the household, women today represent almost 50% of the work force and are present in a sizeable share of the world industrial setting and, most of them are in their reproduc-tive years19. It is known that there is a greater individual
susceptibility; however, there is no clinical evidence that men or women be more prone to hearing problems when exposed to noise.
It is known that when a sound wave goes from the air medium (outer and middle ear) to the liquid medium (labyrinthine liquids), 99.9% of this energy is lost. It is also known that the human fetus is protected inside the mother’s womb and the tissues and liquid around this
harmless being may damp environmental noise20,21 and,
according to a quote from Niemtzow22 (1982), such
dam-ping shall be more effective as the frequency increases. Thus, lower frequencies are less damped, and therefore are the most harmful to the fetal cochlea.
Many are the papers that discuss the effects of
oc-cupational noise on the fetus21-26; however, few approach
its effects on the fetus’s hearing27. It is debated whether or not noise may cause low birth weight28,29 or bring about
alterations to the immune system30. The possible devas-tating effect occupational noise may have on this future human has been considered, and thus we deemed rele-vant to invest in this research project, trying to establish a cause/effect relation in regards of these women and their work environment.
In the present investigation, the target public is, therefore, the children born from women who, during pregnancy were exposed to occupational noise. Since to-nal audiometry is a method that is impossible to be used in neonates because it requires a behavioral answer from the examinee, otoacoustic emissions bear the ideal traits to be the exam of choice in these cases3,12.
The goals of the present investigation were: 1. Provide for an early detection of hearing loss in children born from women exposed to occupational noise during pregnancy;
2. Check to see whether there is any difference in the results of otoacoustic emissions - distortion product - amplitudes among the children born from mothers who were exposed to occupational noise and the children born from mothers who were not exposed to occupatio-nal noise.
PATIENTS AND METHODS
Patients
This work was developed at the department of Speech and Hearing Therapy of the Núcleo de Atenção Médica Integrada (NAMI), of the University of Fortaleza (UNIFOR), from August 2002 through June of 2003. Pa-tients underwent otorhinolaryngology exam, followed by otoacoustic emissions - distortion product (DPOAM), after informing the guardian and obtaining a signed consent. The study was approved by the Ethics Committee of both universities: University of Fortaleza and the Federal Univer-sity of São Paulo (UNIFESP-EPM), protocol # 0330/03.
The object of our study were children with ages ranging from 0 to 6 months, of both genders and without any risk factor for hearing loss, according to the recom-mendations established by the preliminary screening group of neonatal screening, formed by the Brazilian Society of Otorhinolaryngology in May of 2000. Those children who presented some risk indicator for hearing loss were taken off the study.
The women (mothers) come from the same socio-economical background (family income equivalent to 1-2 minimum wages). We also excluded those women who worked exposed to chemical products and who smoked during pregnancy26.
Questionnaires were answered during interview with the researcher on the pregnancy and delivery con-ditions, considering birth weight and height, mother’s and relatives’ past, and that of the child being investigated, and also the mother’s professional activity during pregnancy. Thus, all the aforementioned variables were eliminated and the children were selected.
middle ear involvement, by means of an otoscopy. Those children with external and/or middle ear problems were treated clinically and then reassessed. When there were within normal parameters, they were approved to join the study.
The study was carried out with 80 children who were distributed in two groups: study and control. The first was made up of 35 children with ages varying betwe-en 0 and 6 months, of both gbetwe-enders, born from wombetwe-en exposed to occupational noise above 80dBSPL (intensity range above 80dBSPL and below 90dBSPL), in an 8 hour daily work routine, making up a total of 40 hours per week of work during pregnancy, and whom both the gestation and delivery happened without complications. The chil-dren hereby studied are from women who worked in a nuts processing plant, located in the city of Cascavel, in the state of Ceará, 60 Km away from Fortaleza. All these women worn personal protection equipment (PPE) - ear plug - during their work routine and kept working expo-sed to occupational noise until at least the 8th month of pregnancy, and most took maternity leave 15 days before delivery (Table 1).
The control group was formed by 45 children, also from both genders, with matching ages to those in the study, born from women who were not exposed to occupational noise during gestation, from the Dendê community and who are followed at the NAMI, without the same hearing loss risk factors of those children in the study, who went through the same assessment procedure (Table 1).
Distortion Product - Evoked Otoacoustic Emissions
The children who passed the otorhinolaryngological exam were submitted to auditory analysis by means of the distortion product - evoked otoacoustic emissions.
In order to record the DPOAE we used a GSI 60 DPOEA SYSTEM. Recording took place after the genera-tion of two pure tones F1 and F2, where F2 was always higher than F1 and were called primary frequencies. F2 varied between 593 Hz and 6031 Hz and its geometric average (GA) followed the 2F1-F2 standard in the F2/F1 ratio equal to 1.2. The primaries F1 and F2 (L1 for F1 and L2 for F2) stimuli intensities remained fixed at 65dBSPL and 55dBSPL, respectively, in other words, L1 was greater than L2 in 10dBSPL. The DPOAE measures were carried out from the low to the high frequencies.
An acoustic probe with two receivers (micro-spe-akers) was coupled to the measuring device, which were responsible for the emission of acoustic signals (F1 and F2) and 1 high sensitivity miniature microphone used to collect the DPOAE, and this whole set of transducers were assembled in a small probe similar to the one used in immitanciometry, and which was coupled to the external auditory meatus by means of a rubber plug of proper size for each child tested.
The device was calibrated whenever turned on,
using a 2cm3 cavity simulator, where we checked the
cor-rect sealing and working of the transducers and necessary adjustments for calibration purposes were made by the device itself.
The distortion products and background noises were recorded and analyzed in relation to the sound fre-quencies, as shown on Table 2.
Table 1. Children distribution by gender and group.
Males Females Total Control Group. 26 (57.7%) 19 (42.3%) 45
Study Group. 16 (45.7%) 19 (54.3%) 35
Method
All women in both groups received prenatal care and conceived children in public maternities under the care of a health care professional. Data on birth conditions and the child’s status at delivery were collected from the child’s vaccination card or from the birth records provided by the maternity.
Otoscopic Exam
The equipment used for the otorhinolaryngological assessment were a Kole headlamp and a Heine otoscope. This assessment was necessary in order to check external and middle ear integrity, which function is essential in order to properly capture the otoacoustic emissions.
Table 2 - F1 and F2 primary frequencies and distortion product for 2 F1-F2
Primary
Point F1 F2 F2/F1 GM(Hz) DP 2F1-F2(Hz)
1 500 593 1,2 531 406
2 625 750 1,2 687 500
3 781 937 1,2 843 625
4 1000 1187 1,2 1093 812
5 1250 1500 1,2 1375 1000
6 1593 1906 1,2 1750 1281
7 2000 2406 1,2 2187 1593
8 2531 3031 1,2 2781 2031
9 3187 3812 1,2 3500 2562
10 4000 4812 1,2 4375 3187
DPOAE were considered present whenever the distortion product amplitude value were positive, with a difference equal to, or higher than 6dBSPL in relation to the background noise, in other words, a signal to noise ration difference equal to or higher than 6dBSPL. Nega-tive amplitudes, with differences below 6dBSPL were considered absent. We always tried to keep noise levels below zero (negative). Cases of excessive noise, masking the response, were not analyzed.
The exam was carried out in an acoustically trea-ted room and booth, in the selectrea-ted children that, after fed, were sleepy or slightly asleep and in the arms of the mother or guardian.
Statistical analysis
The statistics used for data analysis was based on the t-Student test for averages comparison in: (i) paired samples (dependent) and (ii) independent samples.
The significance level used in the tests conclusion was of 0.05 in all the tables and we present edthe descrip-tive level of the tests (p-value), in other words, minimum significance level to be used for ruling out the hypothesis H0. Data were analyzed by means of the SPSS version 8.0 statistics software.
RESULTS
Study of the distortion product amplitudes and background noise in function of the ear side variable in both the control and the study groups
Hereby we present the results from the distortion product - evoked otoacoustic emissions and back ground noise in children born from mothers who were not ex-posed to occupational noise during pregnancy (control group), analyzing their response amplitudes for each ear
and, following that, comparing them among each other. We used the t-Student test for paired samples (significant for p < 0.05) and there was no statistically significant diffe-rence between right and left ears for the distortion product and background noise amplitude averages in the control group. As for the study group, the right ear presented a statistically significant difference in the frequency of 1500 Hz when compared to the left ear, in other words, the right ear presented better distortion product amplitude average when compared to the left ear. As for background noise, there was no statistically significant difference between right and left ears in the study group.
Study of the distortion product amplitudes and ba-ckground noise in function of the gender variable in both the control and the study groups
We analyzed the average with standard deviation measures for distortion product - evoked otoacoustic emissions and background noise in relation to gender for each group (study and control).
Boys presented better distortion product average amplitudes when compared to girls in the F2 frequencies of 1187 KHz and 1500 KHz for the control group, while girls had better distortion product amplitude averages when compared to boys in the F2 frequency of 2406 KHz. There was no statistically significant difference for background noise insofar as gender is concerned for both groups.
Comparative study of background noise and dis-tortion product amplitudes between the control and study groups
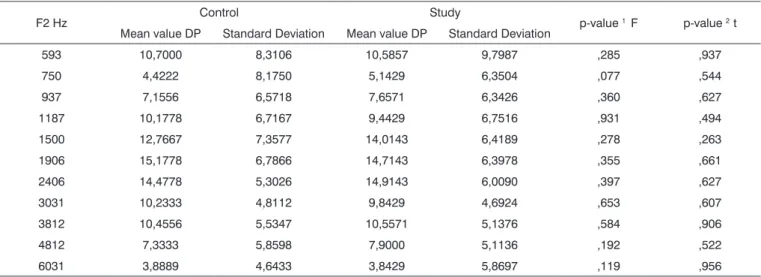
Considering both ears together for the assessed group. There was no statistically significant difference between the two groups in relation to the averages of response amplitudes in distortion product. Both for the control and the study groups, background noise presented positive values for the low frequencies and negative values
Table 3 – mean values, standard deviation and student t test (paired samples) in order to compare DP (distortion product) mean values obtai-ned for right and left ears – control group
F2 Hz Right Ear Left Ear t gl p-value
DP Mean value Standard Deviation DP Mean value Standard Deviation
593 9,24 7,69 12,16 8,73 -1,617 44 ,113
750 3,51 7,01 5,33 9,18 -1,178 44 ,245
937 6,82 6,19 7,49 6,98 -0,645 44 ,523
1187 10,73 6,39 9,62 7,06 1,189 44 ,241
1500 12,60 7,94 12,93 6,81 -,321 44 ,750
1906 15,62 7,09 14,73 6,52 1,019 44 ,314
2406 14,51 5,20 14,44 5,46 ,083 44 ,934
3031 10,49 4,75 9,98 4,92 ,737 44 ,465
3812 10,93 5,78 9,98 5,30 1,144 44 ,259
4812 8,20 5,96 6,47 5,70 1,779 44 ,082
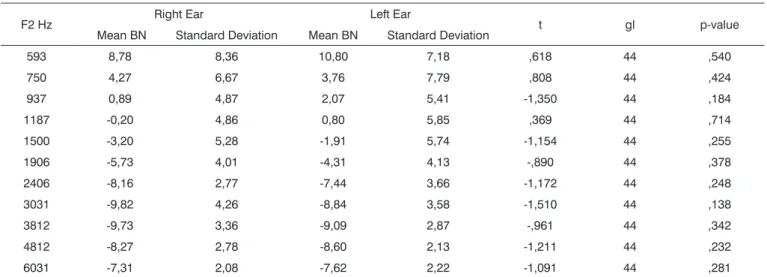
Table 4 - mean values, standard deviation and student t test (paired samples) in order to compare BN (background noise) mean values obtai-ned for right and left ears – control group
F2 Hz Right Ear Left Ear t gl p-value
Mean BN Standard Deviation Mean BN Standard Deviation
593 8,78 8,36 10,80 7,18 ,618 44 ,540
750 4,27 6,67 3,76 7,79 ,808 44 ,424
937 0,89 4,87 2,07 5,41 -1,350 44 ,184
1187 -0,20 4,86 0,80 5,85 ,369 44 ,714
1500 -3,20 5,28 -1,91 5,74 -1,154 44 ,255
1906 -5,73 4,01 -4,31 4,13 -,890 44 ,378
2406 -8,16 2,77 -7,44 3,66 -1,172 44 ,248
3031 -9,82 4,26 -8,84 3,58 -1,510 44 ,138
3812 -9,73 3,36 -9,09 2,87 -,961 44 ,342
4812 -8,27 2,78 -8,60 2,13 -1,211 44 ,232
6031 -7,31 2,08 -7,62 2,22 -1,091 44 ,281
Table 5 - mean values and standard deviation of the distortion product difference with the background noise (a=DP-BN) obtained for the right and left ears – control group
F2 Hz Right Ear Left Ear
Mean A Standard Deviation Mean A Standard Deviation
593 0,47 6,25 1,27 6,45
750 -0,76 6,31 1,58 7,37
937 5,93 7,30 5,42 7,39
1187 10,89 8,18 8,73 8,05
1500 15,80 8,65 14,84 8,14
1906 21,36 9,30 19,04 7,44
2406 22,67 5,87 21,89 5,78
3031 20,31 6,57 18,82 5,87
3812 20,67 5,68 19,07 5,80
4812 16,27 5,42 15,09 4,94
6031 11,89 3,08 10,82 3,87
Table 6 - mean values, standard deviation and student t test (paired samples) in order to compare DP (distortion product) mean values obtai-ned for right and left ears – study group
F2 Hz Right Ear Left Ear t gl p-value
Mean value DP Standard Deviation Mean value DP Standard Deviation
593 9,46 11,10 11,71 8,31 -,966 34 ,341
750 5,00 6,04 5,29 6,73 -,233 34 ,817
937 7,80 6,41 7,51 6,36 ,210 34 ,835
1187 10,51 5,52 8,37 7,73 1,653 34 ,108
1500 15,03 5,46 13,00 7,19 2,396 34 ,022 (*)
1906 15,34 5,78 14,09 6,99 1,204 34 ,237
2406 15,49 6,34 14,34 5,70 1,145 34 ,260
3031 10,46 4,84 9,23 4,53 1,577 34 ,124
3812 10,77 5,92 10,34 4,29 ,415 34 ,680
4812 8,49 5,87 7,31 4,23 1,039 34 ,306
6031 4,89 5,97 2,80 5,66 1,646 34 ,109
Table 7 - mean values, standard deviation and student t test (paired samples) in order to compare BN (background noise) mean values obtai-ned for right and left ears – study group
F2 Hz Right Ear Left Ear t gl p-value
Mean value DP Standard Deviation Mean value DP Standard Deviation
593 8,03 8,77 8,57 8,85 -,313 34 ,756
750 1,74 8,06 1,66 7,14 ,072 34 ,943
937 0,17 6,37 0,51 4,87 -,311 34 ,757
1187 -2,23 4,83 -2,40 5,76 ,157 34 ,876
1500 -3,09 5,17 -3,06 5,54 -,036 34 ,971
1906 -5,26 4,41 -5,31 4,51 ,061 34 ,952
2406 -7,83 3,23 -8,11 3,25 ,372 34 ,712
3031 -10,23 4,02 -9,20 3,25 -1,298 34 ,203
3812 -9,14 2,98 -9,31 3,26 ,214 34 ,832
4812 -8,63 3,12 -8,26 2,21 -,549 34 ,586
6031 -7,34 2,03 -8,14 3,24 1,360 34 ,183
Table 8 - mean values and standard deviation of the distortion product difference with the background noise (a=DP-BN) obtained for the right and left ears – study group
F2 Hz Right Ear Left Ear
Mean A Standard Deviation Mean A Standard Deviation
750 3,26 7,32 2,66 7,62
937 7,63 7,38 7,00 7,19
1187 12,74 6,73 10,77 9,48
1500 18,11 7,34 15,94 8,11
1906 20,60 7,92 19,66 6,23
2406 23,31 6,90 22,23 6,86
3031 20,74 6,74 18,43 5,94
3812 19,91 5,56 19,66 4,99
4812 17,11 5,36 15,57 4,14
6031 12,23 4,99 10,94 4,49
Table 9 - mean values, standard deviation and student t test (independent samples) in order to compare DP (distortion product) mean values assessed by gender – control group
F2 Hz Male Female p-value 1 F p-value 2 t
Mean value DP Standard Deviation Mean value DP Standard Deviation
593 9,7692 7,7576 11,9737 8,9608 ,582 ,216
750 5,1154 8,6402 3,4737 7,5004 ,807 ,350
937 7,5192 6,5334 6,6579 6,6790 ,915 ,542
1187 11,4423 6,1911 8,4474 7,0966 ,743 ,036 (*)
1500 14,4615 6,3167 10,4474 8,1030 ,251 ,010 (*)
1906 16,0000 6,2151 14,0526 7,4360 ,117 ,180
2406 14,5962 4,6579 14,3158 6,1385 ,088 ,806
3031 10,0192 4,0752 10,5263 5,7127 ,075 ,624
3812 9,9231 5,0014 11,1842 6,1857 ,138 ,288
4812 6,9423 5,5850 7,8684 6,2522 ,333 ,462
6031 3,3462 4,9304 4,6316 4,1682 ,153 ,196
Table 10 - mean values, standard deviation and t-student test (independent samples) in order to compare BN assessed by gender – control group
F2 Hz Male Female p-value 1 F p-value 2 t
Mean value BN Standard Deviation Mean value BN Standard Deviation
593 9,3846 7,0909 10,3421 8,7774 ,021 ,582
750 4,0962 7,3518 3,8947 7,1236 ,886 ,897
937 1,9231 4,7023 0,8684 5,7147 ,096 ,340
1187 0,1346 5,7804 0,5263 4,8253 ,367 ,735
1500 -2,1923 5,7770 -3,0526 5,1933 ,742 ,469
1906 -4,9038 4,4336 -5,1842 3,6676 ,289 ,751
2406 -8,0769 2,9362 -7,4211 3,6364 ,981 ,347
3031 -9,0577 3,8573 -9,7105 4,0797 ,775 ,441
3812 -8,9231 2,8343 -10,0789 3,4041 ,114 ,083
4812 -8,5385 2,3218 -8,2895 2,6803 ,235 ,639
6031 -7,7308 2,4344 -7,1053 1,6240 ,008 ,148
Note: (1) Levene test for equality of variances, (2) t-Student test for independent samples
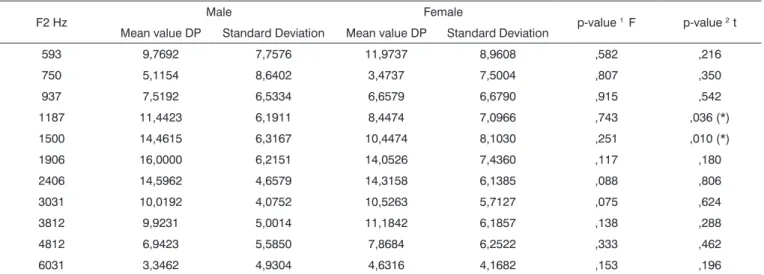
Table 11 - mean values, standard deviation and t-student test (independent samples) in order to compare DP mean values assessed by gen-der – study group
F2 Hz Male Female p-value 1 F p-value 2 t
Mean value DP Standard Deviation Mean value DP Standard Deviation
593 11,6563 10,5788 9,6842 9,1359 ,244 ,406
750 5,6563 6,2919 4,7105 6,4511 ,529 ,539
937 7,6875 5,0189 7,6316 7,3427 ,037 ,971
1187 9,6875 7,5024 9,2368 6,1444 ,549 ,783
1500 14,6563 4,7831 13,4737 7,5507 ,068 ,447
1906 13,7500 6,7633 15,5263 6,0437 ,171 ,250
2406 13,2813 6,1184 16,2895 5,6325 ,862 ,036 (*)
3031 9,0313 4,2539 10,5263 4,9850 ,267 ,186
3812 10,4688 4,1034 10,6316 5,9248 ,232 ,896
4812 7,2813 4,6851 8,4211 5,4556 ,410 ,357
6031 4,0938 5,7774 3,6316 6,0154 ,972 ,745
Note: (1) Levene test for equality of variances, (2) t-Student test for independent samples, (*) Significant at 5%
for the (F2) frequencies starting at 1500Hz for the control group and at 1187Hz for the study group.
DISCUSSION
The choice for distortion product - evoked otoa-coustic emissions was based on their wide clinical appli-cation:
1) in assessing the cochlear external hair cells function11;
2) it is frequency-specific;
3) recommended for use in babies and
4) are able to detect changes in auditory threshold
even before conventional tonal audiometry does9.
In order to obtain a better response amplitude and less background noise interference, distortion product-evoked otoacoustic emissions were applied to the popu-lation studied, following the criteria: F2/F1 equal to 1.2, geometric average of the F1 and F2 primary frequencies in 2F1-F2; and the stimuli intensities of F1 and F2 were of 65 dB SPL and 55 dB SPL (that is: L1=L2-10), respectively4.
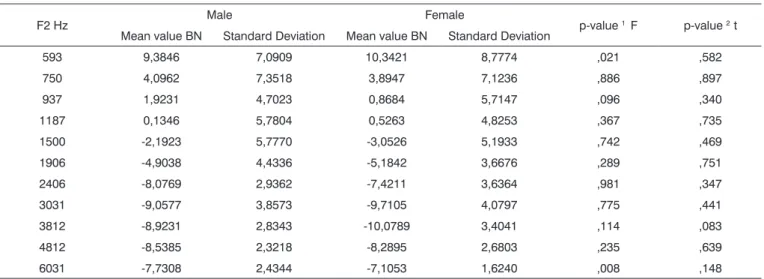
Table 12 - mean values, standard deviation and t-student test (independent samples) in order to compare BN mean values assessed by gen-der – study group
F2 Hz Male Female p-value 1 F p-value 2 t
Mean value DP Standard Deviation Mean value DP Standard Deviation
593 10,1875 8,0380 6,7105 9,1087 ,177 ,098
750 3,4688 6,5401 ,2105 8,1046 ,241 ,072
937 1,2188 5,0910 -,3947 6,0159 ,154 ,235
1187 -2,2188 5,1852 -2,3947 5,4204 ,918 ,891
1500 -3,4688 4,9186 -2,7368 5,6792 ,392 ,570
1906 -5,9063 3,9132 -4,7632 4,8123 ,115 ,285
2406 -7,7813 2,5870 -8,1316 3,6993 ,151 ,654
3031 -9,2188 3,3672 -10,1316 3,8985 ,247 ,303
3812 -9,0625 2,9175 -9,3684 3,2832 ,581 ,684
4812 -8,3750 2,4330 -8,5000 2,9201 ,961 ,848
6031 -7,5625 2,9614 -7,8947 2,5126 ,525 ,613
Note: (1) Levene test for variances analyses, (2) t-Student test for independent samples.
Table 13 - mean values, standard deviation and t-student test (independent samples) in order to compare DP mean values between the control and study groups
F2 Hz Control Study p-value 1 F p-value 2 t
Mean value DP Standard Deviation Mean value DP Standard Deviation
593 10,7000 8,3106 10,5857 9,7987 ,285 ,937
750 4,4222 8,1750 5,1429 6,3504 ,077 ,544
937 7,1556 6,5718 7,6571 6,3426 ,360 ,627
1187 10,1778 6,7167 9,4429 6,7516 ,931 ,494
1500 12,7667 7,3577 14,0143 6,4189 ,278 ,263
1906 15,1778 6,7866 14,7143 6,3978 ,355 ,661
2406 14,4778 5,3026 14,9143 6,0090 ,397 ,627
3031 10,2333 4,8112 9,8429 4,6924 ,653 ,607
3812 10,4556 5,5347 10,5571 5,1376 ,584 ,906
4812 7,3333 5,8598 7,9000 5,1136 ,192 ,522
6031 3,8889 4,6433 3,8429 5,8697 ,119 ,956
Note: (1) Levene test for equality of variances,(2) t-Student test for independent samples.
of response amplitude was seen at 1906 Hz and 2406 Hz, with values of 15.62 dBSPL and 14.51 dBSPL for the right ear, and values of 14.73 dBSPL and 14.44 dBSPL for the left ear in the same frequencies, respectively.
Authors such as Bonfils et al.14 (1993) and Abdala12
(1996) also found distortion product average amplitude responses in normal children with positive values in all the F2 frequencies tested.
As to the maximum response amplitude peaks, the literature shows values of 17.8 dBSPL in 2 KHz, of 16 dBSPL in 1.5 KHz12, of 17.26 dBSPL in 2 KHz, of 16.8 dBSPL in 1.5 KHz and of 17.4 dBSPL in 2 KHz. The results of the present investigation, in relation to the maximum
distortion product amplitude response, are in agreement with those found in the literature; in other words, in the F2 frequency ranged around 2 KHz.
Results from the present investigation agree with those who found background noise taking on higher values in the lower frequencies. Bonfils et al.14 (1993) reported
that the background noise had higher values in the lower frequencies and lower values in the higher frequencies. The same thing was noticed in the present study.
In regards to the difficulty in recording distortion product responses in the F2 frequencies, in the present investigation we observed that below the F2 frequency of 1500 Hz, despite positive values for response average amplitudes, background noise was high and hampered response interpretation.
In relation to average amplitudes, given by the distortion product (signal) response amplitude difference with the background noise amplitude (table 7), it was ob-served that values equal to or above 6dBSPL were present starting in the F2 frequency equal to or higher than 1187 Hz for the right and left ears, showing maximum peaks in 1906 Hz and 2406 Hz with values of 21.36 dBSPL and 22.67 dBSPL for the right ear and in 2406 Hz and 3812 Hz with values of 21.89 dBSPL and 19.07 dBSPL for the left ear, respectively.
We may see that the best signal/noise difference amplitude averages are obtained in the frequency range of F2 where the best distortion product response ampli-tudes are present, coinciding with the lower values for background noise.
When we applied the t-Student (paired samples) test to compare the distortion product amplitude responses and those of the background noise for the right and left ears, we did not observe statistically significant differences (p < 0.05) in any of the F2 frequencies tested.
In the present investigation, the distortion product
amplitude averages for both, the right and left ears of the study group varied according to F2 frequency, presenting positive values in all tested frequencies of 1187 Hz, 1500 Hz, 1906 Hz, 2406 Hz, 3031 Hz and 3812 Hz of the right ear and in the frequencies of 593 Hz, 1500 Hz, 1906 Hz, 2406 Hz and 3812 Hz of the left ear. A maximum response amplitude peak was seen at 1906 Hz and 2406 Hz with values of 15.03 dBSPL and 15.34 dBSPL for the right ear, and values of 14.09 dBSPL and 14.34 dBSPL for the left ear, respectively.
By using the t-Student (paired samples) test in order to compare the distortion product amplitude response averages evaluated for the left and right ears of the study group, there was a statistically significant difference be-tween the ears only in the F2 frequency of 1500 Hz, and the right ear presented better response amplitude averages when compared to the left ear. As seen above, there are controversies in relation to the ear side that presents the best response amplitudes, in other words, authors said they found better response amplitudes for the right ears, while others observed response amplitude averages similar for both the right and left ears. In the present investigation, only one F2 frequency (1500 Hz) presented response am-plitude averages that were better for the right ear when compared to the left ear in the study group.
We observed that the background noise measures for both the right and left ears of the study group presen-ted positive values for the lower frequencies, with high values in the F2 frequency of 593 Hz. It was also observed that the background noise decreased as the frequencies became higher, taking on negative values starting from F2 frequency of 1187 Hz for both ears (Table 9). Maximum peak of negative values for background noise occurred in Table 14 - mean values, standard deviation and t-student test (independent samples) in order to compare BN mean values between the control and study groups
F2 Hz Control Study p-value 1 F p-value 2 t
Mean value BN Standard Deviation Mean value BN Standard Deviation
593 9,7889 7,8146 8,3000 8,7499 ,256 ,258
750 4,0111 7,2165 1,7000 7,5572 ,490 ,051
937 1,4778 5,1499 ,3429 5,6309 ,471 ,186
1187 ,3000 5,3725 -2,3143 5,2765 ,892 ,002 (*)
1500 -2,5556 5,5244 -3,0714 5,3197 ,414 ,552
1906 -5,0222 4,1080 -5,2857 4,4303 ,981 ,698
2406 -7,8000 3,2471 -7,9714 3,2212 ,837 ,740
3031 -9,3333 3,9434 -9,7143 3,6679 ,858 ,533
3812 -9,4111 3,1226 -9,2286 3,1029 ,839 ,713
4812 -8,4333 2,4680 -8,4429 2,6899 ,751 ,981
6031 -7,4667 2,1421 -7,7429 2,7117 ,034 ,486
the frequencies of 3031 Hz and 3812 Hz, with values of -10.23 dBSPL and -9.14 dBSPL, for the right ear, and with values of -9.20 dBSPL and -9.31 dBSPL, for the left ear.
When we applied the t-Student (paired samples) test to compare background noises assessed for right and left ears, we did not find statistically significant differences between the ears, corroborating some aforementioned authors.
The amplitude averages of the signal/noise differen-ce in the study group for the right and left ears presented values equal to or superior than 6 dBSPL from the F2 frequency of 937 Hz, showing maximum peaks of 20.60 dBSPL; 23.21 dBSPL and 20.74 dBSPL in the frequencies of 1906 Hz, 2406 Hz and 3031 Hz, for the right ear; and of 19.66 dBSPL; 22.23 dBSPL and 19.66 dBSPL in the fre-quencies of 1906 Hz, 2406 Hz and 3812 Hz, for the left ear, respectively (Table 10).
The best signal/noise ratio amplitude mean values were seen in the frequency range where the distortion product response amplitudes were broader and the ba-ckground noise was lower.
When we compared the response amplitude mean values by the t-Student test (independent samples) in rela-tion to gender for the control group, we observed a statis-tically significant difference (p>0.05) in two F2 frequencies only (1187 Hz and 1500 Hz), and males had better average values (11.44 dBSPL and 14.46 dBSPL) when compared to females (8.44 dBSPL and 10.44 dBSPL).
In regards of background noise, the mean values did not present statistically significant differences between males and females compared to the control group.
For the study group response amplitude mean va-lues (Table 13), the t-Student test (independent samples) for gender comparison, showed a statistically significant difference in one F2 frequency only (2406 Hz); when fe-males presented a better mean value (16.28 dBSPL) when compared to males (13.28 dBSPL).
There was no statistically significant difference among background mean values between the genders (table 14), when the t-Student test was used (independent samples).
According to what was presented, we can notice that while males had better distortion product mean am-plitude responses in two frequencies when compared to the control group, the same thing did not happen for the study group, in which women had better distortion product amplitude mean values in one frequency only.
We can see that exposure to occupational noise du-ring pregnancy did not affect the headu-ring of children born from exposed mothers. The literature is scarce in studies about newborns’ and infants’ hearing, whose mothers were exposed to occupational noise during pregnancy. Lalande et al.27 (1986), in their study, stated that the proportion
of children with significant hearing loss in 4 KHz was 3
to 4 times greater when their mothers had been exposed to sound pressures of 85 to 95 dBSPL in comparison to lower noise doses, and also that the lower frequencies are more affected.
Ando and Hattori23 (1970) reported on the greater
skill the child had in adapting to the growing environ-mental noise when their mothers were exposed to noise during pregnancy, however they did not evaluate
possi-ble hearing loss. Gerhardt and Abrams21 (2000) reported
hearing loss in the fetuses of mothers who were exposed to noise during pregnancy. However, in our study we did not notice hearing loss in fetuses from mothers exposed to occupational noise.
CONCLUSION
We did not notice a harmful effect on the hearing of children born from women exposed to occupational noise during pregnancy - evaluated by means of distortion product otoacoustic emissions, when compared to children born from women who were not exposed to occupational noise during pregnancy.
REFERENCES
1. Silveira JAM, Brandão ALA, De Rossi J, Ferreira LLA, Name MAM, Estefan P, Gonçalez F. Avaliação da alteração auditiva provocada pelo uso do walkman, por meio da audiometria tonal e das emissões otoacústicas (produtos de distorção): estudo de 40 orelhas. Rev Bras Otorrinolaringol 2001;65(5):650-4.
2. Martin GK, Ohlms LA, Franklin DJ, Harris FP, Lonsbury-Martin BL. Distortion product emissions in human. Influence of sensorineural hearing loss. Ann Otol Rhinol Laryngol Suppl 1990;147:30-42. 3. Probst R, Lonsbury-Martin BL, Martin GK, Coats AC. Otoacoustic
emissions in ears with hearing loss. Am J Otolaryngol 1987;8:73-81. 4. Harris FP, Lonsbury-Martin BL, Stagner BB, Coats AC, Martin GK.
Acoustic distortion products in humans: systematic changes in am-plitudes as a function of f2/f1 ratio. J Acoust Soc Am 1989;85(1):220-9.
5. Fukuda C, Munhoz MSL, Toledo FB, Hassan SE. Emissões otoacústicas por produto de distorção em trabalhadores expostos a ruído. Acta AWHO 1998;17(4):176-85.
6. Garcia AP, Snege YC, Azevedo MF, Soares E. Emissões otoacústicas evocadas transientes e emissões otoacústicas evocadas por produto de distorção em adultos normais: estudo dos desvios transitórios do limiar de audibilidade após exposição ao ruído. Pró-Fono Revista de Atualização Científica 1999;11(2):53-60.
7. Kimberley BP. Applications of distortion-product emissions to an otological practice. Laryngoscope 1999;109(12):1908-18.
8. Ferreira LLA, Silveira JAM, Percebo CC, Gonçalez F. Perda auditiva in-duzida por ruído: análise dos achados de audiometria tonal, potenciais evocados do tronco cerebral e emissões otoacústicas evocadas por produto de distorção. Rev Bras Otorrinolaringol 2001;67(1):9-14. 9. Gattaz G, Wazen SRG. O registro das emissões otoacústicas evocadas
- produto de distorção em pacientes com perda auditiva induzida pelo ruído. Rev Bras Otorrinolaringol 2001;67(2):213-18.
10. Kemp DT, Ryan S. Otoacoustic emission tests in neonatal screening programmes. Acta Otolaryngol (Stockh) 1991;482:73-84.
11. Lopes Filho O, Carlos R, Redondo MC. Produtos de distorção das emissões otoacústicas. Rev Bras de Otorrinolaringol 1995;61(6):485-94.
as a function of f2/f1 frequency ratio and primary tone level separation in human adults and neonates. J Acoust Soc Am 1996;100(6):3726-40.
13. Pelosi G, Hatzopoulos S, Chierici R, Vigi V, Martini A. Distortion product otoacoustic emission (DPOAEs) and newborn hearing scre-ening: a feasibility and performance study. Acta Otorhinolaryngol Ital 2000;20(4):237-44.
14. Bonfils P, Avan P, François M, Loundon N, Elbez M, Tritoux J, Narcy Ph. Dépistage de la surdité du jeune enfant - Intérêt, modalités tech-niques, résultats préliminaires des produits de distorsion acoustique. Ann Oto-Laryng (Paris) 1993;110:3-9.
15. Eckley CA, Duprat A, Lopes Filho O. Revisão: Emissões otoacústicas. Rev Bras Otorrinolaringol 1993;59(1):41-44.
16. Mir Plana B, Sequi Canet JM, Paredes Cencillo C, Brines Solanes J. Influence of the middle ear on the measurement of otoacoustic emissions. Rev Esp Pediatr 1997;47(2):162-6.
17. Pialarissi PR, Gattaz G. Emissões otoacústicas: conceitos básicos e aplicações clínicas. Arq Fund Otorrinolaringol 1997;1(2):36-39. 18. Pourbakht A, Sheykholeslami K, Kaga K. Distortion evoked
otoa-coustic emission using GSI 70 analyzer for neonatal screening. Int J Pediatr Otorhinolaryngol 2002;64(3):217-23.
19. Feinberg JS, Kelley CR. Pregnant workers. A physician’s guide to assessing safe employment. West J Med 1998;168(2):86-92. 20. Gerhardt KJ, Abrams RM, Oliver CC. Sound environment of the fetal
sheep. Am J Obstet Gynecol 1990;162(1):282-7.
21. Gerhardt KJ, Abrams RM. Fetal exposures to sound and vibroacoustic stimulation. J Perinatol 2000;20(8Pt2):21-30.
22. Niemtzow RC. Loud noise and pregnancy. Military Medicine 1993;158:10-2.
23. Ando Y, Hattori H. Effects of intense noise during fetal life upon postnatal adaptability (statistical study of the reactions of babies to aircraft noise). J Am Acoust Soc 1970;47(4):1128-30.
24. Ando Y, Hattori H. Effects of noise on human placental lactogen (HPL) levels in maternal plasma. Br J Obstet Gynaecol 1977;84(2):115-8. 25. Zhang J, Cai WW, Lee DJ. Occupational hazards and pregnancy
outcomes. Am J Ind Med 1992;21:397-408.
26. Murata M, Takigawa H, Sakamoto H. Teratogenic effects of noise and cadmium in mice: does noise have teratogenic potencial? J Toxicol Environ Health 1993;39(2):237-45.
27. Lalande NM, Hétu R, Lambert J. Is occupational noise exposure during pregnancy a risk factor of damage to the auditory system of the fetus? Am J Ind Med 1986;10(4):427-35.
28. Hartikainen AL, Sorri M, Anttonen H, Tuimala R, Läärä E. Effect of occupational noise on the course and outcome of pregnancy. Scand J Work Environ Health 1994;20(6):444-50.
29. Wu TN, Chen LJ, Lai JS, Ko GN, Shen CY, Chang PY. Prospective study of noise exposure during pregnancy on birth weight. Am J Epidemiol 1996;143(8):792-6.