Contributions of T Lymphocyte Abnormalities
to Therapeutic Outcomes in Newly
Diagnosed Patients with Immune
Thrombocytopenia
Zhenhua Zhao1☯, Lei Yang2☯, Guohua Yang2, Yun Zhuang2, Xifeng Qian2, Xin Zhou2,
Dajiang Xiao1*, Yunfeng Shen2*
1Department of Otolaryngology, Nanjing Medical University Affiliated Wuxi Second Hospital, Wuxi, Jiangsu, 214002, People's Republic of China,2Department of Hematology, Wuxi People’s Hospital Affiliated to Nanjing Medical University, Wuxi, Jiangsu, 214023, People's Republic of China
☯These authors contributed equally to this work.
*[email protected](YFS);[email protected](DJX)
Abstract
T cell abnormalities have been reported to play an important role in pathogenesis of immune thrombocytopenia (ITP) besides specific autoantibodies towards platelet. The aim of this study was to explore the clinical importance of T lymphocyte subsets in adult patients with newly diagnosed ITP before and after first-line treatment. Elderly ITP patients were also studied and we tried to analyze the relationships between these items and therapeutic out-comes. The patients were treated with intravenous immunoglobulin (IVIG) plus corticoste-roids and therapeutic responses were evaluated. As a result, compared with the controls, absolute lymphocyte counts in ITP patients decreased significantly before treatment. After treatment, lymphocyte counts restored to control level regardless of their treatment out-comes. In addition, we observed increased IgG and CD19+cell expression and decreased CD4+/CD8+cell ratio in both whole ITP group and elderly group before treatment. After treatment, the increased IgG and CD19+cell expression could be reduced in both respond and non-respond group regardless of patient age, while CD4+/CD8+cell ratio could not be corrected in non-respond ITP patients. In non-respond ITP patients, increased CD8+cell ex-pression was noticed and could not be corrected by first-line treatment. Furthermore, even lower NK cell expression was found in non-respond elderly patients after treatment when compared with that in controls. Our findings suggest that ITP patients usually had less num-bers of peripheral lymphocytes and patients with higher levels of CD8+cells or lower levels of CD4+/CD8+cell ratio were less likely to respond to first-line treatment. Lower levels of NK cells made therapies in elderly ITP patients even more difficult.
OPEN ACCESS
Citation:Zhao Z, Yang L, Yang G, Zhuang Y, Qian X, Zhou X, et al. (2015) Contributions of T Lymphocyte Abnormalities to Therapeutic Outcomes in Newly Diagnosed Patients with Immune Thrombocytopenia. PLoS ONE 10(5): e0126601. doi:10.1371/journal. pone.0126601
Academic Editor:Jagadeesh Bayry, Institut National de la Santé et de la Recherche Médicale (INSERM), FRANCE
Received:December 12, 2014
Accepted:April 3, 2015
Published:May 15, 2015
Copyright:© 2015 Zhao et al. This is an open access article distributed under the terms of the
Creative Commons Attribution License, which permits unrestricted use, distribution, and reproduction in any medium, provided the original author and source are credited.
Data Availability Statement:All relevant data are within the paper.
Funding:This work was supported by grants from National Natural Science Foundation of China (No. 81300382). The funders had no role in study design, data collection and analysis, decision to publish, or preparation of the manuscript.
Introduction
Immune thrombocytopenia (ITP) is an immune-mediated bleeding disorder in which platelets are opsonized by autoantibodies and destroyed by macrophages in the spleen[1–3]. Although autoantibodies mediated platelet destruction is considered to play a crucial role, increasing evi-dence suggests that the mechanism of ITP is complicated. Autoantibodies mediated dysmega-karyocytopoiesis may also contribute to thrombocytopenia[4–5]. In recent decade, T-cell-mediated immune abnormalities have been considered equally important in the pathogenesis of ITP. T cell abnormalities include a significant shift towards T helper (Th) 1 cells and Th17 pro-inflammatory immune responses[6–7], the decreased number or defective function of reg-ulatory T cells (Treg)[8–9], and the platelet destruction by cytotoxic T lymphocytes (CTLs) [10–13]. There are also several reports of different amounts of natural killer (NK) cells that are nevertheless functionally defective in peripheral blood from ITP patients[14–16].
The incidence of ITP is thought to be higher in women of reproductive age. Recently, more and more epidemiological data have found that the incidence of ITP increases with age, espe-cially in those elderly patients (ages60)[17–18]. In elderly patients with ITP, most have chronic disease courses, more common hemorrhagic events, poor response to various treat-ment options and thus high mortality directly associated with disease itself[19–20]. Further-more, clinicians need to pay much more attention to the treatment of elderly ITP patients.
Although ITP is well known nowadays and the first line treatments for ITP patients focus on corticosteroids and intravenous immunoglobulin(IVIG), the diagnosis is still exclusive and the therapies are non-specific. The phases, severity of bleeding, mortality and sensitivity to treatments vary widely in ITP patients[21–22], which makes the disease heterogeneous. Indi-vidualized treatments are urgent according to different disease mechanisms, different ages and maybe different clinical bleeding symptoms.
In this retrospective study, we investigated absolute lymphocyte counts, IgG levels and T lymphocyte subsets in peripheral blood of 61 adult patients with newly diagnosed ITP before and after first-line treatment. The situations of elderly patients were emphasized in our study and we tried to analyze the association between these items and therapeutic outcomes.
Materials and Methods
Patients and controls
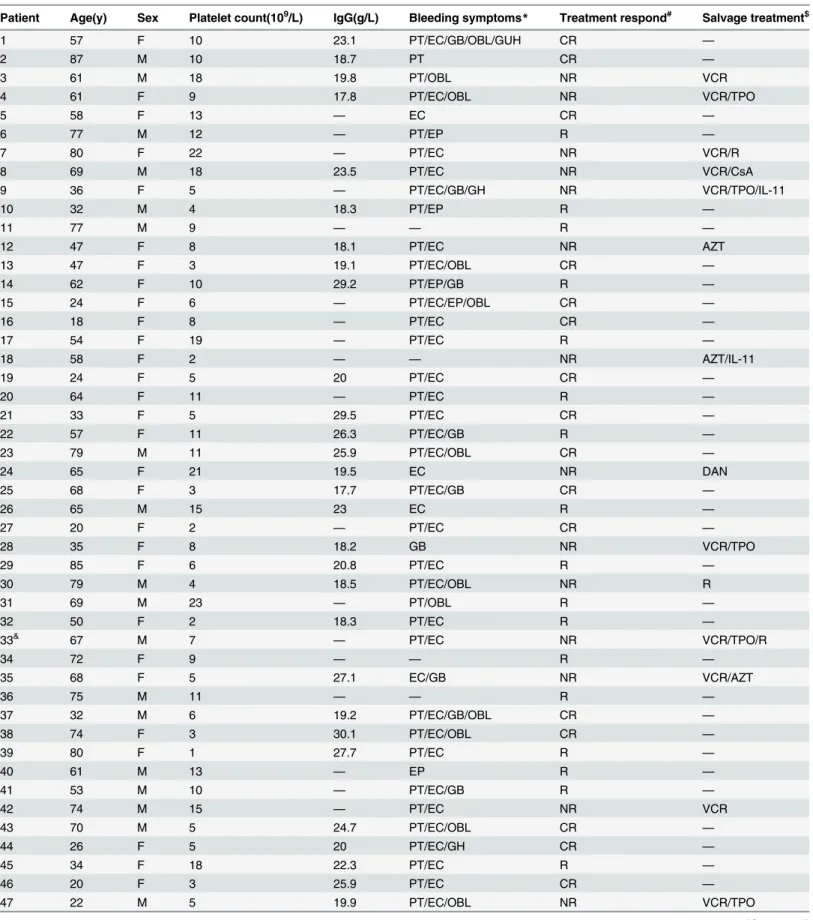
Table 1. Patients with newly diagnosed ITP.
Patient Age(y) Sex Platelet count(109/L) IgG(g/L) Bleeding symptoms
* Treatment respond# Salvage treatment$
1 57 F 10 23.1 PT/EC/GB/OBL/GUH CR —
2 87 M 10 18.7 PT CR —
3 61 M 18 19.8 PT/OBL NR VCR
4 61 F 9 17.8 PT/EC/OBL NR VCR/TPO
5 58 F 13 — EC CR —
6 77 M 12 — PT/EP R —
7 80 F 22 — PT/EC NR VCR/R
8 69 M 18 23.5 PT/EC NR VCR/CsA
9 36 F 5 — PT/EC/GB/GH NR VCR/TPO/IL-11
10 32 M 4 18.3 PT/EP R —
11 77 M 9 — — R —
12 47 F 8 18.1 PT/EC NR AZT
13 47 F 3 19.1 PT/EC/OBL CR —
14 62 F 10 29.2 PT/EP/GB R —
15 24 F 6 — PT/EC/EP/OBL CR —
16 18 F 8 — PT/EC CR —
17 54 F 19 — PT/EC R —
18 58 F 2 — — NR AZT/IL-11
19 24 F 5 20 PT/EC CR —
20 64 F 11 — PT/EC R —
21 33 F 5 29.5 PT/EC CR —
22 57 F 11 26.3 PT/EC/GB R —
23 79 M 11 25.9 PT/EC/OBL CR —
24 65 F 21 19.5 EC NR DAN
25 68 F 3 17.7 PT/EC/GB CR —
26 65 M 15 23 EC R —
27 20 F 2 — PT/EC CR —
28 35 F 8 18.2 GB NR VCR/TPO
29 85 F 6 20.8 PT/EC R —
30 79 M 4 18.5 PT/EC/OBL NR R
31 69 M 23 — PT/OBL R —
32 50 F 2 18.3 PT/EC R —
33& 67 M 7 — PT/EC NR VCR/TPO/R
34 72 F 9 — — R —
35 68 F 5 27.1 EC/GB NR VCR/AZT
36 75 M 11 — — R —
37 32 M 6 19.2 PT/EC/GB/OBL CR —
38 74 F 3 30.1 PT/EC/OBL CR —
39 80 F 1 27.7 PT/EC R —
40 61 M 13 — EP R —
41 53 M 10 — PT/EC/GB R —
42 74 M 15 — PT/EC NR VCR
43 70 M 5 24.7 PT/EC/OBL CR —
44 26 F 5 20 PT/EC/GH CR —
45 34 F 18 22.3 PT/EC R —
46 20 F 3 25.9 PT/EC CR —
47 22 M 5 19.9 PT/EC/OBL NR VCR/TPO
transfusions or pregnancies. Platelet counts ranged from 135 to 280×109/L, with the median count of 205×109/L.
Treatment
Patients with newly diagnosed ITP (platelet counts less than 30×109/L and/or with bleeding) in this retrospective study were all treated with IVIG (400 mg/kg per day for 5 days) plus cortico-steroids(most frequently prednisone at 1.0 mg/kg per day for 1–3 weeks, then tapered) accord-ing to first-line treatment standardization[22]. Some patients with severe bleeding were also given platelet transfusion in order to quickly increase platelet counts. In addition to standard therapy, vincristine, rituximab, azathioprine, danazol, cyclosporine, interleukin-11 and TPO were used as salvage therapy on non-respond patients.
Treatment responses and follow-up
Treatment responses were evaluated according to the consensus definition of the International Working Group[21].“Complete response”(CR) was defined as a platelet count equal to or greater than 100×109/L and absence of bleeding.“Response”(R) was defined as a platelet count equal to or greater than 30×109/L and at least 2-fold increase the baseline count and absence of bleeding, and“no response”(NR) was defined as a platelet count lower than 30×109/L or less than 2-fold increase of baseline platelet count or bleeding. For each patient, the observation riod started on the day of the initial diagnosis. Patients were followed until the observation pe-riod ended on August 30, 2013or until death (due to any cause) if it occurred before this date.
Statistical analysis
This study was approved by ethics committee of Wuxi People’s Hospital. In this study, we ana-lyzed lymphocyte numbers, IgG levels and T lymphocyte subsets in ITP patients before and
Table 1. (Continued)
Patient Age(y) Sex Platelet count(109/L) IgG(g/L) Bleeding symptoms
* Treatment respond# Salvage treatment$
48 35 M 5 17.2 PT/EC CR —
49 25 F 2 31.4 PT/EC/GB CR —
50 73 F 0 17.8 EC/GB R —
51 26 F 13 21.5 PT/EC CR —
52 46 F 20 — PT/EP/GB CR —
53 38 F 5 — PT/EC/OBL CR —
54 56 M 9 16.4 EP/GB R —
55 45 M 25 11 PT/EC NR VCR
56 44 F 14 23 PT/EC/OBL R —
57 74 F 9 19.2 PT/EC/EP/OBL R —
58 65 F 2 25.3 PT/EC NR VCR/TPO
59 61 M 12 21.1 GB/OBL R —
60 70 M 16 15.8 PT/EC/GB/OBL NR R
61 32 M 10 12.6 EP/GB CR —
*PT, petechiae; EC, ecchymoses; EP, epistaxis; GUH, genitourinary hemorrhage; GH, gingival hemorrhage; GB, gums bleeding; OBL, oral blood blister. # CR, complete response; R, response; NR, no response.
$ VCR, vincristin; R, rituximab; AZT, azathioprine; DAN, danazol; CsA, cyclosporine; IL-11, interleukin-11. & The patient died of cerebral hemorrhage.
seven days after treatment. Since this is a retrospective study, all data including those of control samples were identified from the hospital’s database and analyzed anonymously, no consent was given. We checked all the items on the STROBE checklist of case-control studies as well (S1 STROBEChecklist). All data are presented as mean plus or minus standard deviation (SD). Categorical variables between groups were compared using the Chi-square test. Quantitative values were analyzed by the One-way ANOVA test of parametric data and Kruskal-Wallis test of nonparametric data. Paired Student’s t test was used to assess values of ITP patients before and after treatment. A P value of<0.05 was regarded as statistically significant in two-sided
tests. Data were analyzed using SPSS statistical software version 18 (SPSS, Chicago, IL, USA).
Results
Responses to first-line treatment
Of the 61 patients included in this retrospective study, 44 (72.13%) displayed CR or R, and 17 (27.87%) displayed NR to treatment. Of the 30elderly patients (age60 years), 19 (63.33%) displayed CR or R, and 11(36.67%) displayed NR to treatment. There was no significant differ-ence in the response rate between the whole patient group and the elderly group (p = 0.47). Al-though skin bleeding, oral blood blister, epistaxis and gingival bleeding were frequently seen in our ITP patients, severe bleeding events, especially life-threatening ones, were much less com-mon. Among the seventeen NR patients, five became chronic. And of these five patients, three were old patients with low platelet count but no severe bleeding at the time of diagnosis. One elderly patient who resisted to the first-line treatment became refractory after salvage treat-ments and died of cerebral hemorrhage in the end (Table 1).
Absolute lymphocyte counts in different analyzing groups before and
after treatment
Compared with absolute lymphocyte counts (ALC) in the control group (mean±SD, 1.81 ±0.76×10⁹/L), ALC in ITP group (1.13±0.53×10⁹/L, P<0.01) was much lower before treatment,
and so was that number in elderly ITP patients (1.02±0.38×10⁹/L, P<0.01). Regardless of the
treatment outcomes and patient age, ALC in ITP groups were much lower than that in controls before treatment (Fig 1). After first-line treatment, as shown inTable 2, ALC in ITP groups with different outcomes or ages increased and showed no significant differences with the controls.
IgG and T lymphocyte subsets expression in different groups before
treatment
The levels of serum IgG (21.33±4.64 g/L, P<0.001) and CD19+cell percentage(17.27±9.14%,
P<0.01) in ITP patients were higher than those in control group (11.15±4.61 g/L, 12.47
±2.19%),respectively (Fig 2A). And so were those in elderly ITP group when compared with the controls, which were 22.16±4.28 g/L (P<0.001) and 15.94±6.68% (P<0.05) respectively.
However, serum IgG and CD19+cell percentage did not differ significantly between the ITP group and the elderly ITP group. A significant reduction in CD4+/CD8+cell ratio was seen in both ITP group (1.29±0.61, P<0.01) and elderly ITP group (1.32±0.62, P<0.05) compared
IgG and T lymphocyte subsets expression in different outcome groups of
ITP patients before treatment
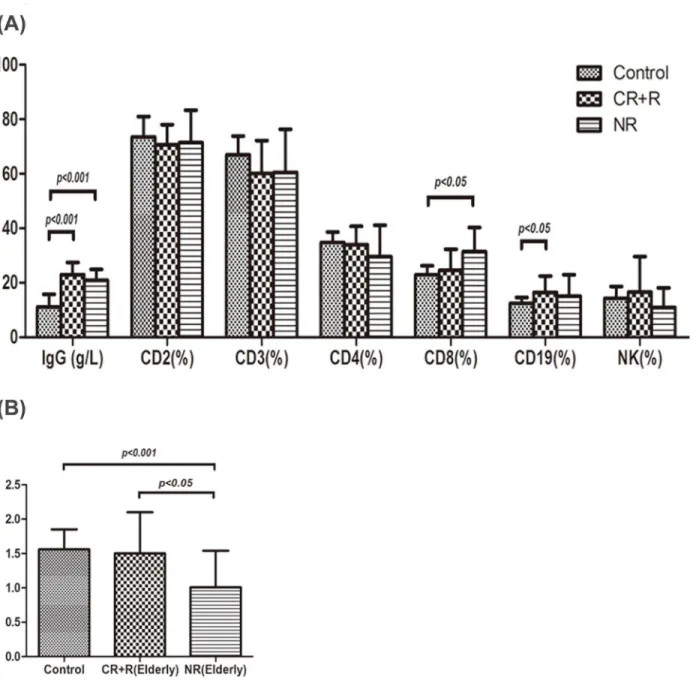
As shown inFig 3A, IgG levels in healthy controls, respond group (CR+R) and non-respond group (NR) were 11.15±4.61g/L, 22.07±4.65 g/L, 19.54±4.28 g/L, respectively. IgG expression in both respond and non-respond group were remarkably higher than that in controls before treatment (P<0.001), but there was no significant difference between respond and
non-re-spond group. CD3+cell percentage in respond group was 59.00±12.08%, which was lower than that in controls (66.98±6.86%, P<0.05). CD19+cell percentage in respond group was 17.88
±9.45%, which was higher than that in controls (12.47±2.19%, P<0.05). Increased CD8+cell
percentage was observed in non-respond group (32.42±8.07%, P<0.01) compared with that in
controls (22.99±3.24%) and respond group (24.13±7.83%). A significant reduction in CD4+/ CD8+cell ratio was seen in non-respond group (0.98±0.50) compared with that in controls (1.56±0.29, P<0.001) and respond group (1.42±0.61, P<0.01), shown inFig 3B.
IgG and T lymphocyte subsets expression in different outcome groups of
elderly ITP patients before treatment
As shown inFig 4A, IgG levels in healthy controls, respond group (CR+R) and non-respond group (NR) were 11.15±4.61g/L, 22.99±4.46 g/L, 20.91±3.95 g/L, respectively. IgG expression
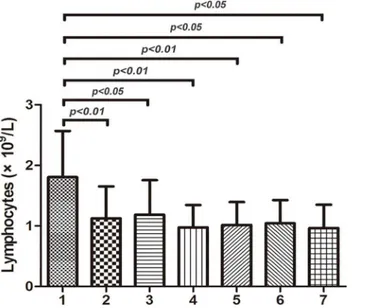
Fig 1. Absolute lymphocyte counts in different analyzing groups before treatment.Absolute
lymphocyte counts (ALC) in group1 (control group), group2 (ITP group), group3 (respond ITP group), group4 respond ITP group), group5 (elderly ITP group), group6 (respond elderly ITP group), group7 (non-respond elderly ITP group) were 1.81±0.76×10⁹/L, 1.13±0.53×10⁹/L, 1.19±0.57×10⁹/L, 0.98±0.37×10⁹/L, 1.02±0.38×10⁹/L, 1.04±0.38×10⁹/L, 0.97±0.38×10⁹/L, respectively. Regardless of the treatment outcomes and patient age, ALC in ITP groups were much lower than that in controls before treatment (P<0.05).
doi:10.1371/journal.pone.0126601.g001
Table 2. Absolute lymphocyte counts in different analyzing groups before and after treatment (×109/L).
ITP ITP(CR) ITP(NR) Elderly ITP Elderly ITP(CR) Elderly ITP(NR)
Before treatment 1.13±0.53 1.19±0.57 0.98±0.37 1.02±0.38 1.04±0.38 0.97±0.38 After treatment 1.62±0.70*** 1.74±0.73*** 1.30±0.48* 1.49±0.57*** 1.53±0.62*** 1.42±0.50*
***P<0.001 compared with that before treatment. *P<0.05 compared with that before treatment.
in both respond and non-respond group was remarkably higher than that in controls (P<0.001), but there was no significant difference between respond and non-respond group.
CD19+cell percentage in respond group was 16.46±6.03%, which was higher than that in con-trols (12.47±2.19%, P<0.05). Increased CD8+cell percentage was observed in non-respond
group (31.38±8.88%, P<0.05) compared with that in controls (22.99±3.24%). A significant
re-duction in CD4+/CD8+cell ratio was seen in non-respond group (1.01±0.53) compared with that in controls (1.56±0.29, P<0.001) and respond group (1.50±0.60, P<0.05), shown inFig
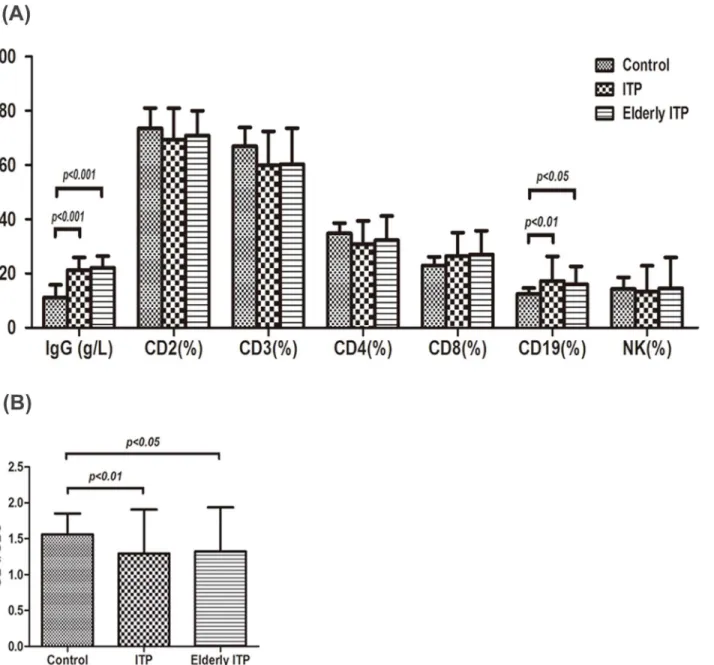
Fig 2. IgG and T lymphocyte subsets expression in different groups.(A) The levels of serum IgG (mean±SD, 21.33±4.64 g/L, P<0.001) and CD19+cell percentage (17.27±9.14%, P<0.01) in ITP patients were higher than those in control group (11.15±4.61 g/L, 12.47±2.19%),respectively. And so did those in elderly ITP group when compared with the controls, which were 22.16±4.28 g/L (P<0.001) and 15.94±6.68% (P<0.05) respectively. Serum IgG and CD19+ cell percentage did not differ significantly between the whole ITP patients and the elderly ITP patients. There were no remarkable differences in CD2+, CD3+, CD4+, CD8+and NK cell expression among the three groups. (B) A significant reduction in CD4+/CD8+cell ratio was seen in both ITP group (1.29±0.61, P<0.01) and elderly ITP group (1.32±0.62, P<0.05) compared with controls(1.56±0.29). CD4+/CD8+cell ratio did not differ significantly between the ITP patients and the elderly ITP patients.
4B. However, IgG and T lymphocyte subsets expression did not differ significantly between the whole ITP patients and the elderly patients in both respond and non-respond group before treatment.
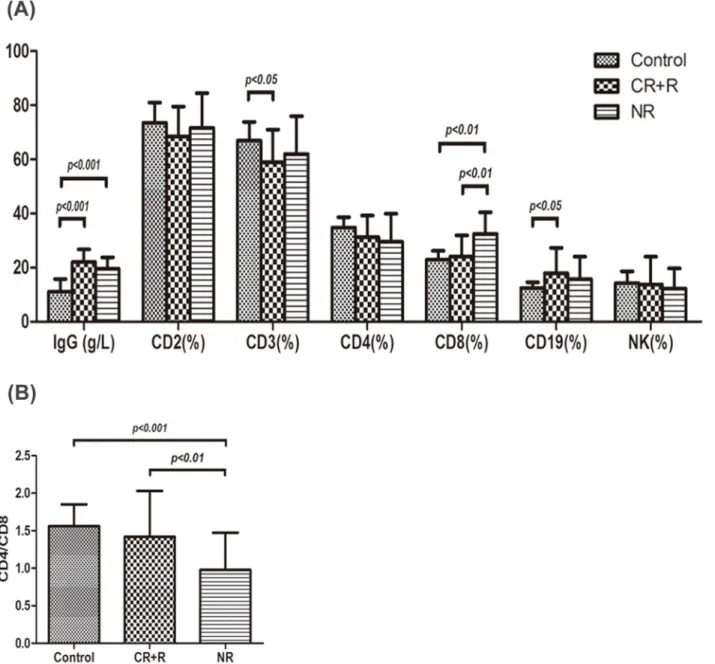
Fig 3. IgG and T lymphocyte subsets expression in different outcome groups of ITP patients.(A) IgG levels in healthy controls, respond group (CR+R) and non-respond group (NR) were 11.15±4.61g/L, 22.07±4.65 g/L, 19.54±4.28 g/L, respectively. IgG expression in both respond and non-respond groups were remarkably higher than that in controls (P<0.001), but there was no significant difference between the respond group and the non-respond group. CD3+ cell percentage in respond group was 59.00±12.08%, which was lower than that in controls (66.98±6.86%, P<0.05). CD19+cell percentage in respond group was 17.88±9.45%, which was higher than that in controls (12.47±2.19%, P<0.05). Increased CD8+cell expression was observed in non-respond group (32.42±8.07%, P<0.01) compared with that in controls (22.99±3.24%) and that in respond group (24.13±7.83%). There were no remarkable differences in CD2+, CD4+and NK cell expression among the three groups. (B) A significant reduction in CD4+/CD8+cell ratio was seen in non-respond group (0.98±0.50) compared with that in controls (1.56±0.29, P<0.001) and that in respond group (1.42±0.61, P<0.01).
IgG and T lymphocyte subsets expression in both ITP and elderly ITP
patients (CR+R) before and after first-line treatment
After treatment, the level of serum IgG (14.91±5.01 g/L, P<0.001) was much lower than that
before treatment (22.07±4.65 g/L) in respond ITP group, but still higher than that in controls (11.15±4.61 g/L, P<0.05). CD3+cell percentage in respond ITP group was 59.79±12.86%,
which was still lower than that in controls (66.98±6.86%, P<0.05). CD19+percentage was 12.55
Fig 4. IgG and T lymphocyte subsets expression in different outcome groups of elderly ITP patients.(A) IgG levels in healthy controls, respond group (CR+R) and non-respond group (NR) were 11.15±4.61g/L, 22.99±4.46 g/L, 20.91±3.95 g/L, respectively. IgG expression in both respond and non-respond groups were remarkably higher than that in controls (P<0.001), but there was no significant difference between the respond group and the non-respond group. CD19+cell percentage in respond group was 16.46±6.03%, which was higher than that in controls (12.47±2.19%, P<0.05). Increased CD8+cell expression was observed in non-respond group (31.38±8.88%, P<0.05) compared with that in controls (22.99±3.24%). There were no remarkable differences in CD2+, CD3+,CD4+and NK cell expression among the three groups. (B) A significant reduction in CD4+/CD8+cell ratio was seen in non-respond group (1.01±0.53) compared with that in controls (1.56±0.29, P<0.001) and that in respond group (1.50±0.60, P<0.05).
±5.48%, which was lower than that before treatment (17.88±9.45%, P<0.001) and did not
dif-fer significantly from the controls (Table 3).
After treatment, the level of serum IgG (16.21±4.01 g/L, P<0.001) was much lower than
that before treatment (22.99±4.46 g/L) in respond elderly ITP group, but still higher than that in controls (11.15±4.61 g/L, P<0.05). CD19+cell percentage in respond elderly ITP group was
11.78±4.91%, which was lower than that before treatment (16.46±6.03%, P<0.001) and did not
differ significantly from the controls (Table 3).
IgG and T lymphocyte subsets expression in both ITP and elderly ITP
patients (NR) before and after first-line treatment
After treatment, the levels of serum IgG (12.00±5.46 g/L, P<0.001) and CD19+cell percentage
(11.01±7.85%, P<0.05) were much lower than that before treatment (19.54±4.28 g/L, 12.47
±2.19%, respectively) in non-respond ITP group and did not differ significantly from the con-trols. CD8+cell percentage in non-respond ITP group was 31.09±7.55% after treatment, which was higher than that in controls (22.99±3.24%, P<0.05). A significant increase in CD4+/CD8+
cell ratio was seen in non-respond ITP group (1.05±0.33, P<0.05) after treatment when
com-pared with that before treatment (0.98±0.50), but still lower than that in controls (1.56±0.29, P<0.05)(Table 4).
After treatment, the level of serum IgG (13.75±5.59 g/L, P<0.001) was much lower than
that before treatment (20.91±3.95 g/L) in non-respond elderly ITP group and did not differ sig-nificantly from the controls. CD8+, NK cell percentage and CD4+/CD8+cell ratio in non-re-spond elderly ITP group after treatment were 31.82±8.23%, 8.79±5.58% and 1.00±0.28 respectively. They did not differ too much compared with those before treatment, but still dif-fered remarkably when compared with the controls (P<0.05)(Table 4).
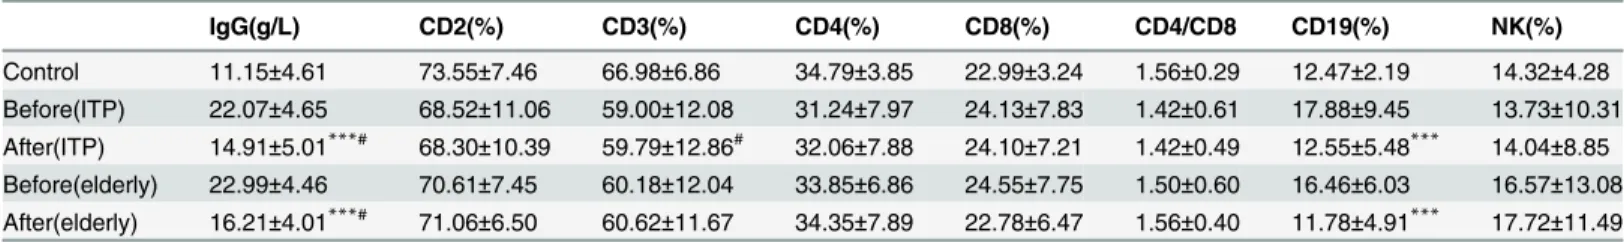
Table 3. IgG and T lymphocyte subsets expression in both ITP and elderly ITP patients (CR+R) before and after first-line treatment(mean±SD).
IgG(g/L) CD2(%) CD3(%) CD4(%) CD8(%) CD4/CD8 CD19(%) NK(%)
Control 11.15±4.61 73.55±7.46 66.98±6.86 34.79±3.85 22.99±3.24 1.56±0.29 12.47±2.19 14.32±4.28 Before(ITP) 22.07±4.65 68.52±11.06 59.00±12.08 31.24±7.97 24.13±7.83 1.42±0.61 17.88±9.45 13.73±10.31 After(ITP) 14.91±5.01***# 68.30±10.39 59.79±12.86# 32.06±7.88 24.10±7.21 1.42±0.49 12.55±5.48*** 14.04±8.85
Before(elderly) 22.99±4.46 70.61±7.45 60.18±12.04 33.85±6.86 24.55±7.75 1.50±0.60 16.46±6.03 16.57±13.08 After(elderly) 16.21±4.01***#
71.06±6.50 60.62±11.67 34.35±7.89 22.78±6.47 1.56±0.40 11.78±4.91*** 17.72±11.49
***P<0.001 compared with the group before treatment. #P<0.05 compared with the control group.
doi:10.1371/journal.pone.0126601.t003
Table 4. IgG and T lymphocyte subsets expression in both ITP and elderly ITP patients (NR) before and after first-line treatment(mean±SD).
IgG(g/L) CD2(%) CD3(%) CD4(%) CD8(%) CD4/CD8 CD19(%) NK(%)
Control 11.15±4.61 73.55±7.46 66.98±6.86 34.79±3.85 22.99±3.24 1.56±0.29 12.47±2.19 14.32±4.28 Before(ITP) 19.54±4.28 71.60±12.90 62.06±13.90 29.51±10.48 32.42±8.07 0.98±0.50 15.68±8.32 12.22±7.46 After(ITP) 12.00±5.46*** 71.46±11.56 64.59±11.56 31.22±8.46 31.09±7.55# 1.05±0.33
*# 11.01±7.85* 10.67±6.44 Before(elderly) 20.91±3.95 71.42±11.92 60.57±15.83 29.58±11.53 31.38±8.88 1.01±0.53 15.03±7.91 10.97±7.17 After(elderly) 13.75±5.59*** 72.66±13.11 64.71±13.15 30.92±9.23 31.82±8.23# 1.00±0.28# 11.04±9.40 8.79±5.58#
***P<0.001 compared with the group before treatment. *P<0.05 compared with the group before treatment. #P<0.05 compared with the control group.
Discussion
In this retrospective study, we analyzed absolute lymphocyte counts, IgG levels and T lympho-cyte subsets in peripheral blood of 61 adult patients with newly diagnosed ITP before and after treatment in our department. We also studied these items in elderly patients who accounted for a large population and tried to analyze the relationship between these immune parameters and therapeutic outcomes. This might be helpful for clinicians to choose alternative treatments for ITP patients, especially the increasing elderly ones.
In our study, the total response rates for all-age group (72.13%) and for elderly group (63.33%) were similar to that reported before[19–20,23].Decreased peripheral ALC were found in ITP groups with different treatment outcomes and different age groups before treatment. After treatment, ALC in these groups increased and showed no significant differences with the control level, which in turn confirmed an important role of lymphocytes in the pathogenesis of ITP once more. Previous reports discovered that initial lower ALC was a predictor of chronic or persistent ITP in children with acute ITP[24–26]. Hu et al[27] reported that ITP patients with a low ALC at diagnosis had an increased infection. In our study, five patients progressed to chronic ITP and the ALCs were 0.6×10⁹/L, 0.59×10⁹/L, 1.26×10⁹/L, 0.9×10⁹/L, 0.43×10⁹/L in each patient, which was really much off the normal average level. We need to further expand the sample size and look into the relationship between ALC and risk of infection too. Besides, we found that IgG expression and CD19+cell percentage in either whole ITP group or elderly group increased, but CD4+/CD8+cell ratio decreased. Although significant differences were observed between ITP patients and controls, there was not much difference between the whole group and elderly group. These results were consistent with what Wei et al[28] reported. These findings further confirmed that both humoral immunity and cellular immunity participated in the pathogenesis of ITP.
According to treatment responses, patients were divided into respond and non-respond groups. Respond group had increased IgG and CD19+cell expression and decreased CD3+cell expression while non-respond group had increased CD19+and CD8+cell expression with de-creased CD4+/CD8+cell ratio in the whole ITP group before treatment. The situation was al-most same in elderly ITP patients with different responses. After treatment with IVIG plus corticosteroids, increased IgG and CD19+cell expression were controlled while almost no changes in T cells were found in respond patients. With respect to non-respond patients after therapy, no significant differences were found in IgG and CD19+cell expression compared with the control group. However, CD8+cell percentage was still higher and CD4+/CD8+cell ratio was still lower than that in controls. We guess patients with higher levels of CD8+cells and lower levels of CD4+/CD8+cell ratio were less likely to respond to first-line treatment. It went well in elderly respond patients while CD8+cell expression and CD4+/CD8+cell ratio did not change much after treatment in elderly non-respond patients. These results showed statisti-cal differences when compared with the control group. Furthermore, we unexpectedly discov-ered that NK cell expression decreased after treatment in elderly non-respond patients and showed statistically difference from that in controls. It seemed that abnormal expression of NK cells made therapies in elderly ITP patients even more difficult.
impeding platelet clearance, may also increase platelet production and inhibit antibody pro-duction upon prolonged use. Although IVIG has been reported to inhibit the differentiation and amplification of Th17 cells[34] recently and influence T cell activity previously, the combi-nation of IVIG and corticosteroids seems to play a major role in regulating humoral immunity. Seite et al[35] reported IVIG-treated B cells show defects in activating coreceptor expression, calcium signaling, and BCR aggregation on engagement by antigen. Maddur et al[36] indicated that IVIG at therapeutic concentrations could directly inhibit the B cell activation and prolifer-ation through induction of anergy and apoptosis. Several other reports have also highlighted that the regulation of immune responses by IVIG can be indirect on B cells through suppress-ing the activation and functions of dendritic cells (DC), which can synchronize B cell growth, activation and secretion of immunoglobulins. Looking into our data, it turned out that CD19+ B cells were reduced after IVIG plus steroids treatment and so were their produced IgG in both respond and non-respond patients.
Second, the cellular immune pathogenesis of ITP appears to be associated with a Th cell de-fect which leads to abnormal cytokine secretion. These dede-fects are primarily responsible for di-recting autoreactive B cells to differentiate into autoantibody secreting plasma cells.CD4+T helper (Th) cells include Th1 cells (producing IFN-γ, IL-2, and TNF-β) and Th2 cells (produc-ing IL-4, IL-5, IL-6, IL-10, and IL-13). Th1 cytokines tend to promote a pro-inflammatory re-sponse to facilitate macrophage activation, proliferation of cytotoxic T cells and production of opsonizing antibodies.Th2 responses facilitate B-cell activation and proliferation and promote antibody production. The balance of Th1 and Th2 subsets regulates the immune response[37–
38]. Besides Th cells, cytotoxic T cells (CD8+T cells) from ITP patients may have direct lytic ef-fects on platelets. Furthermore, CD3+cells from ITP patients showed increased expression of genes involved in cell-mediated cytotoxicity relative to controls, such as TNF-α, perforin, gran-zyme A and B[10–12]. In this study, we observed differential expression of CD3+, CD8+cells and CD4+/CD8+cell ratio relative to controls, which was consistent with data showed before by others. Some of these abnormalities could be corrected while some not according to treat-ment sensitivity. T cell abnormalities in patients who were not responding could not be cor-rected by IVIG plus steroids treatment. Thus, it showed tolerance to the first line treatment and might be the reason why the disease became chronic and refractory.Th17 and Tregs are widely investigated recently and reported to be involved in the pathogenesis of many autoim-mune diseases including ITP. Maddur et al[39–40] presented that various IVIG preparations with respect to various parameters including stabilizing agents, formulation, source of plasma and IgG purification methods equally inhibited Th17 cell proliferation and IL-17 secretion, which was Fab dependent. In vitro and in vivo studies in experimental models have demon-strated that IVIG can expand Tregs in a cyclooxygenase-2(COX-2)-dependent induction of prostaglandin E2 (PGE2) way in human dendritic cells (DCs)[41–43]. Whether IVIG plays a role in this study by influencing the balance between Th17 cells and Tregs needs more investigation.
of NK cells in the peripheral blood by degranulation of granzyme B and perforin, we guess ad-ditional IVIG treatment beside steroids and different effects of drugs on NK cell activity apart from NK cell numbers might contribute to these different results. Semple et al[46] reported that there was a direct correlation between the duration of therapy and NK activity in ITP pa-tients and suppressed NK activity can be rescued by therapy. Karpovitch et al[47] found pred-nisone treatment did not significantly modify the function and expression of multidrug resistance-1 (MDR1), which is a well-recognized mechanism of chemoresistance, in T and NK cells of ITP patients. Further studies should focus on the effects of IVIG or corticosteroids ther-apy on NK cell expression or even NK cell activities. MRD1 might be another point we should concern too.
Recently, IVIG sialylation has been reported to play an important role in IVIG anti-inflam-mation response. However, results of the exact mechanisms are different and it still remains a challenge to the scientists. The mechanisms of action of IVIG involve a wide spectrum of Fab-mediated and, probably, distinct Fc-Fab-mediated mechanisms, that may or may not depend on IVIG sialylation[48–49]. Schwab et al[50] discovered a sialic acid and SIGNR1-dependent pathway was responsible for IVIG-mediated suppression of autoantibody-dependent platelet depletion in ITP mice. However, using another antibody-mediated experimental model of ITP, Leontyev et al[51] showed that the protective effect of IVIG was independent of sialylation of IgG. Moreover, use of IVIG enriched for Fab-sialylated IgG resulted in a decrease rather than an increase of the efficacy of IVIG in the used murine model of passive immune thrombocyto-penia[52]. In conclusion, it is likely that no single paradigm can entirely account for the mecha-nism of action of IVIG, even in a given disease model.
More and more studies have now found that the incidence of ITP increases with age[53–
54]. In elderly patients over 60 years of age with ITP, most have considerable comorbidities, more common major hemorrhagic events, high mortality directly associated with disease, chronic disease course and poor response to various treatment options[54–56]. In this study, almost half of the patients (30/61) were over 60 years of age and more than half (16/30) were those over 70 years of age. Common comorbidities observed in our elderly patients were hyper-tension, diabetes, anemia and coronary heart disease. A number of old patients (10%) were asymptomatic despite persistent thrombocytopenia. The remaining 90% patients showed signs of bleeding. This rate was higher than those described in the published literature for the all-age groups, but was similar to that in other series of elderly patients[20,57]. Although severe bleed-ing events, especially life-threatenbleed-ing ones, are much less common[58–59], in our research, among five patients who became chronic, three were elderly patients and the one died of cere-bral hemorrhage was 67 years of age. In these patients, IgG, CD19+and CD8+cell expressions were higher than controls before treatment. After treatment, IgG level and CD19+cell ex-pression were reduced but not CD8+cells. Then, with the ever increasing aging population, attention to the treatment of elderly ITP patients in clinical practice becomes much more important.
In conclusion, our study showed that the detection of T lymphocyte subsets might be help-ful for the diagnosis and determination of therapeutic outcomes of ITP patients. The levels of CD8+and NKT lymphocytes might be helpful prognostic markers in ITP patients especially in elderly ones. The aberrant immunocyte subsets might be related to complicated pathogenesis of ITP, and further researches are needed to confirm these findings with larger patient numbers and to fully investigate different treatment options responsible for these complicated mecha-nisms. These results may provide evidence for individualized clinical treatment and finally ben-efit ITP patients.
Supporting Information
S1 STROBE Checklist. Checklist of items included in this retrospective study. (PDF)
Author Contributions
Conceived and designed the experiments: YFS. Performed the experiments: ZHZ LY GHY. An-alyzed the data: YZ XFQ XZ DJX. Contributed reagents/materials/analysis tools: XFQ XZ. Wrote the paper: ZHZ LY GHY YZ DJX YFS.
References
1. Lazarus AH, Semple JW, Cines DB. Innate and adaptive immunity in immune thrombocytopenia. Semin Hematol. 2013; 50 Suppl 1:S68–70. doi:10.1053/j.seminhematol.2013.03.012PMID:23664521
2. Cines DB, Blanchette VS. Immune thrombocytopenic purpura. N Engl J Med. 2002; 346:995–1008. PMID:11919310
3. Semple JW, Provan D, Garvey MB, Freedman J. Recent progress in understanding the pathogenesis of immune thrombocytopenia. Curr Opin Hematol. 2010; 17:590–595. doi:10.1097/MOH.
0b013e32833eaef3PMID:20739879
4. Yang L, Wang L, Zhao CH, Zhu XJ, Hou Y, Jun P, et al. Contributions of TRAIL-mediated megakaryo-cyte apoptosis to impaired megakaryomegakaryo-cyte and platelet production in immune thrombocytopenia. Blood. 2010; 116:4307–4316. doi:10.1182/blood-2010-02-267435PMID:20671119
5. Wang L, Li Y, Hou M. Idiopathic thrombocytopenic purpura and dysmegakaryocytopoiesis. Crit Rev Oncol Hematol. 2007; 64:83–89. PMID:17900920
6. Rocha AM, Souza C, Rocha GA, de Melo FF, Clementino NC, Marino MC, et al. The serum levels of the cytokines involved in the Th17 and Th1 cell commitment are increased in individuals with borderline thrombocytopenia. J Hematol Oncol. 2013; 6:28. doi:10.1186/1756-8722-6-28PMID:23587441
7. Yazdanbakhsh K, Zhong H, Bao W. Immune dysregulation in immune thrombocytopenia. Semin Hematol. 2013; 50:S63–67. doi:10.1053/j.seminhematol.2013.03.011PMID:23664520
8. Sakakura M, Wada H, Tawara I, Nobori T, Sugiyama T, Sagawa N, et al. Reduced CD4+CD25+ T cells in patients with idiopathic thrombocytopenic purpura. Thromb Res. 2007; 120:187–193. PMID:
17067661
9. Yu J, Heck S, Patel V, Levan J, Yu Y, Bussel JB, et al. Defective circulating CD25 regulatory T cells in patients with chronic immune thrombocytopenic purpura. Blood. 2008; 112:1325–1328. doi:10.1182/ blood-2008-01-135335PMID:18420827
10. Olsson B, Andersson PO, Jernås M, Jacobsson S, Carlsson B, Carlsson LM, et al. T-cell-mediated cy-totoxicity toward platelets in chronic idiopathic thrombocytopenic purpura. Nat Med. 2003; 9:1123–
1124. PMID:12937414
11. Zhang F, Chu X, Wang L, Zhu Y, Li L, Ma D, et al. Cell-mediated lysis of autologous platelets in chronic idiopathic thrombocytopenic purpura. Eur J Haematol. 2006; 76:427–431. PMID:16480433
12. Zhao C, Li X, Zhang F, Wang L, Peng J, Hou M. Increased cytotoxic T-lymphocyte-mediated cytotoxici-ty predominant in patients with idiopathic thrombocytopenic purpura without platelet autoantibodies. Haematologica. 2008; 93:1428–1430. doi:10.3324/haematol.12889PMID:18757854
sensitive to therapy. Blood. 2010; 115:1247–1253. doi:10.1182/blood-2009-09-244772PMID:
20007808
14. Semple JW, Bruce S, Freedman J. Suppressed natural killer cell activity in patients with chronic autoim-mune thrombocytopenic purpura. Am J Hematol. 1991; 37:258–262. PMID:1858783
15. Talaat RM, Elmaghraby AM, Barakat SS, El-Shahat M. Alterations in immune cell subsets and their cy-tokine secretion profile in childhood idiopathic thrombocytopenic purpura (ITP). Clin Exp Immunol. 2014; 176:291–300. doi:10.1111/cei.12279PMID:24460857
16. Xu R, Zheng Z, Ma Y, Hu Y, Zhuang S, Wei B, et al. Elevated NKT cell levels in adults with severe chronic immune thrombocytopenia. Exp Ther Med. 2014; 7:149–154. PMID:24348781
17. Neylon AJ, Saunders PW, Howard MR, Proctor SJ, Taylor PR, Northern Region Haematology Group. Clinically significant newly presenting autoimmune thrombocytopenic purpura in adults: a prospective study of a population-based cohort of 245 patients. Br J Haematol. 2003; 122:966–974. PMID:
12956768
18. Segal JB, Powe NR. Prevalence of immune thrombocytopenia: analyses of administrative data. J Thromb Haemost. 2006; 4:2377–2383. PMID:16869934
19. Portielje JE, Westendorp RG, Kluin-Nelemans HC, Brand A. Morbidity and mortality in adults with idio-pathic thrombocytopenic purpura. Blood. 2001; 97:2549–2554. PMID:11313240
20. Michel M, Rauzy OB, Thoraval FR, Languille L, Khellaf M, Bierling P, et al. Characteristics and outcome of immune thrombocytopenia in elderly: results from a single center case-controlled study. Am J Hema-tol. 2011; 86:980–984. doi:10.1002/ajh.22170PMID:21956157
21. Rodeghiero F, Stasi R, Gernsheimer T, Michel M, Provan D, Arnold DM, et al. Standardization of termi-nology, definitions and outcome criteria in immune thrombocytopenic purpura of adults and children: re-port from an international working group. Blood. 2009; 113:2386–2393. doi: 10.1182/blood-2008-07-162503PMID:19005182
22. Provan D, Stasi R, Newland AC, Blanchette VS, Bolton-Maggs P, Bussel JB, et al. International con-sensus report on the investigation and management of primary immune thrombocytopenia. Blood. 2010; 115:168–186. doi:10.1182/blood-2009-06-225565PMID:19846889
23. Bizzoni L, Mazzucconi MG, Gentile M, Santoro C, Bernasconi S, Chiarotti F, et al. Idiopathic thrombocy-topenic purpura (ITP) in the elderly: clinical course in 178 patients. Eur J Haematol. 2006; 76:210–216. PMID:16412138
24. Bahoush G, Motamedi D, Vossough P. Initial lymphocyte count in patients with acute immune thrombo-cytopenic purpura: Can it predict persistence of the disease? Minerva Pediatr. 2014 [Epub ahead of print].
25. Deel MD, Kong M, Cross KP. Absolutelymphocyte counts as prognostic indicators for immune thrombo-cytopenia outcomes in children. Pediatr Blood Cancer. 2013; 60:1967–1974. doi:10.1002/pbc.24628
PMID:24038723
26. Ahmed I, Rajpurkar M, Thomas R. Initial lymphocyte count and the development of persistent/chronic immune thrombocytopenicpurpura. Pediatr Blood Cancer. 2010; 55:508–511. doi:10.1002/pbc.22570
PMID:20658623
27. Hu MH, Yu YB, Huang YC. Absolutelymphocyte count and risk of short-term infection in patients with immune thrombocytopenia. Ann Hematol. 2014; 93:1023–1029. doi:10.1007/s00277-014-2014-3
PMID:24441917
28. Rong W, Yanxiang Z, Shanshan X, Jumei S. Lymphocyte subsets in primary immune thrombocytope-nia. Blood Coagul Fibrinolysis. 2014; 25:816–819. doi:10.1097/MBC.0000000000000155PMID:
24911458
29. Fehr J, Hofman V, Kappeler U. Transient reversal of thrombocytopenia in idiopathic thrombocytopenic purpura by high-dose intravenous gamma globulin. N Engl J Med. 1982; 306: 1254–1258. PMID:
6803159
30. Ephrem A, Chamat S, Miquel C, Fisson S, Mouthon L, Caligiuri G, et al. Expansion of CD4+CD25+ reg-ulatory T cells by intravenous immunoglobulin: a critical factor in controlling experimental autoimmune encephalomyelitis. Blood. 2008; 111:715–722. PMID:17932250
31. Lutz HU, Stammler P, Bianchi V, Trüeb RM, Hunziker T, Burger R, et al. Intravenously applied IgG stim-ulates complement attenuation in a complement-dependent autoimmune disease at the amplifying C3 convertase level. Blood. 2004; 103:465–472. PMID:14512320
33. Siragam V, Crow AR, Brinc D, Song S, Freedman J, Lazarus AH. Intravenous immunoglobulin amelio-rates ITP via activating Fc gamma receptors on dendritic cells. Nat Med. 2006; 12:688–692. PMID:
16715090
34. Maddur MS, Vani J, Hegde P, Lacroix-Desmazes S, Kaveri SV, Bayry J. Inhibition of differentiation, am-plification, and function of human TH17 cells by intravenous immunoglobulin. J Allergy Clin Immunol. 2011; 127:823–830. doi:10.1016/j.jaci.2010.12.1102PMID:21281961
35. Séïté JF, Goutsmedt C, Youinou P, Pers JO, Hillion S. Intravenous immunoglobulin induces a function-al silencing program similar to anergy in human B cells. J Allergy Clin Immunol. 2014; 133:181–188. doi:10.1016/j.jaci.2013.08.042PMID:24139609
36. Maddur MS, Hegde P, Sharma M, Kaveri SV, Bayry J. B cells are resistant to immunomodulation by 'IVIg-educated' dendritic cells. Autoimmun Rev. 2011; 11:154–156. doi:10.1016/j.autrev.2011.08.004
PMID:21864723
37. Toltl LJ, Nazi I, Jafari R, Arnold DM. Piecing together the humoral and cellular mechanisms of immune thrombocytopenia. Semin Thromb Hemost. 2011; 37:631–639. doi:10.1055/s-0031-1291373PMID:
22102266
38. Semple JW. T cell and cytokine abnormalities in patients with autoimmune thrombocytopenic purpura. Transfus Apher Sci. 2003; 28:237–242. PMID:12725949
39. Maddur MS, Sharma M, Hegde P, Lacroix-Desmazes S, Kaveri SV, Bayry J. Inhibitory effect of IVIG on IL-17 production by Th17 cells is independent of anti-IL-17 antibodies in the immunoglobulin prepara-tions. J Clin Immunol. 2013; 33:S62–66. doi:10.1007/s10875-012-9752-6PMID:22864643
40. Maddur MS, Kaveri SV, Bayry J. Comparison of different IVIg preparations on IL-17 production by human Th17 cells. Autoimmun Rev. 2011; 10:809–810. doi:10.1016/j.autrev.2011.02.007PMID:
21376142
41. Bayry J, Mouthon L, Kaveri SV. Intravenous immunoglobulin expands regulatory T cells in autoimmune rheumatic disease. J Rheumatol. 2012; 39:450–451. doi:10.3899/jrheum.111123PMID:22298280
42. Maddur MS, Trinath J, Rabin M, Bolgert F, Guy M, Vallat JM, et al. Intravenous immunoglobulin-mediat-ed expansion of regulatory T cells in autoimmune patients is associatimmunoglobulin-mediat-ed with increasimmunoglobulin-mediat-ed prostaglandin E2 levels in the circulation. Cell Mol Immunol. 2014 [Epub ahead of print].
43. Trinath J, Hegde P, Sharma M, Maddur MS, Rabin M, Vallat JM, et al. Intravenous immunoglobulin ex-pands regulatory T cells via induction of cyclooxygenase-2-dependent prostaglandin E2 in human den-dritic cells. Blood. 2013; 122:1419–1427. doi:10.1182/blood-2012-11-468264PMID:23847198
44. Johansson U, Macey MG, Kenny D, Provan D, Newland AC. Alpha galactosylceramide driven expan-sion of human natural killer T cells is inhibited by prednisolone treatment. Br J Haematol. 2004; 125:400–404. PMID:15086423
45. Jacobi C, Claus M, Wildemann B, Wingert S, Korporal M, Römisch J, et al. Exposure of NK cells to in-travenous immunoglobulin induces IFN gamma release and degranulation but inhibits their cytotoxic activity. Clin Immunol. 2009; 133:393–401. doi:10.1016/j.clim.2009.09.006PMID:19828380
46. Semple JW, Freedman J. Natural killer cell numbers and activity in patients with chronic autoimmune thrombocytopenic purpura. Blood. 1994; 83:870–871. PMID:8298145
47. López-Karpovitch X, Graue G, Crespo-Solís E, Piedras J. Multidrug resistance-1 in T lymphocytes and natural killer cells of adults with idiopathic thrombocytopenic purpura: effect of prednisone treatment. Arch Med Res. 2008; 39:541–545. doi:10.1016/j.arcmed.2008.04.004PMID:18514101
48. Anthony RM, Kobayashi T, Wermeling F, Ravetch JV. Intravenous gammaglobulin suppresses inflam-mation through a novel T(H)2 pathway. Nature. 2011; 475:110–113. doi:10.1038/nature10134PMID:
21685887
49. von Gunten S, Shoenfeld Y, Blank M, Branch DR, Vassilev T, Käsermann F, et al. IVIG pluripotency and the concept of Fc-sialylation: challenges to the scientist. Nat Rev Immunol. 2014; 14:349. doi:10. 1038/nri3401-c1PMID:24762829
50. Schwab I, Biburger M, Krönke G, Schett G, Nimmerjahn F. IVIg-mediated amelioration of ITP in mice is dependent on sialic acid and SIGNR1. Eur J Immunol. 2012; 42:826–830. doi:10.1002/eji.201142260
PMID:22278120
51. Leontyev D, Katsman Y, Ma XZ, Miescher S, Käsermann F, Branch DR. Sialylation-independent mech-anism involved in the amelioration of murine immune thrombocytopenia using intravenous gammaglo-bulin. Transfusion. 2012; 52:1799–1805. doi:10.1111/j.1537-2995.2011.03517.xPMID:22257295
52. Guhr T, Bloem J, Derksen NI, Wuhrer M, Koenderman AH, Aalberse RC, et al. Enrichment of sialylated IgG by lectin fractionation does not enhance the efficacy of immunoglobulin G in a murine model of im-mune thrombocytopenia. PLoS One. 2011; 6:e21246. doi:10.1371/journal.pone.0021246PMID:
53. Bennett D, Hodgson ME, Shukla A, Logie JW. Prevalence of diagnosed adult immune thrombocytope-nia in the United Kingdom. Adv Ther. 2011; 28:1096–1104. doi:10.1007/s12325-011-0084-3PMID:
22139790
54. Portielje JE, Westendorp RG, Kluin-Nelemans HC, Brand A. Morbidity and mortality in adults with idio-pathic thrombocytopenic purpura. Blood. 2001; 97:2549–2554. PMID:11313240
55. Cortelazzo S, Finazzi G, Buelli M, Molteni A, Viero P, Barbui T. High risk of severe bleeding in aged pa-tients with chronic idiopathic thrombocytopenic purpura. Blood. 1991; 77:31–33. PMID:1984800
56. FeudjoTepie MA, Le Roux G, Beach KJ, Bennett D, Robinson NJ. Comorbidities of idiopathic thrombo-cytopenic purpura: a population-based study. Adv Hematol. 2009; 2009:963506. doi:10.1155/2009/ 963506PMID:19960044
57. Pamuk GE, Pamuk ON, Başlar Z, Ongören S, Soysal T, Ferhanoğlu B, et al. Overview of 321 patients with idiopathic thrombocytopenic purpura. Retrospective analysis of the clinical features and response to therapy. Ann Hematol. 2002; 81:436–440. PMID:12224000
58. George JN, el-Harake MA, Raskob GE. Chronic idiopathic thrombocytopenic purpura. New Engl J Med. 1994; 331:1207–1211. PMID:7935660