Printed version ISSN 0001-3765 / Online version ISSN 1678-2690 http://dx.doi.org/10.1590/0001-3765201820170737
www.scielo.br/aabc | www.fb.com/aabcjournal
Monitoring vegetation coverage in Tongren from 2000 to
2016 based on Landsat7 ETM+ and Landsat8
HUAIPENG LIU, YONGXIN ZHANG and XIAOPING ZHANG
College of Land and Tourism, Luoyang Normal University, 6, Jiqing Road, Yibin District, Luoyang 471934, Henan Province, China
Manuscript received on September 19, 2017; accepted for publication on February 19, 2018
ABSTRACT
Vegetation coverage is an important indicator in regional ecological environment monitoring and plays a key role in its quality assessment. We consider Landsat7 ETM+ in 2000 and Landsat8 in 2016 as data sources using a different time phase partial image substitution method to eliminate cloud effects and an NDVI dimidiate pixel model to invert the vegetation coverage of the two time phases. We further classify them into five grades, provide statistics and analyse the areas of different grades at different time periods, while monitoring the spatial evolution of vegetation coverage over the past 16 years in Tongren. Experimental results showed that: (1) the different time phase partial image substitution method could reduce the influence of clouds on vegetation extraction; (2) in Tongren, the vegetation coverage area was decreased from 17,300.1 km2
to 17,224.8 km2
(i.e. decreased by 75.3 km2); (3) the areas of grade I and
V increased by 0.42% and 15.08%, respectively, whereas the areas of grade II, III and IV decreased by 3.15%, 6.98% and 5.37%, respectively, which indicates that most of the area containing lower amount of vegetation gradually altered into an area containing a higher coverage of vegetation, whereas a few areas became bare land; and (4) the vegetation areas decreased due to expansion of cities and construction of dams, while vegetation increased due to the cultivation of crops and trees. Research shows that the overall evolution of vegetation coverage in Tongren is considerably good. However, while undertaking future development in the mountainous Karst region, one should be aware of the land’s intensive use and environmental protection.
Key words: China Tongren, Landsat7 ETM+, Landsat8, vegetation coverage, change detection.
Correspondence to: Huaipeng Liu
E-mail:1476829808@qq.com / gatestudy@163.com
INTRODUCTION
Vegetation is an important component of the ecological environment and directly reflects the status of the environment (Liu et al. 2009). Vegetation coverage is
an important ecological parameter for the growth of plants; it plays a key role in assessing and detecting
al. 2010), supervised classification method and so on (Yao et al. 2016). Among them, the normalized difference vegetation index (NDVI) of the dimidiate pixel model is extensively used in the extraction of regional vegetation coverage information because of its simple operation, fast calculation speed and high accuracy of extraction results (Liu et al. 2007, 2012, Li et al. 2012, Ma et al. 2012, Qiao et al. 2013).
Tongren is a large area where forests are widely distributed and the vegetation is very dense, which provide good natural and ecological advantages. In the context of economic development, with an increase in grazing, agricultural planting, resource exploitation and urban expansion, growth of regional vegetation will be greatly affected; ecological problems, such as vegetation destruction, land rocky desertification and soil erosion have appeared in the area (Zheng 2002, Huang 2010), resulting in a decreased fraction of vegetation coverage. To determine the alterations in vegetation coverage in the Tongren prefecture over the previous 16 years, the development of remote sensing monitoring to detect the ecological environmental changes in this area has been effectively promoted. In this study, we extracted vegetation coverage information using the dimidiate pixel model of NDVI to provide comparisons and analysis of changes in vegetation coverage over time, thus providing basic data for the protection and construction of the ecological environment in the Tongren prefecture.
GENERAL SITUATION OF THE STUDY AREA
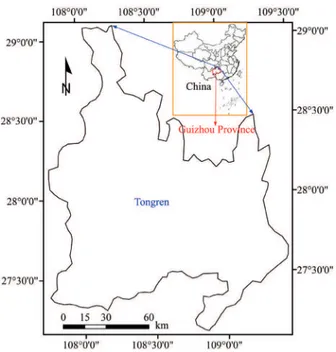
Tongren is located in the northeast of Guizhou province in China (Figure 1), belonging to the bordered areas of the three provinces of Guizhou, Hunan and Chongqing in the Wuling mountainous hinterland. It is the slope zone of the Yunnan and Guizhou Plateau to the Xiangxi hills, with a land area of 18,000 km2. The city’s administrative area is a subtropical monsoon and humid climate zone, with an annual sunshine of 1,044.7–1,266.2
h, annual average temperature of 13.5–17.6 ℃, average annual precipitation of 1110–1410 mm, frost-free periods lasting from 275 to 317 days, with abundant heat, light and precipitation. There are two national nature reserves, three national scenic areas, three provincial scenic spots, one national mine park (Karst) and one national geological park. The Fanjing Mountain is an area under Tongren’s jurisdiction and is also a member of the United Nations Human and Biosphere Reserve Network. It is also a national nature reserve and a famous Buddhist mountain in China, with a regional forest coverage rate that is greater than 95% and contains negative oxygen ions per cubic centimetre ranging from 6-12 million. Giant salamander,
Davidia involucrata Baill and many other rare
and endangered animals and plants live and thrive here, as it is observed to have high ecological and cultural value among well-known mountains and rivers in China.
DATA AND PRE-PROCESSING
DATA SOURCE
Free research data was downloaded from the website of the US geological survey (USGS), where the recent image is obtained from Landsat8 that was imaged on 29th August 2016. The panchromatic and multispectral image resolutions were 15 and 30 m, respectively, and the track number of the two scenes images were 126/40 and 126/41, respectively. Since they were affected by clouds at the location, it is difficult to find images containing less than 20% of cloud coverage in the Tongren prefecture. We queried earlier dates and found that the Landsat7 ETM+ images (track number is also 126/40 and 126/41) of obtained on 21st May 2000
We want to find a similar period of Landsat8 images over the same region with no cloud coverage. Further, we can use a region of interest tool for ENVI, draw the cloud area and remove them using the recent image, which contained no cloud coverage over the corresponding area.
By searching the USGS website, we found Landsat8 imagery that was imaged on February 12nd, 2017 when the region was not covered by any clouds. So, based on the matching geographical coordinates, we embedded the image of the area into the removed area. The image after eliminating the clouds is as shown in Figure 2c.
From Figure 2b, we found that part of the original image was covered with clouds; thus, ground was not visible. However, in the image with the clouds removed, the ground can be seen clearly. Cloud removal for image processing can increase the visibility of ground that is covered by clouds and can be beneficial for the extraction of vegetation information.
CREATING THE DIMIDIATE PIXEL MODEL
In this study, the dimidiate pixel model was built using NDVI, and the calculation method of NDVI is shown in equation (1). The NDVI reflects the vegetation coverage on the ground, the range of its DN value is [-1, 1], where negative values indicate that the ground is covered with clouds, water, snow, etc. and has a high reflection for visible light; 0 indicates that there is a rocky or bare land, and the pixel value of NIR and RED band is observed to be approximately equal. The positive values indicate that there is vegetation coverage, and the value increases with the increase in coverage (Liu 2015).
R NIR
R NIR NDVI
+ −
= (1)
Some scholars thought that the pixel information in remote sensing images reflects the mixed information of objects, but it is assumed that the image pixel can be divided into vegetation the Tongren prefecture, Guizhou Province and the
administrative boundaries of China.
IMAGE PRE-PROCESSING
Before extracting the vegetation coverage information, the Landsat7 ETM+ and Landsat8 images were synthesised by multispectral bands, respectively. Further, the multispectral and panchromatic images were fused, cutting out the single-scene fused image, and the two scene images of the Landsat7 ETM+ and Landsat8 were in a mosaic together. Finally, a 15-m spatial resolution image data with different times and data sources were obtained, and the captured final image was processed at latitude and longitude ranges of 107°44’15.93”–109°29’33.78” E, and 27°06’27.95”–29°04’4.67” N, respectively.
RESEARCH METHOD
CLOUD REMOVAL
Some clouds were in the upper left corner of the pre-processed Landsat8 image in 2016 (Figure 2a), which may obscure the vegetation, thus influencing information extraction.
and non-vegetation information. Therefore, S is the pixel information observed by the sensor and can be expressed as a green vegetation component
Sveg and a non-vegetation component Ssoil. Then, the mathematical model of vegetation coverage can be expressed by the dimidiate pixel model as follows (Li et al. 2004, Guli et al. 2009):
(
S
S
soil)
(
S
vegS
soil)
fc
=
−
/
−
, (2)where fc is the vegetation coverage of this pixel, Sveg
assumes the amount of remote sensing information derived from all vegetation coverage and Ssoil is the amount of remote sensing information that is assumed to be entirely contributed by the soil.
NDVI can reflect the vegetation coverage well, and we can obtain the vegetation coverage by substituting NDVI into equation (2) in the following manner:
NDVIs NDVIv
NDVIs fc
− − = NDVI
, (3)
where NDVIs represents the NDVI values of the non-vegetated bare land pixels; and NDVIv
represents the NDVI values of all vegetation coverage.
Theoretically, the value of NDVIs is close to 0, and the value of NDVIv is close to 1, since NDVIs
is the minimum value of NDVI, which is expressed
as NDVImin; NDVIv takes the maximum value
of NDVI, which is expressed as NDVImax. Since the remote sensing images inevitably suffer from noise, the minimum and maximum values of NDVI correspond to the confidence range that should be selected in accordance with the actual situation of the image. In this study, the NDVI values of cumulative probabilities of 5% and 95% were used as NDVImin and NDVImax for the calculation of vegetation coverage, respectively.
Since the resolution of fused Landsat images is observed to be 15 m, a single misclassification pixel will produce an error of 0.225 km2
. Therefore, we Figure 2 - The results of the region and removal of clouds in 2016, clouds location (a), images
decided that the final results should be expressed in a single decimal case.
CLASSIFICATION OF THE VEGETATION COVERAGE GRADES
Referring to the ‘soil erosion classification and classification standard SL190-2007’ promulgated by the Ministry of Water Resources in China and the ‘Fourth National desertification and desertification monitoring technical regulations’ promulgated by the State Forestry Administration in China, the vegetation coverage in the study area was divided into five grades: Grade I (fc ≤ 0) for non-vegetation
areas (bare land); grade II (0% < fc ≤ 10%) for
very low vegetation coverage areas; grade III (10% < fc ≤ 25%) for low vegetation coverage areas;
grade Ⅳ (25% < fc ≤ 40%) for middle vegetation
coverage areas and grade V (fc > 40%) representing the highest vegetation coverage area (Wang et al. 2016). The major technical steps were: first, to extract the vegetation coverage image fc; second,
to use density slicing to set the density range and third, to classify the fc images.
CHANGE DETECTION
Using the change detection module of ENVI4.5 software, the grading fc maps in 2000 and 2016 were used to detect change using the final classification map minus the previous classification map to output the changes in the form of pictures and confusion matrices. After observation and data statistics, analysis the changes.
RESULT ANALYSIS
VEGETATION COVERAGE INFORMATION ANALYSIS
Using the NDVI pixel dimidiate pixel model, the vegetation grade distribution maps of 2000 and 2016 are shown in Figure 3a and b, while the vegetation coverage statistics are shown in Table Ⅰ.
From Figure 3, we observe that the surface of the Tongren prefecture is mainly covered with green vegetation, whereas a few areas do not contain vegetation coverage and are mainly used for urban and other construction sites (white patches in the pictures). In 2000, the vegetation coverage was lower; however, it was still more than that in 2016. In 2016, the amount of areas where there was no coverage of vegetation (i.e. exposed plots) was significantly higher than that observed in 2000. It is observed that during the period of great economic development, the Tongren prefecture was seriously disturbed by human interference.
From Table Ⅰ, the total area of the Tongren prefecture is 18,102.5 km2. In 2000, the area covered by grade I was 802.5 km2, accounting for 4.43% of the total area. It showed that the proportion of bare land was less in the study area. Furthermore, the area of grade II was 903.2 km2,
accounting for 4.99% of the total area; the area of grade III was 2,197.1 km2, accounting for 12.14% of the total area; the area of grade IV was 2,820.1 km2, accounting for 15.58% of the total area and the area of grade V was 11,379.6 km2, accounting for 62.86% of the total area. The areas of grades II–V accounted for 95.57% of the total area. The higher coverage level is found in a greater proportion of the land area, which showed that vegetation coverage was very high in the study area.
In 2000 and 2016, the Tongren prefecture was dominated by high coverage of vegetation with a lower proportion of medium and low coverage vegetation. The proportion of bare land was below 5%. From 2000 to 2016, the area of grades I, II, III, IV and V changed to 75.3, -570.5, -1,263.3, -971.7 and 2,730.3 km2, respectively. The areas
of grades I and V increased, while that of others reduced, indicating that a portion of vegetation was destroyed, and this area turned into a non-vegetated area. However, most of the vegetation coverage areas changed into higher coverage areas, illustrating that the unspoilt vegetation coverage area evolved well.
VEGETATION COVERAGE CHANGE ANALYSIS
Detection of changes in the two vegetation coverage maps from 2000 to 2016 and the statistics of the test results are shown in Table Ⅱ.
From the vegetation coverage grade transition probability matrix (Table Ⅱ) obtained from 2000 to 2016, the coverage for grade I was transferred to the coverage for grades II, III, IV and V; however, the proportion of the class that was transferred to grade V is larger (48.83%) than the others. It showed that a large amount of bare land was transformed into a vegetation-covered area, which may be caused by different image time phase because crops such as rape were harvested and bare land appeared in the fields in May; however, in August, bare farmland was covered by other new crops. Hence, the
TABLE Ⅰ
Vegetation coverage statistics for 2000 and 2016.
Coverage level
2000 2016
Area changes (km2) Area (km2
) Percentage of total
area (%) Area (km
2
) Percentage of total area (%)
Grade I 802.5 4.43 877.7 4.85 75.3
Grade Ⅱ 903.2 4.99 332.7 1.84 -570.5
Grade Ⅲ 2197.1 12.14 933.8 5.16 -1263.3
Grade Ⅳ 2820.1 15.58 1848.4 10.21 -971.7
Grade Ⅴ 11379.6 62.86 14109.9 77.94 2730.3
transformation between bare land and vegetation areas was observed to be severe; classes II, III and IV also was observed to mainly change to class V with conversion rates of 63.46%, 67.03% and 71.00%, respectively. It showed that the vegetation coverage changed from low grades to a higher grade; grade V remained unchanged at 84.90%, while the rest were translated into lower classes of varying degrees, but smaller proportions.
LAND TYPE CHANGE ANALYSIS
New additional non-vegetation
The resulting new additional non-vegetation coverage areas are shown in Figure 4 (The blue purple dots formed area in the picture).
From Figure 4, 10 regions were changed more clearly in the newly added non-vegetation areas (blocks numbered 1-10). The ten blocks of remote sensing images in 2000 and 2016 were observed and analysed using Google Earth. Further, we observed that the change to regions 1, 2, 4, 5, 7, 8, 9 and 10 was caused due to urban expansion of the Dejiang, Sinan, Shiqian, Yanhe, Jiangkou, Yuping, Songtao counties along with the city of Tongren. The reason for the changes in region 3 was because of the construction of a dam, which caused the water surface to rise, and the water area increased. The reason for changes to region 6 was due to the expansion of villages.
In the remote sensing images of 2000 and 2016, blocks 1-10 were partially cropped and the results are shown in the right side of Figure 4.
In addition, other reasons for the growth of non-vegetated areas are the construction of roads, shelters and mining and the development of farms.
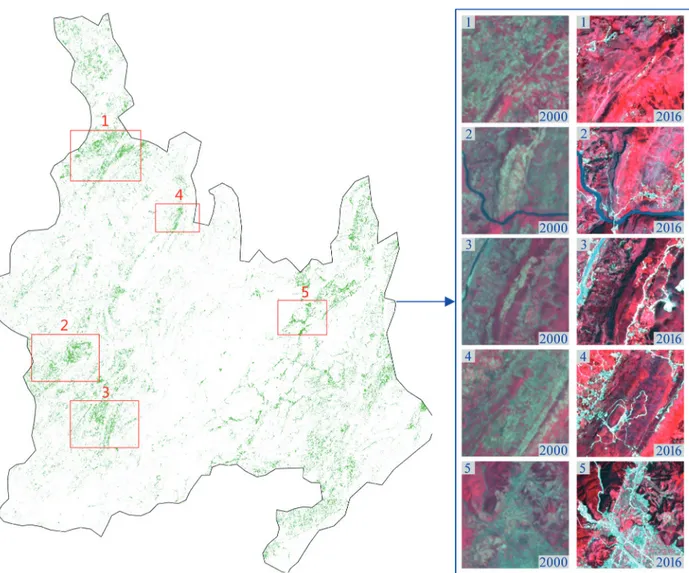
New additional vegetation
From 2000 to 2016, a newly added vegetation coverage map was developed, which is shown in Figure 5 (the green dots are the formed area in the picture).
From Figure 5, we observe that there are five regions that were changed more clearly in the newly added vegetation areas (blocks numbered 1–5). In the remote sensing images of 2000 and 2016, blocks 1–5 were cropped partially, and the results are shown in the right side of Figure 5.
Blocks 1–5 of the remote sensing images in 2000 and 2016 were observed and analysed using Google Earth. From Figure 5, a part of the regions 1, 2, 3, 4 and 5 in May 2000 were observed to be mainly farmland, when crops such as rape were harvested and bare land appeared in the fields. However, in August 2016, regions 1, 2, 3 and 4 were covered by other new crops, whereas part of region 4 was planted with trees, which was bare land in 2000. Further, it was covered by vegetation in 2016; thus, the reasons for changes in these regions are agriculture and the plantation of trees.
TABLE Ⅱ
Grade transfer matrix of vegetation coverage from 2000 to 2016 (%). 2000
2016
Grade Ⅰ Grade Ⅱ Grade Ⅲ Grade Ⅳ Grade Ⅴ
Grade Ⅰ 28.46 11.63 8.39 5.77 1.75
Grade Ⅱ 3.40 3.29 3.11 2.74 1.19
Grade Ⅲ 7.31 7.91 7.87 7.26 3.77
Grade Ⅳ 12.00 13.73 13.61 13.23 8.43
Grade Ⅴ 48.83 63.46 67.03 71.00 84.90
Class changes 71.54 96.71 92.13 86.77 15.10
Figure 4 - New additional non-vegetation areas and the part of contrast images of typical regions that was changed from 1 to 10 in 2000 and 2016, respectively.
DISCUSSION AND CONCLUSION
Based on the pixel dimidiate pixel model of the NDVI, vegetation coverage information was extracted from a Landsat7 ETM+ image in 2000 and a Landsat8 image in 2016. Further, we used classification and change detection to analyse the information about the vegetation coverage in the Tongren prefecture. Experimental results showed that the vegetation coverage rate decreased from 95.57% in 2000 to 95.15% in 2016, a decrease of 75.3 km2, accounting for 0.42% of the total area. The main reason for this decrease was due to urban expansion and the construction of dams. The high-level vegetation coverage area increased from 62.86% in 2000 to 77.94% in 2016, which signified an increase of 15.08%. The results showed that the vegetation of the Tongren prefecture was affected by city expansion, construction of dams and other such factors, whereas the vegetation coverage rate experienced a slight
decrease. However, the vegetation coverage changed from low to higher grades, and the overall evolution was observed to be better.
The Tongren prefecture is a mountainous Karst area, where there is beautiful scenery. However, the environment is prone to ecological problems. Hence, in the context of economic development, one should be cognizant of the land’s intensive use and the need to protect the environment.
In this study, we adopted Landsat7 ETM+ imagery that was taken on 21st May 2000 and Landsat8 imagery that was imaged on 29th August
Figure 5 - New additional vegetation area and the part of contrast images of typical regions that was changed from 1 to 10 in 2000 and 2016, respectively.
ACKNOWLEDGMENTS
This work was supported by the National Nature Science Foundation of China (Grant Nos. 61502219, 41501466) and the International Science & Technology Cooperation Program of China (Grant No. 2016YFE0104600). We want to provide our gratitude to the editors and the anonymous reviewers.
REFERENCES
CUI TX, GONG ZN, ZHAO WJ, ZHAO YL AND LIN C. 2013. Research on estimating wetland vegetation abundance based on spectral mixture analysis with
different endmember model: a case study in Wild Duck Lake wetland, Beijing. Acta Ecol Sin 33(4): 1160-1171. CUI YP, WANG RH, LIU T AND ZHANG HZ. 2010.
Extraction of vegetation information in arid desert area based on spectral mixture analysis - a case in the western Gurbantunggut desert. J DesertRes 30(2): 334-341. GULI JP, CHEN X AND BAO AM. 2009. Coverage extraction
and up-scaling of sparse desert vegetation in arid area. Chin J Appl Ecol 20(12): 2925-2934.
HUANG Q. 2010. Causes of rock desertification and key issues of rehabilitation in karst area of southwest China. Pratacultural Sci 27(8): 5-9.
LI MM, WU BF, YAN CZ AND ZHOU WF. 2004. Estimation of vegetation fraction in the upper basin of miyun reservoir by remote sensing. Resour Sci 26(4): 153-159.
LIU GF, WU B, FAN WY, LI XS AND FAN NN. 2007. Extraction of vegetation coverage in desertification regions based on the dimidiate pixel model-case study in maowusu sandland. Res Soil Water Conserv 14(2): 268-271. LIU HP, AN HJ, WANG B AND ZHANG QL. 2015. Tree
species classification using worldview-2 images based on recursive texture feature elimination. J Beijing For Univ 37(8): 53-59.
LIU W, LUO JC, SHEN ZF, ZHONG QH, GAO LJ, ZHOU G AND FEI HT. 2009. Research of multi-scale iterative vegetation extraction model. Appl Res Comput 26(6): 2398-2400.
LIU YA, HUANG B, CHENG T AND QU LA. 2012. Vegetation coverage in upper huaihe river basin based on binary pixel model of remote sensing. Bull Soil Water Conserv 32(1): 93-97.
MA N, HU YF, ZHUANG DF AND ZHANG XL. 2012. Vegetation coverage distribution and its changes in plan blue banner based on remote sensing data and dimidiate pixel model. Sci Geog Sin 2: 251-256.
QIAO T, ZHANG HQ, CHEN YF AND LING CX. 2013. Extraction of vegetation information based on NDVI segmentation and object-oriented method. J Northwest For Univ 28(4): 170-175.
WANG XJ, ZHAO CY, YANG RH AND JIA HT. 2016. Dynamic characteristics of sandy vegetation landscape pattern based on dimidiate pixel model. Trans Chin Soc Agric Eng 32(3): 285-294.
YAO FF, LUO JC, SHEN ZF, DONG D AND YANG KH. 2016. Automatic urban vegetation extraction method using high resolution imagery. J Geo Inf Sci 18(2): 248-254. ZHENG YC AND WANG SJ. 2002. Geological cause of