Anomalous Gray Matter Structural Networks
in Patients with Hepatitis B Virus-Related
Cirrhosis without Overt Hepatic
Encephalopathy
Xiao-Fei Lv1☯, Kai Liu2☯, Ying-Wei Qiu3,4, Pei-Qiang Cai1, Jing Li1, Gui-Hua Jiang4, Yan-Jia Deng2, Xue-Lin Zhang2, Pei-Hong Wu1, Chuan-Miao Xie1*, Ge Wen2*
1Imaging and Interventional Radiology, Sun Yat-sen University Cancer Center; State Key Laboratory of Oncology in South China; Collaborative Innovation Center for Cancer Medicine, Guangzhou, People's Republic of China,2Medical Imaging Centre, Nanfang Hospital, Southern Medial University, Guangzhou, People’s Republic of China,3Department of medical imaging, The First Affiliated Hospital of Gannan Medical University, Ganzhou, People's Republic of China,4Department of Medical Imaging, Guangdong No. 2 Provincial People’s Hospital, Guangzhou, People's Republic of China
☯These authors contributed equally to this work.
*xiecm_image@163.com(CMX); wenge67@aliyun.com(GW)
Abstract
Background and Purpose
Increasing evidence suggests that cirrhosis may affect the connectivity among different brain regions in patients before overt hepatic encephalopathy (OHE) occurs. However, there has been no study investigating the structural reorganization of these altered connec-tions at the network level. The primary focus of this study was to investigate the abnormal topological organization of the structural network in patients with hepatitis B virus-related cirrhosis (HBV-RC) without OHE using structural MRI.
Methods
Using graph theoretical analysis, we compared the global and regional topological proper-ties of gray matter structural networks between 28 patients with HBV-RC without OHE and 30 age-, sex- and education-matched healthy controls. The structural correlation networks were constructed for the two groups based on measures of gray matter volume.
Results
The brain network of the HBV-RC group exhibited a significant decrease in the clustering coefficient and reduced small-worldness at the global level across a range of network densi-ties. Regionally, brain areas with altered nodal degree/betweenness centrality were ob-served predominantly in association cortices (frontal and temporal regions) (p<0.05, uncorrected), including a significantly decreased nodal degree in the inferior temporal gyrus (p<0.001, uncorrected). Furthermore, the HBV-RC group exhibited a loss of association
OPEN ACCESS
Citation:Lv X-F, Liu K, Qiu Y-W, Cai P-Q, Li J, Jiang G-H, et al. (2015) Anomalous Gray Matter Structural Networks in Patients with Hepatitis B Virus-Related Cirrhosis without Overt Hepatic Encephalopathy. PLoS ONE 10(3): e0119339. doi:10.1371/journal. pone.0119339
Academic Editor:Satoru Hayasaka, Wake Forest
School of Medicine, UNITED STATES
Received:August 3, 2014
Accepted:January 13, 2015
Published:March 18, 2015
Copyright:© 2015 Lv et al. This is an open access
article distributed under the terms of theCreative Commons Attribution License, which permits unrestricted use, distribution, and reproduction in any medium, provided the original author and source are credited.
Data Availability Statement:All relevant data are
within the paper and its Supporting Information files.
Funding:This work was supported by the grants
hubs and the emergence of an increased number of non-association hubs compared with the healthy controls.
Conclusion
The results of this large-scale gray matter structural network study suggest reduced topo-logical organization efficiency in patients with HBV-RC without OHE. Our findings provide new insight concerning the mechanisms of neurobiological reorganization in the HBV-RC brain from a network perspective.
Introduction
An estimated 350 million people suffer from chronic hepatitis B viral infection worldwide, and more than 75% of these chronically infected people live in Asia [1]. Annually, approximately 1.0–2.4% of these patients progress to hepatitis B virus-related cirrhosis (HBV-RC) [1]. Hepatic encephalopathy (HE) is one of the most common complications of end-stage cirrhosis [1]. This condition is characterized by a wide range of neuropsychiatric abnormalities that can lead to coma and death [2]. Clinically, overt hepatic encephalopathy (OHE) can be readily identified based on the presence of neurological manifestations that are obvious upon clinical examina-tion [3]. However, cirrhotic patients commonly present with a spectrum of neuropsychological symptoms, even without any clinical symptoms of OHE. Neuropsychological and neurophysi-ological testing have revealed various degrees of cognitive deficits [4,5] in cirrhotic patients be-fore OHE occurs, which may lead to a poorer quality of life, deterioration in daily functioning, and even increased morbidity [3].
Over the past decade, various neuroimaging studies [6–13] have been proposed to explore the pathophysiological mechanisms of the cognitive abnormalities observed in cirrhotic pa-tients without OHE. Previous studies from our lab and others [6–8,13] have used resting-state functional MRI to identify cirrhosis-related abnormalities not only in localized brain regions but also in the functional connections among a series of brain areas. Even the functional inte-gration of some specific sub-networks (such as the dorsal attention network, the default net-work, the auditory network and the visual network) [9,13] and the whole-brain network [8,10] has been implicated. Thus, a wide range of cirrhosis-related cognitive deficits may arise from disturbed connectivity among a series of brain regions rather than segregated regional brain abnormalities.
Additionally, neuroanatomical studies, such as MRI-based brain structure analyses, have also been used to investigate the etiopathogenesis of impaired cognition in cirrhotic patients [11–17]. Voxel-based morphometry (VBM) [11,14–17] and cortical thickness analysis [12] studies have demonstrated that cirrhotic patients without OHE exhibit abnormal volume, den-sity and thickness of the gray matter (GM) in multiple brain regions, which indicates that the brain morphological alterations in those patients are widespread. Moreover, evidence from dif-fusion tensor imaging [13] has exposed disturbed structural connectivity within the default-mode network. These findings may lead investigators to posit that cirrhotic patients without OHE suffer alterations in the large-scale structural brain network.
Recent graph theoretical analyses offer a unique framework in which to quantify the topo-logical and organizational properties of brain networks. Coordinated variations in brain mor-phology have been proposed as a valid measure to infer large-scale structural brain networks [18]. The structural networks constructed using morphometric correlations of GM volume or
Competing Interests:The authors have declared
cortical thickness are consistent with those constructed from tract-tracing data and reflect the precise coordination of cortical morphology in the brain [18–21]. The small-world network, which is characterized by a high degree of clustering and short path lengths between individual network nodes, is a useful model for the description of complex brain networks [22]. Graph theoretical analyses have consistently demonstrated that brain structural networks in healthy individuals exhibit and allow for more efficient information processing than random networks [18,20,23]. To date, graph theoretical studies have revealed alterations of arrangements in structural correlation networks that are associated with normal aging [20], Alzheimer's disease [24], schizophrenia [21] and major depressive disorder [25]. Thus, changes identified in the structural network of the cirrhotic brain may enrich our understanding of the neuropathologi-cal mechanisms of this disease. So far, however, no such study has been published.
In the present study, we applied graph theoretical analysis to compare MRI-based GM vol-ume correlation networks between healthy controls and cirrhotic patients. We specifically fo-cused on investigating the changes in the brains of cirrhotic patients at the stage prior to OHE. Moreover, the cirrhotic patients included in this study were all HBV-RC subjects. This cirrho-sis model should help to rule out the effects of certain confounding factors that can disrupt the central nervous system (e.g., alcohol and medications), which are common and significant in other types of cirrhosis models [26]. Given the previous evidence of a diffuse distribution pat-tern of GM structural abnormalities in cirrhotic patients, combined with recent findings of re-ductions in small-world characteristics and increased disorganization of functional networks in cirrhotic individuals [10], we hypothesized that topological alterations could be reflected in the brain structural correlation network. We also examined the between-group differences in regional network measures (betweenness centrality degreeand the distribution of hubs) to fur-ther highlight the most closely disease-related brain regions.
Materials and Methods
Subjects
The study was approved by the Research Ethics Review Board of Nanfang Hospital, Southern Medical University. Written informed consent was obtained from all participants before the study. Twenty-eight patients with HBV-RC without OHE (mean age: 45.75 ± 10.47 years, age range: 27–67; 25 males) and thirty normal controls (mean age: 44.37 ± 7.85 years, age range: 30–61; 23 males) matched for age, gender, and education were included.
In this study, we performed detailed and systematic examinations of each subject to estab-lish a diagnosis of HBV-RC without OHE. In brief, HBV-RC was diagnosed through biopsy or on the basis of case history, clinical examination, and biochemical and imaging findings. Each patient’s liver functional status was assessed using the Child–Pugh score.
Patients were excluded for other types of viral hepatitis, OHE, gastrointestinal hemorrhage or bacterial infection (within 1 month before the study), a transjugular intrahepatic portosyste-mic or surgical portocaval shunt, and diffuse hepatocellular carcinoma. The exclusion criteria for all patients and controls also included age<18 or>70 years, alcoholism, neurological or psychiatric diseases, a history of substantial head trauma, infection with human immunodefi-ciency virus, diabetes, hypertension, poor vision, other major medical illness, left-handedness, and any focal abnormality detected upon routine brain MRI examination.
Neuropsychological Tests
The psychometric hepatic encephalopathy score (PHES) battery, which assesses multiple cogni-tive domains in patients with cirrhosis, including visual perception, construction, visual/spatial orientation, motor speed and accuracy, concentration, and attention [27], was administered to all 58 subjects to assess their cognitive function. In the present study, a previously reported version of the PHES battery was applied. The assessment comprised five paper-and-pencil psychometric tests, including the number connection test A (NCT-A, in seconds), the modified number con-nection test B (NCT-B, in seconds), the digit symbol test (DST, in numbers), the serial dotting test (SDT, in seconds) and the line-tracing test (LTT, the sum of time taken in seconds and the number of errors). All subjects completed the test battery after an appropriate explanation and demonstration. The method for calculating PHES values has been reported in detail elsewhere [6]. In brief, five formulae constructed using data from 133 healthy subjects in a previous study [6] were used to predict the expected results of the five neuropsychological tests. A recorded re-sult of1 standard deviation (SD) above the predicted value was scored as +1, results of 1 SD and 2 SDs below the predicted value were scored as−1 and−2, respectively, and a result equal to
or below−3 SDs was scored as−3. The final PHES values were calculated as the sum of the scores
from the five tests and ranged between +5 and−15.
MRI Data Acquisition
MR imaging data were acquired for all subjects using a 1.5-T MR scanner (Achieva Nova-Dual, Philips Medical Systems, Best, Netherlands). Each subject lay in the supine position with the head snugly fixed with foam pads and a belt. The routine acquisition of T1-weighted and T2-FLAIR im-ages was performed for each subject to detect clinically silent lesions in the central nervous system. High-resolution three-dimensional T1-weighted (3D-T1) images covering the entire brain were acquired in the sagittal orientation using a fast field echo (FFE) sequence (S1 Data). The imaging parameters were as follows: repetition time = 25 ms, echo time = 4.1 ms, flip angle = 30°, field of view = 230 × 230 mm, matrix = 231 × 231, slice thickness = 1 mm, and number of slices = 160.
Structural Data Preprocessing
All 3D-T1images were processed and examined using SPM8 software (http://www.fil.ion.ucl. ac.uk/spm). VBM was implemented in the VBM8 toolbox (http://dbm.neuro.uni-jena.de/vbm. Table 1. Demographic and clinical characteristics of participants.
Characteristic HBV-RC group (n = 28) CON group (n = 30) p-value
Age (years)* 45.75±10.47 44.37±7.85 0.570
Sex ratio, M/F 25/3 23/7 0.301
Education (years)* 10.32±3.74 11.63±3.03 0.147
Child–Pugh A/B/C 15/8/5 -
-Total serum bilirubin (IU/L)* 88.38±172.47 N/A
-Serum albumin (g/L)* 35.87±6.15 N/A
-Prothrombin time (s)* 16.67±2.77 N/A
-PHES** −2.5(−11*1) 0(−3*3) <0.001
*Indicates means±standard deviations. **Indicates median and range.
Abbreviations:CON = control; HBV-RC = hepatitis B virus-related cirrhosis; N/A = not applicable; PHES = psychometric hepatic encephalopathy score.
html) with default parameters and with the incorporation of the DARTEL toolbox, which was used to obtain a high-dimensional normalization protocol [28]. The images were bias-cor-rected, tissue-classified, and registered using linear (12-parameter affine) and nonlinear trans-formations (warping) within a unified model. Subsequently, the warped GM segments were affine-transformed into Montreal Neurological Institute (MNI) space and were scaled using the Jacobian determinants of the deformations to account for the local compression and stretching that arose as a consequence of the warping and affine transformation (modulated GM volumes,S2 Data). The modulated GM images were further smoothed with an 8-mm full-width at half maximum (FWHM) isotropic Gaussian kernel. Then, the average GM volume of each brain region of interest (ROI) within the entire cerebrum was calculated using the WFU PickAtlas Toolbox implemented in SPM8 (S1 Table). Brain parcellation was performed follow-ing the automated anatomical labelfollow-ing (AAL) algorithm [29] with 90 cortical and subcortical ROIs.
Network Construction
A 90 × 90 association matrixRwas constructed for each group using pair-wise regional correla-tions calculated as the partial correlation coefficients (rij) between the average GM volume
val-ues for a pair of ROIs,“i”and“j”, in each group, with the subjects’total brain volume and age included as covariates of nuisance. Thereafter, the matrixRwas transformed into a binary ma-trixAby thresholding therijinto values of 0 or 1. Here, these thresholds were defined as a
range of network densities (Dmin–Dmax), where Dminrepresents the minimum density above which neither network is fragmented [30]. In this study, we preliminarily calculated the net-work metrics across a density range of 0.1–0.45 (interval of density, 0.01) because structural networks with>45% connectivity are considered to be less biologically meaningful [30]. Ulti-mately, the density region of interest for the global property comparisons was set to 0.20–0.40 because above 0.20, the networks of the HBV and control groups were fully connected (i.e., each node of the network had at least one connection with another node), and above 0.40, the small-worldness of both groups was<1.2 and the networks were increasingly random [30]. For regional property comparisons, we selected a range of 0.20–0.33, throughout which the networks of the two groups were fully connected and exhibited between-group difference in small-worldness. Additionally, when regarding the matrixAas a graphG, we defined the quan-titiesN,K, D,i,j, andkas the total number of ROIs (i.e., 90), the number of edges, the percent-age of surviving edges at a given density threshold, and three randomly chosen nodes,
respectively [31].
Global Network Properties
For our constructed brain structural networks, we adopted a previously established graph theo-retical analysis method to quantify the network properties [18]. This technique was developed based on the quantitative method for small-world architecture proposed by Watts and Strogatz [22]. The two basic measures are the characteristic path lengthLand the clustering coefficient
C. Here, for a given graphGand two random nodesi&j,Lis defined as the average of the shortest path lengths between two generic nodes:
L¼ 1
NðN 1Þ
X i6¼j2GLij
whereLijis the length of the shortest path betweeniandj. Therefore,Lessentially reflects the
The clustering coefficient of a nodei(Ci) measures the number of edges among its nearest
neighbors, andCis correspondingly defined as the average of the local clustering coefficients
Ciof all nodes:
Ci ¼
1
NðNGi 1Þ
X
j;k2NGi1=Ljk;C¼
1
N X
i2GCi
whereGiis a subgraph from the whole network composed of the nearest neighbors of nodei.
Thus,Cis a measure of network segregation reflecting the efficiency of a network in processing information locally. To better summarize the topology of the brain network, we further calcu-lated the normalized path lengthλand the normalized clustering coefficientγby comparing them with the random network [22,23,33]:
l¼L=Lrand;g¼C=Crand
whereLrandandCrandare the means of the characteristic path lengths and the clustering coeffi
-cients, respectively, of 1000 randomly generated networks matched for nodes, edges, and degree distribution.
Finally, based onλandγ, the small-worldness indexσof the brain network was calculated as follows:
s¼g=l
which is a more direct metric for the small-world organization of the brain network.
Regional Network Properties & Hub Identification
In this study, the regional network properties were summarized and quantified using the nor-malized betweenness centralitybiand the normalized degreeki:
bi ¼Bi=B;ki¼Ki=K
whereBirepresents the total number of shortest paths passing through nodei[34],Ki
repre-sents the number of edges between nodeiand other nodes, andBandKrepresent the mean betweenness and degree, respectively, of the entire network. Furthermore,biandkiwere used
to identify the hubs of the network, i.e., nodes with regional values at least 1.5 SDs greater than the mean value were recognized as hubs [35].
Statistical Analysis
Demographic and Cognitive Testing. Two-sample t-tests were performed to assess the differences in age and duration of education between the cirrhotic patients and the healthy sub-jects. Pearson’s chi-squared test was used to compare gender ratios between the two groups. The Mann-Whitney U test was used to analyze the differences in PHES test performance be-tween the two groups. These analyses were performed using commercially available statistical software (SPSS, version 13.0; Chicago, IL, USA), and ap-value of less than 0.05 (two-tailed) was deemed significant.
Between-Group Network Comparisons
compared across a density range of 0.20–0.40. For the regional measuresbiandki, the
be-tween-group differences were compared using an area under the curve (AUC) analysis of the networks over a density range of 0.20–0.33; in this range, the two groups exhibited fully con-nected networks and a significant difference in small-worldness. The statistical threshold was initially set top<0.05 (uncorrected) and further top<0.001 (uncorrected).
Results
Demographic and Cognitive Testing
There were no significant differences in age, sex or education between the cirrhotic patients and the control subjects. Compared with the control subjects, the cirrhotic patients had signifi-cantly lower PHES scores (−2.5 [−11 to 1] vs. 0 [−3 to 3], respectively;p<0.001) (Table 1).
Changes in Global Network Properties
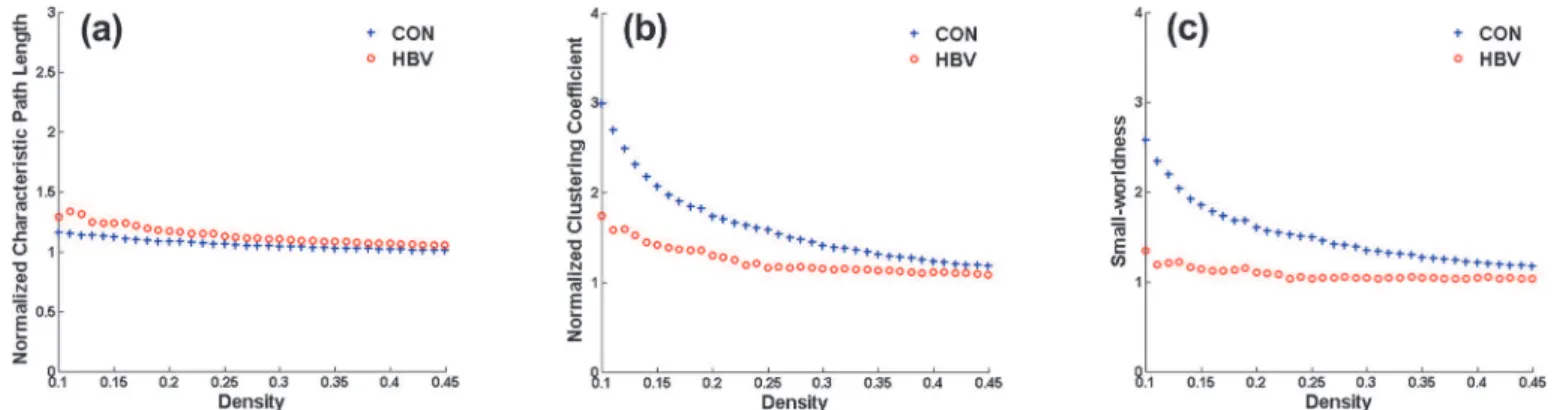
The density range of interest for global properties was ultimately set to 0.20–0.40; in this range, the networks of the HBV group and the control group were not fragmented and were of biolog-ical significance. Throughout this density range, the control group exhibited efficient small-world topology, i.e.,λ1,γ>1, andσ>1.2, whereas the HBV-RC network presented an al-tered topological organization, i.e., a tendency toward increasedλand decreasedγandσ (Fig. 1). Statistically, the small increase inλin the HBV group was non-significant (Fig. 2A), whereasγwas significantly decreased at densities of 0.23–0.33 (Fig. 2B), resulting in signifi-cantly decreasedσbetween 0.20 and 0.33 (Fig. 2C).
Regional Comparison & Hubs
AUC analysis of the regional network properties revealed a series of brain regions with differ-ent metrics (Table 2). Compared with the control group, thebivalues in the patients with
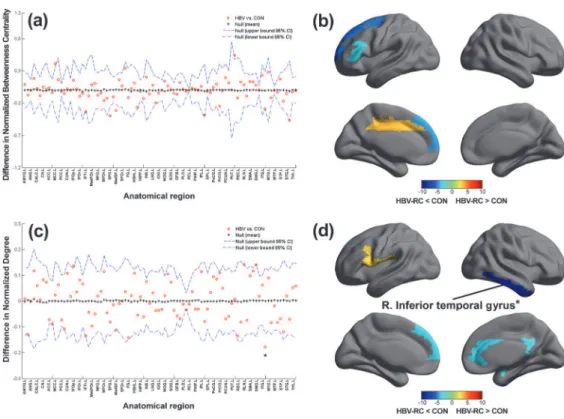
HBV-RC were decreased (p<0.05, uncorrected) in the left inferior frontal gyrus (triangular part), the superior frontal gyrus, and the medial superior frontal gyrus and were increased in the left middle cingulum and the right putamen (Fig. 3A and 3B). A decrease inkiwas observed
in the right amygdala, the anterior cingulum, the postcingulum, the pallidum, the inferior tem-poralgyrus, and the left medial superior frontal gyrus, and this value was increased in the left inferior frontal gyrus (opercular part) and the left rolandic operculum (Fig. 3C and 3D). After the threshold was increased top= 0.001, the right inferior temporal gyrus persisted with a sig-nificantly decreasedki(Fig. 3D). Together, these regions were predominantly distributed
throughout the association cortices (frontal and temporal regions), the paralimbic cortices (cingulum andamygdala), and one subcortical region (pallidum).
The names of the hubs in the networks constructed for the patient (HBV-RC) and control (CON) groups are listed inTable 3andFig. 4. Ten network hubs were identified in the CON group based onkiandbi, located predominantly in the association cortices (8/10), the
paralim-bic cortex (1/10) and the primary cortex (1/10), whereas twelve hubs were detected in the HBV-RC group, located predominantly in the association cortex (6/12), the primary cortex (3/ 12), the paralimbic cortex (2/12) and the subcortical cortex (1/12). Altogether, compared with the CON group, more hub regions were identified in the HBV-RC group, indicating a loss of association hubs and the emergence of an increased number of non-association hubs.
Discussion
the global topological organization of the GM volume networks in cirrhotic patients was dis-rupted, as indicated by altered small-world parameters; (2) brain areas with altered nodal de-gree/betweenness centrality were observed predominantly in association cortices (frontal and temporal regions) in cirrhotic patients; (3) different patterns in hub distribution were observed in the cirrhotic patients versus the controls based on nodal betweenness and nodal degree. Taken together, our findings indicate that the topological organization of the structural net-works constructed based on GM volumes in patients with HBV-RC without OHE is less opti-mal than that of the networks corresponding to healthy controls, indicating a more limited capability to integrate information among the different regions of the brain.
Disrupted Global Topological Organization
In this study, the structural network of the control group was found to exhibit efficient small-world organization, consistent with previous functional and structural studies [18,25,37]. The HBV-RC group network, however, exhibited significantly altered small-world indices (i.e.,
Fig 1. Changes in global network measures as a function of network density.Normalized characteristic path lengths(a), normalized clustering coefficients(b), and small-world indices(c)of the network of the hepatitis B virus-related cirrhosis (HBV-RC) group and the control (CON) group. The network properties are calculated across a density range of 0.10–0.45 (density interval, 0.01).
doi:10.1371/journal.pone.0119339.g001
Fig 2. Between-group differences in global network measures between the hepatitis B virus-related cirrhosis (HBV-RC) group and the control (CON) group as a function of network density.The graph shows that there was no significant difference in the network characteristic path length(a) between the groups, whereas the clustering coefficient(b)was significantly decreased in the HBV-RC network at various densities, resulting in lower small-worldness(c)compared with the CON group across a density range of 0.20–0.40 (between the vertical dotted lines). The vertical arrows represent the densities at which the difference was statistically significant atp<0.05. The line corresponding to thesymbols represents the CON group measure minus the HBV-RC group measure, the line corresponding to the + symbols represents the mean of the random-graph distribution, and the dashed lines indicate the 95% confidence interval.
decreased clustering coefficient and decreased small-worldness) compared with the control group.
The observed decrease in the clustering coefficient, which measures network segregation at the global level, may reflect a relatively sparse local connectedness of the brain structural networks in patients with HBV-RC. These findings are consistent with a number of recent resting-state functional studies [8,10]. Zhang et al. [8] have observed the widespread occur-rence of weaker cortical and subcortical network connectivity in correlationwith neuropsy-chological impairment in cirrhotic patients with minimal HE. Hsu et al. [10] have also observed that global topological efficiencies of the functional connectivity network were sig-nificantly disrupted in cirrhotic patients. Moreover, the results of a network-level analysis corroborate previous structural neuroimaging findings that have demonstrated a widespread pattern of atrophy in GM volumes in cirrhotic patients [11], which may further suggest an al-teration in the coordinated patterns of brain morphology in the structural networks of these patients.
Taken together, our findings suggest that the structural correlation networks of patients with HBV-RC tend to exhibit more randomized configurations compared with those of normal individuals. Given that the small-world model reflects an optimal balance between local spe-cialization and global integration, as described previously [22,23], the decreased clustering co-efficient thus indicates a shift toward random networking caused by decreased local
segregation. Therefore, the altered small-world parameters in structural networks may reflect a less optimal topological organization in patients with HBV-RC without OHE.
Table 2. Comparison of regional network properties between patients and normal controls based on AUC analysis.
Region Class Direction p
Betweenness centrality
L.Frontal_Inf_Tri Association # 0.048
L.Frontal_Sup Association # 0.007
L.Frontal_Sup_Med Association # 0.014
L.Cingulum_Mid Paralimbic " 0.027
R.Putamen Subcortical " 0.033
Degree
R.Amygdala Paralimbic # 0.045
R.Cingulum_Ant Paralimbic # 0.039
R.Cingulum_Post Paralimbic # 0.049
L.Frontal_Sup_Med Association # 0.043
R.Pallidum Subcortical # 0.043
R.Temporal_Inf Association # 0.001*
L.Frontal_Inf_Oper Association " 0.040
L.Rolandic_Oper Association " 0.047
"indicates that the metric was higher in the patients with hepatitis B virus-related cirrhosis;
#indicates that the metric was higher in the controls;
*indicates that the region was statistically significant after the significantp-value was adjusted to 0.001. The regions were classified as primary, association, and paralimbic as described by Mesulam (1998).
Abbreviations: L = left; R = right; Sup = superior; Inf = inferior; Med = medial; Orb = Orbital; Oper = Opercular; Tri = triangular; Ant = anterior; Post = posterior.
Between-Group Differences in Regional Network Measures
In this study, we performed regional network comparisons using normalized betweenness cen-trality and normalized degree to help localize abnormal brain areas in HBV-RC patients. With a relatively liberal statistical threshold (p<0.05, uncorrected), we observed both decreased and increased regional nodal degree/betweenness in multiple brain regions in the HBV-RC group, predominantly located in the association cortices (frontal and temporal regions), the paralim-bic cortices (cingulum and amygdala), and one subcortical region (pallidum). A recent VBM study using MRI [11] has indicated that the decreased GM volume detected in cirrhotic pa-tients with minimal HE is predominantly located in the frontal and temporal cortices, the para-central lobule, the caudate, the putamen and the amygdala. Pathologically, Alzheimer type II
Fig 3. Between-group differences in regional network topology.(a-b)The hepatitis B virus-related cirrhosis (HBV-RC) group exhibited decreased network betweenness centrality in the left inferior frontal gyrus (triangular part), the superior frontal gyrus, and the medial superior frontal gyrus, and exhibited increased network betweenness centrality in the left middle cingulum and the right putamen.(c-d)The HBV-RC group exhibited a decreased network degree in the right amygdala, the anterior cingulum, the post cingulum, the pallidum, the inferior temporal gyrus, and the left medial superior frontal gyrus, and exhibited an increased network degree in the left inferior frontal gyrus (opercular part) and the left rolandic operculum.*indicatesp<
0.001. Abbreviations: L = left hemisphere; R = right hemisphere; AMYG = amygdala; ANG = angular gyrus; CALC = calcarine fissure; CN = caudate nucleus; ACC = anterior cingulate; MCC = mid-cingulate; PCC = posterior cingulate; CUN = cuneus; IFOp = inferior frontal gyrus, opercular part; IFOr = inferior frontal gyrus, orbital part; IFTr = inferior frontal gyrus, triangular part; MedFOr = medial frontal gyrus, orbital part; MFG = middle frontal gyrus; MFOr = middle frontal gyrus, orbital part; SFG = superior frontal gyrus; MedSF = superior frontal gyrus, medial part; SFOr = superior frontal gyrus, orbital part; FG = fusiform gyrus; HSHL = heschl gyrus; HIPP = hippocampus; INS = insula; LNG = lingual gyrus; IOG = inferior occipital gyrus; MOG = middle occipital gyrus; SOG = superior occipital gyrus; OFB = olfactory cortex; PLD = lenticular nucleus, pallidum; PCL = paracentral lobule; PHIP = parahippocampal gyrus; IPL = inferior parietal lobule; SPL = superior parietal lobule; PoCG = postcentral gyrus; PrCG = precentral gyrus; PCUN = precuneus; PUT = putamen; REC = gyrus rectus; RLN = rolandic operculum; SMA = supplementary motor area; SMG = supramarginal gyrus; ITG = inferior temporal gyrus; MTG = middle temporal gyrus; MTP = middle temporal pole; STP = superior temporal pole; STG = superior temporal gyrus; THL = thalamus.
astrocytes in the GM and a diffuse pseudolaminarspongy degeneration of the cortex, the puta-men, the pallidum, and the caudate nucleus are characteristic findings in cirrhotic patients with chronic HE [38]. Taken together, these results indicate that such diffuse GM structural ab-normalities may be at least partially responsible for the widespread regional changes observed in the network properties.
After the threshold was increased top= 0.001, a decreased regional nodal degree in the infe-rior temporal gyrus was observed. As part of the ventral pathway, the infeinfe-rior temporal gyrus is
Table 3. Hubs in patients and normal controls, as defined based on normalized betweenness centrality and degree.
HBV-RC CON
Region Class Averagebi/ki Region Class Averagebi/ki
bi ki bi ki
L.Frontal_Inf_Oper Association 5.987* 9.100* L.Frontal_Inf_Tri Association 7.752* 7.463*
R.Frontal_Inf_Orb Association 3.295 9.100* L.Frontal_Sup Association 4.997* 6.850*
R.Frontal_Sup_Orb Association 9.100* 2.839 L.Frontal_Sup_Med Association 4.463 6.440*
L.Frontal_Mid Association 3.969 7.143* R.Parietal_Inf Association 9.100* 6.850*
R.Supp_Motor_Area Association 4.494* 8.317* R.Temporal_Sup Association 8.749* 9.100*
L.Temporal_Mid Association 5.315* 9.100* R.Fusiform Association 4.272 6.645*
R.Cingulum_Mid Paralimbic 4.062 6.556* R.Lingual Association 4.709 6.645*
L.Insula Paralimbic 3.369 7.926* L.Occipital_Mid Association 4.959* 6.440*
L.Precentral Primary 1.771 8.317* R.Temporal_Pole_Sup Paralimbic 4.084 6.440*
L.Postcentral Primary 2.395* 7.339 L.Precentral Primary 7.260* 5.213
L.Heschl Primary 2.480 7.339*
R.Putamen Subcortical 5.875* 1.273
*indicates nodes with regional values at least 1.5 standard deviations greater than the mean value. The regions were classified as primary, association, and paralimbic as described by Mesulam (1998).
Abbreviations: CON = control; HBV-RC = hepatitis B virus-related cirrhosis; L = left; R = right; Sup = superior; Inf = inferior; Med = medial; Mid = middle; Orb = Orbital; Oper = Opercular; Tri = triangular.
doi:10.1371/journal.pone.0119339.t003
Fig 4. Network hubs.Hubs of the networks constructed for the hepatitis B virus-related cirrhosis (HBV-RC) group(a)and the control (CON) group(b)based on nodal betweenness and nodal degree. The gray lines indicate connections (edges), and the spheres represent regions (nodes). The hubs are magnified, with radii proportional to the nodal metrics. The hubs are marked in red. Abbreviations: L = left hemisphere; R = right hemisphere; MCC = mid-cingulate; IFOp = inferior frontal gyrus, opercular part; IFOr = inferior frontal gyrus, orbital part; IFTr = inferior frontal gyrus, triangular part; MFG = middle frontal gyrus; SFG = superior frontal gyrus; MedSF = superior frontal gyrus, medial part; SFOr = superior frontal gyrus, orbital part; FG = fusiform gyrus; HSHL = heschl gyrus; INS = insula; LNG = lingual gyrus; MOG = middle occipital gyrus; IPL = inferior parietal lobule; PoCG = postcentral gyrus; PrCG = precentral gyrus; PUT = putamen; SMA = supplementary motor area; MTG = middle temporal gyrus; STP = superior temporal pole; STG = superior temporal gyrus.
important to high-level visual processing [39]. Neuroimaging studies [6–9] have consistently found that patients with cirrhosis display abnormal resting-state brain activity and functional connectivity within the visual-association areas. Thus, our finding of a decreased regional nodal degree in visual-association areas provides new evidence that the visual-associated sub-network is relatively vulnerable to neurological impairments caused by HBV-RC.
Network Hub Analysis
As crucial components required for efficient communication in a network, hubs regulate infor-mation flow and play a key role in network resilience against insult. In the present study, the number (6/12 vs. 8/10) and the distribution of association hubs varied between the two groups. Among the abnormal changes in the hub regions observed in the HBV-RC group, the inferior parietal gyrus belongs to the default mode network, which has been hypothesized to be pro-foundly relevant to various cognitive processes, such as visual attention, memory, and motor activity [40]. The fusiform, the lingual gyrus and the middle occipital gyrus are intimately in-volved in visual information processing [41,42]. The fact that the network of the HBV-RC pa-tients did not exhibit the expected association hubs suggests the occurrence of network-level changes in these regions, which may be functionally linked to the visual association abilities, motor-related performance, attention and memory function of the HBV-RC patients assessed in this study.
Interestingly, the total number of hubs increased in the HBV-RC group, with the addition of non-association hubs (paralimbic, primary and subcortical regions).These findings are con-sistent with a recent study of the functional connectivity networks of cirrhotic patients without OHE [43], which also observed an increased total number of hubs. These findings may be ex-plained in terms of compensation for the disrupted modularity in non-HE patients [43]. Thus, the increased number of non-association hubs observed in our study may be a compensatory mechanism for the decreased number of hubs and the overall hub disruption in the association cortex. This compensatory mechanism may enable HBV-RC patients to use additional re-sources to approach a normal level of cognition.
Limitations
Conclusions
Despite these limitations, the present findings enhance our understanding of the neural basis of the cognitive deficits observed in patients with HBV-RC without OHE by demonstrating ab-errations in the network properties of the cirrhotic brain, specifically the decreased clustering coefficient and the decreased small-worldness, which suggest the reduced efficiency of the net-work. The observed regional pattern of abnormalities in the association cortices (frontal and temporal regions) may be related to the impaired cognitive abilities of cirrhotic patients. These findings provide new insight into the interregional reorganization occurring in the brains of these patients from a network perspective.
Supporting Information
S1 Data. Raw 3D-T1WI image of subject No.1. (GZ)
S2 Data. Warped grey matter image of subject No.1 in Montreal Neurological Institute space using the DARTEL toolbox.
(GZ)
S1 Table. Extracted average grey matter volume of 90 brain regions from each subject. (XLSX)
Author Contributions
Conceived and designed the experiments: CMX GW XLZ GHJ. Performed the experiments: XFL YWQ. Analyzed the data: KL XFL YWQ YJD. Contributed reagents/materials/analysis tools: PQC JL CMX PHW. Wrote the paper: XFL KL.
References
1. Guan R, Lui HF. Treatment of hepatitis B in decompensated liver cirrhosis. Int J Hepatol. 2011; 2011: 918017. doi:10.4061/2011/918017PMID:21994876
2. Moriwaki H, Shiraki M, Iwasa J, Terakura Y. Hepatic encephalopathy as a complication of liver cirrho-sis: an Asian perspective. J Gastroenterol Hepatol. 2010; 25: 858–863. doi:10.1111/j.1440-1746.2010. 06242.xPMID:20546438
3. Cordoba J. New assessment of hepatic encephalopathy. J Hepatol. 2011; 54: 1030–1040. doi:10. 1016/j.jhep.2010.11.015PMID:21145874
4. Li YY, Nie YQ, Sha WH, Zeng Z, Yang FY, Ping L, et al. Prevalence of subclinical hepatic encephalopa-thy in cirrhotic patients in China. World J Gastroenterol. 2004; 10: 2397–2401. PMID:15285027
5. Randolph C, Hilsabeck R, Kato A, Kharbanda P, Li YY, Mapelli D, et al. Neuropsychological assess-ment of hepatic encephalopathy: ISHEN practice guidelines. Liver Int. 2009; 29: 629–635. doi:10. 1111/j.1478-3231.2009.02009.xPMID:19302444
6. Lv XF, Qiu YW, Tian JZ, Xie CM, Han LJ, Su HH, et al. Abnormal regional homogeneity of resting-state brain activity in patients with HBV-related cirrhosis without overt hepatic encephalopathy. Liver Int. 2013; 33: 375–383. doi:10.1111/liv.12096PMID:23402608
7. Lv XF, Ye M, Han LJ, Zhang XL, Cai PQ, Jiang GH, et al. Abnormal baseline brain activity in patients with HBV-related cirrhosis without overt hepatic encephalopathy revealed by resting-state functional MRI. Metab Brain Dis. 2013; 28: 485–492. doi:10.1007/s11011-013-9420-4PMID:23836055
8. Zhang LJ, Zheng G, Zhang L, Zhong J, Wu S, Qi R, et al. Altered brain functional connectivity in patients with cirrhosis and minimal hepatic encephalopathy: a functional MR imaging study. Radiology. 2012; 265: 528–536. doi:10.1148/radiol.12120185PMID:22996745
10. Hsu TW, Wu CW, Cheng YF, Chen HL, Lu CH, Cho KH, et al. Impaired small-world network efficiency and dynamic functional distribution in patients with cirrhosis. PLoS One. 2012; 7: e35266. doi:10.1371/ journal.pone.0035266PMID:22563460
11. Qi R, Zhang LJ, Zhong J, Zhu T, Zhang Z, Xu C, et al. Grey and white matter abnormalities in minimal hepatic encephalopathy: a study combining voxel-based morphometry and tract-based spatial statis-tics. Eur Radiol. 2013; 23: 3370–3378. doi:10.1007/s00330-013-2963-2PMID:23839169
12. Montoliu C, Gonzalez-Escamilla G, Atienza M, Urios A, Gonzalez O, Wassel A, et al. Focal cortical damage parallels cognitive impairment in minimal hepatic encephalopathy. Neuroimage. 2012; 61: 1165–1175. doi:10.1016/j.neuroimage.2012.03.041PMID:22465844
13. Qi R, Xu Q, Zhang LJ, Zhong J, Zheng G, Wu S, et al. Structural and functional abnormalities of default mode network in minimal hepatic encephalopathy: a study combining DTI and fMRI. PLoS One. 2012; 7: e41376. doi:10.1371/journal.pone.0041376PMID:22911787
14. Iwasa M, Mifuji-Moroka R, Kuroda M, Moroka H, Fujita N, Kobayashi Y, et al. Regional reduction in gray and white matter volume in brains of cirrhotic patients: voxel-based analysis of MRI. Metab Brain Dis. 2012; 27: 551–557. doi:10.1007/s11011-012-9314-xPMID:22618586
15. Guevara M, Baccaro ME, Gomez-Anson B, Frisoni G, Testa C, Torre A, et al. Cerebral magnetic reso-nance imaging reveals marked abnormalities of brain tissue density in patients with cirrhosis without overt hepatic encephalopathy. J Hepatol. 2011; 55: 564–573. doi:10.1016/j.jhep.2010.12.008PMID: 21163310
16. Tao R, Zhang J, You Z, Wei L, Fan Y, Cui J, et al. The thalamus in cirrhotic patients with and without he-patic encephalopathy: a volumetric MRI study. Eur J Radiol. 2013; 82: e715–e720. doi:10.1016/j.ejrad. 2013.07.029PMID:23981388
17. Chen HJ, Zhu XQ, Shu H, Yang M, Zhang Y, Ding J, et al. Structural and functional cerebral impair-ments in cirrhotic patients with a history of overt hepatic encephalopathy. Eur J Radiol. 2012; 81: 2463– 2469. doi:10.1016/j.ejrad.2011.10.008PMID:22056487
18. He Y, Chen ZJ, Evans AC. Small-world anatomical networks in the human brain revealed by cortical thickness from MRI. Cereb Cortex. 2007; 17: 2407–2419. PMID:17204824
19. Alexander-Bloch A, Giedd JN, Bullmore E. Imaging structural co-variance between human brain re-gions. Nat Rev Neurosci. 2013; 14: 322–336. doi:10.1038/nrn3465PMID:23531697
20. Wu K, Taki Y, Sato K, Kinomura S, Goto R, Okada K, et al. Age-related changes in topological organi-zation of structural brain networks in healthy individuals. Hum Brain Mapp. 2012; 33: 552–568. doi:10. 1002/hbm.21232PMID:21391279
21. Zhang Y, Lin L, Lin CP, Zhou Y, Chou KH, Lo CY, et al. Abnormal topological organization of structural brain networks in schizophrenia. Schizophr Res. 2012; 141: 109–118. doi:10.1016/j.schres.2012.08. 021PMID:22981811
22. Watts DJ, Strogatz SH. Collective dynamics of 'small-world' networks. Nature. 1998; 393: 440–442. PMID:9623998
23. Bassett DS, Bullmore E. Small-world brain networks. Neuroscientist. 2006; 12: 512–523. PMID: 17079517
24. He Y, Chen Z, Evans A. Structural insights into aberrant topological patterns of large-scale cortical net-works in Alzheimer's disease. J Neurosci. 2008; 28: 4756–4766. doi:10.1523/JNEUROSCI.0141-08. 2008PMID:18448652
25. Singh MK, Kesler SR, Hadi HS, Kelley RG, Amatya D, Hamilton JP, et al. Anomalous gray matter struc-tural networks in major depressive disorder. Biol Psychiatry. 2013; 74: 777–785. doi:10.1016/j. biopsych.2013.03.005PMID:23601854
26. Burra P, Senzolo M, Pizzolato G, Ermani M, Chierichetti F, Bassanello M, et al. Does liver-disease aeti-ology have a role in cerebral blood-flow alterations in liver cirrhosis? Eur J Gastroenterol Hepatol. 2004; 16: 885–890. PMID:15316413
27. Weissenborn K. PHES: one label, different goods?!. J Hepatol. 2008; 49: 308–312. doi:10.1016/j.jhep. 2008.06.023PMID:18644646
28. Ashburner J. A fast diffeomorphic image registration algorithm. Neuroimage. 2007; 38: 95–113. PMID: 17761438
29. Tzourio-Mazoyer N, Landeau B, Papathanassiou D, Crivello F, Etard O, Delcroix N, et al. Automated anatomical labeling of activations in SPM using a macroscopic anatomical parcellation of the MNI MRI single-subject brain. Neuroimage. 2002; 15: 273–289. PMID:11771995
30. Kaiser M, Hilgetag CC. Nonoptimal component placement, but short processing paths, due to long-dis-tance projections in neural systems. PLoS Comput Biol. 2006; 2: e95. PMID:16848638
32. Rubinov M, Sporns O. Complex network measures of brain connectivity: uses and interpretations. Neu-roimage. 2010; 52: 1059–1069. doi:10.1016/j.neuroimage.2009.10.003PMID:19819337
33. Maslov S, Sneppen K. Specificity and stability in topology of protein networks. Science. 2002; 296: 910–913. PMID:11988575
34. Freeman LC. A set of measures of centrality based on betweenness. Sociometry. 1977; 40: 35–41. 35. Bassett DS, Bullmore E, Verchinski BA, Mattay VS, Weinberger DR, Meyer-Lindenberg. A Hierarchical
organization of human cortical networks in health and schizophrenia. J Neurosci. 2008; 28: 9239– 9248. doi:10.1523/JNEUROSCI.1929-08.2008PMID:18784304
36. Bullmore ET, Suckling J, Overmeyer S, Rabe-Hesketh S, Taylor E, Brammer MJ. Global, voxel, and cluster tests, by theory and permutation, for a difference between two groups of structural MR images of the brain. IEEE Trans Med Imaging. 1999; 18: 32–42. PMID:10193695
37. Hosseini SM, Hoeft F, Kesler SR. GAT: a graph-theoretical analysis toolbox for analyzing between-group differences in large-scale structural and functional brain networks. PLoS One. 2012; 7: e40709. doi:10.1371/journal.pone.0040709PMID:22808240
38. Matsusue E, Kinoshita T, Ohama E, Ogawa T. Cerebral cortical and white matter lesions in chronic he-patic encephalopathy: MR-pathologic correlations. AJNR Am J Neuroradiol. 2005; 26: 347–351. PMID: 15709133
39. Kravitz DJ, Saleem KS, Baker CI, Mishkin M. A new neural framework for visuospatial processing. Nat Rev Neurosci. 2011; 12: 217–230. doi:10.1038/nrn3008PMID:21415848
40. Buckner RL, Andrews-Hanna JR, Schacter DL. The brain's default network: anatomy, function, and rel-evance to disease. Ann N Y Acad Sci. 2008; 1124: 1–38. doi:10.1196/annals.1440.011PMID: 18400922
41. Lee HW, Hong SB, Seo DW, Tae WS, Hong SC. Mapping of functional organization in human visual cortex: electrical cortical stimulation. Neurology. 2000; 54: 849–854. PMID:10690975
42. Wandell BA, Dumoulin SO, Brewer AA. Visual field maps in human cortex. Neuron. 2007; 56: 366–383. PMID:17964252