Hydrol. Earth Syst. Sci., 17, 3485–3498, 2013 www.hydrol-earth-syst-sci.net/17/3485/2013/ doi:10.5194/hess-17-3485-2013
© Author(s) 2013. CC Attribution 3.0 License.
Geoscientiic
Geoscientiic
Hydrology and
Earth System
Sciences
Open Access
Impact of long-term drainage on summer groundwater flow
patterns in the Mer Bleue peatland, Ontario, Canada
B. J. Kopp1,*, J. H. Fleckenstein2,**, N. T. Roulet3, E. Humphreys4, J. Talbot3,***, and C. Blodau1,3,**** 1Limnological Research Station and Department of Hydrology, University of Bayreuth, Bayreuth, Germany 2Department of Hydrology, University of Bayreuth, Bayreuth, Germany
3Department of Geography and the Global Environmental and Climate Change Centre, McGill University, Montreal, Canada 4Department of Geography and Environmental Studies, Carleton University, Ottawa, Canada
*present address: Institute of Geography – Physical Geography, University of Heidelberg, Heidelberg, Germany
**present address: Department of Groundwater Research, Centre for Environmental Research – UFZ, Halle-Leipzig, Germany ***present address: Department of Geography, Universit´e de Montr´eal, Montreal, Canada
****now at: Hydrology Group, Institute of Landscape Ecology, University of M¨unster, M¨unster, Germany
Correspondence to:C. Blodau ([email protected])
Received: 7 December 2012 – Published in Hydrol. Earth Syst. Sci. Discuss.: 2 January 2013 Revised: 5 July 2013 – Accepted: 22 July 2013 – Published: 12 September 2013
Abstract.Long-term impacts of drier conditions on the hy-drology of northern peatlands are poorly understood. We used long-term drainage near a historic drainage ditch, sep-arating an area from the main peatland, as an analogue for long-term drying in a northern temperate bog. The objective was to identify the impact of drier conditions on ecohydro-logical processes and groundwater flow patterns in an area now forested and an area that maintained a bog-like char-acter. Groundwater flow patterns alternated between mostly downward flow and occasionally upward flow in the bog area and were mostly upward-orientated in the forested area, which suggested that there the flow pattern had shifted from bog- to fen-like conditions. Flow patterns were in agree-ment with changes in post-drainage hydraulic conductivities, storage capacity of the peat and water table levels. Com-pared to the bog, hydraulic conductivities in the forested area were one to three orders of magnitude lower in the upper-most 0.75 m of peat (pairedt test, p <0.05). Bulk density had increased and the water table level was lower and more strongly fluctuating in the forested area. Our findings suggest hydraulic gradients and flow patterns have changed due to increased evapotranspiration and interception with the emer-gence of a tree cover. The smaller size of the now-forested area relative to the remaining bog area appeared to be impor-tant for the hydrological change. With the main Mer Bleue bog as hinterland, enhanced runoff to the drainage channel
had little effect on hydrologic and vegetation patterns. In the cut-off, smaller, now forested area pervasive changes in vegetation and hydrologic processes occurred. The differ-ence in response to local drainage raises questions about tip-ping points with respect to the impact of drying on peatland ecosystems that need to be addressed in future research.
1 Introduction
Groundwater flow patterns have been studied in differ-ent types of peatlands (e.g. Siegel, 1993; Waddington and Roulet, 1997; Drexler et al., 1999; Fraser et al., 2001; Baird et al., 2008). Controls on the direction and magnitude of flow have been particularly emphasized (Reeve et al., 2006). The occurrence of seasonal flow reversals has been shown to in-fluence geochemical profiles (Devito et al., 1997; Fraser et al., 2001). Other studies focussing on local flow patterns have suggested that the plant community composition of peatland systems is affected as well (Drexler et al., 1999). Strong effects of long-term flow reversal on vegetation pat-terns have, for example, been identified in a bog-fen com-plex of the Lost River peatland, Northern Minnesota (Siegel and Glaser, 1987; Glaser et al., 1990). In this area local is-lands are predominantly composed of groundwater recharge and the upwelling of nutrient- and alkaline-rich waters have been identified (Siegel and Glaser, 1987). These islands sus-tained a rich fen as well asPicea- andLarix-rich swamp veg-etation within a largerSphagnum-dominated bog complex. The creation of such an area of distinctly different vegeta-tion was identified by a sharp transivegeta-tion from peat moss to sedge peat at about 1160 yr before present (1950) (Glaser et al., 1990). The authors suggested that long-term groundwater flow reversal occurred at this time and was related to peatland growth. Given the impact of vegetation change on carbon cy-cling it is important to identify and characterize similar ef-fects of groundwater flow patterns that are related to changes in the water budget of peatlands, for example by drainage and climate change.
Current global circulation models (GCMs) of climate change predict that in the 21st century climate will undergo significant changes in the wet boreal and north temperate zone, where northern peatlands are mostly located. In On-tario, where a large fraction of Canada’s 1.14 Million km−2 of peatlands is located (Tarnocai, 2006), winter temperatures will increase by 4 to 5◦C and summer temperatures by 3 to 4◦C by 2080–2099, assuming a world of rapid economic growth, the introduction of new and more efficient technolo-gies, and a global population that peaks mid-century (IPCC, 2007). Winters will likely be wetter, and precipitation will increase by 20–30 % in Southern and Central Ontario. Sum-mers are predicted to sustain current, slightly higher or lower (±10 %) precipitation depending on region and model, which has also been the result of regional analyses for the mid-century (Plummer et al., 2006). Steady summer precipita-tion levels should lead to decreased soil moisture due to evapotranspiration substantially increasing with air temper-ature, as has, for example, been shown on the watershed scale in the Experimental Lakes area of Northwestern On-tario (Schindler, 1997).
Long-term drier conditions induced by drainage repre-sent to some extent an analogue for a warmer climate characterized by higher summer evapotranspiration. Related changes in hydrologic properties and processes, such as in hydraulic conductivities and groundwater flow patterns, may
also provide some insight into potential effects of climate change. Over periods of a few years, drainage resulted in a lowered water table, loss of macropores, increased bulk density, decreased hydraulic conductivities (Kh)(Silins and
Rothwell, 1998; Price et al., 2003), and increased rates of organic matter decomposition (Laiho, 2006). The resulting change in peat physical properties affected the hydrologi-cal functioning of these ecosystems (Silins and Rothwell, 1998; Price et al., 2003). On the decadal timescale vegeta-tion patterns also change in response to drainage (Talbot et al., 2010). In peatlands with wet microenvironments such as the Mer Bleue bog, Ontario, peat mosses and sedges typi-cally dominate, whereas shrubs are more abundant in drier areas (Moore et al., 2002). Subsequent to drainage, trees can become prominent depending on the nutrient regime (Laiho, 2006). These changes in plant community affect the rate and chemical composition of litterfall and thus rates of soil organic matter decomposition (Laiho, 2006; Bubier et al., 2007). The denser canopy cover of trees and shrubs has the potential to increase evapotranspiration (ET) (Price et al., 2003; Lafleur et al., 2005; Beheim, 2006; Talbot et al., 2010), increase interception (I) (Price et al., 2003; Emili and Price, 2006) and lower groundwater recharge. In peatlands affected by persistent drainage, discharging groundwater flow may thus be more frequent and prominent and runoff may be lower during the summer season.
To improve our insight into the interactions between dry-ness by increased runoff, groundwater flow patterns, and vegetation change we hydrologically characterized a drained area in the Mer Bleue peatland, Ontario. Drainage by a chan-nel of 4 km length and about 10 m width has been active for about 90 yr and created two areas of strikingly different veg-etation, with an open bog-turned-forest present only on one side (Talbot et al., 2010). Our objective was to identify the impact of drainage on hydraulic conductivity and groundwa-ter flow patgroundwa-terns on both sides and to gain some insight on their potential importance for post-drainage vegetation de-velopment. We hypothesized that recharge in the smaller and now forested part of the peatland separated by the channel would be reduced due to higher ET and I, and poorly per-meable, more decomposed peat. The empirical data obtained were used to parameterize a MODFLOW groundwater model to simulate and quantitatively analyze the groundwater flow.
2 Study sites, materials and methods
2.1 Study site
28
29
77
,
P 600 m P1
P2 P3 P4
P5-7 P8 P9
P10
P11
P45m ‘Forest‘ P45m ‘Bog‘
Fig. 1.Cross section of the study transect installed perpendicular to the drainage ditch in the western part of the Mer Bleue Bog,
On-tario, Canada (a), and Google Earth image of the site during the
simulation period in September, 2008 (b).(a)illustrates the
posi-tion of the peat surface, piezometer nest arrangement (P1–P11), the water level and the peat–clay interface. Additional piezometer nests, serving as reference sites, were installed 600 m from the ditch in the open bog and 45 m from the ditch on both sides. Peat depth is
verti-cally exaggerated.(b)illustrates the distinct differences in terms of
vegetation between both sides of the transect. The 60 m Forest site
supported on average 4900 g m−2aboveground biomass, whereas
the 200 m Bog site only supported 690 g m−2(Talbot, 2009).
been reported as 5.8◦C, 944 mm, and 193 days, respectively (Environment Canada, 2004). A description of the biogeo-chemistry and hydrology of the peatland has been provided by Blodau et al. (2002) and Fraser et al. (2001).
A transect covering the open peatland in the west (“Bog”), drainage ditch, installed in 1922 (Talbot et al., 2010), and the now forested peatland in the eastern end (“Forest”) was ex-amined (Fig. 1). Regarding terminology we only refer to the remaining open peatland west of the ditch as “Bog” because only this area has maintained a hydrologic regime and veg-etation cover typical for ombrotrophic conditions (Fig. 1b). Vegetation in the Bog is characterized by aSphagnummoss ground cover and an overstory dominated by evergreen and deciduous ericaceous shrubs, and a sparse cover of trees – black spruce (Picea mariana), tamarack (Larix laricina) and
grey birch (Betula populifolia) (Talbot et al., 2010). Close to the ditch, the abundance of shrubs and trees is higher, and trees and shrubs dominate in the “Forest” (Fig. 1). Above-ground biomass was between 688±234 and 699±234 g m−2 at the Bog sites and 3170±450 and 5720±1620 g m−2 at the Forest sites. Total leaf area index was 1.25 to 1.58 in the Bog and 5.3 to 7.25 under forest (Talbot, 2009). A detailed description of the plant distribution across the transect has been given by Talbot et al. (2010). Tree growth started after lowering of the ground water table, together with increased organic matter mineralization due to aeration of former satu-rated peat (Talbot et al., 2010; Blodau and Siems, 2010). The lowered land surface has been hydrologically isolated from the open bog in the west (Fig. 1). Peat depths range from 1.85 m near the ditch to 2.5 m on the east side and>4 m on the west side. The peat is underlain by a marine clay layer of 12–45 m thickness (Fraser et al., 2001), which is a source of chloride that has been used as natural conservative tracer to investigate vertical transport processes at this peatland (Beer et al., 2008).
2.2 Analysis of pre- and post-drainage tree cover and
water table
A detailed methodology of this analysis has been given in Talbot et al. (2010). It is only briefly described here. Two 10×10×100 cm-long peat cores were extracted in 2004 from about 60 m from each border of the actual drainage ditch at a total distance of 150 m. The Bog core was taken from a lawn microsite and the Forest core from a flat clearing in a denseBetula populifoliastand. The cores were dated using
210Pb and the constant rate of supply model (Appleby and
Oldfield, 1978). Age dating was verified with two markers, theAmbrosiarise with European settlement in 1820 and the Carlton County fire charcoal layer in 1870. Cores were sec-tioned in 1 cm layers and pollen andtestate amoebaewere analyzed down to 50 cm depth on sub-samples of each layer as described in detail in Talbot et al. (2010). Transfer func-tions were applied to thetestate amoebaedata to reconstruct changes in water table depth using a weighted average partial least square model (WA-PLS) (Booth, 2007).
2.3 Precipitation, evapotranspiration, and
hydrogeological conditions
Surrounding uplands are well drained by a network of creeks and ditches at the margins of the peatland. Thus the con-tributing area for groundwater recharge was considered to be solely the peatland surface (Fraser et al., 2001). Half-hourly measurements of precipitation (P) and latent heat flux (QE)
of vertical wind velocity (measured with a sonic anemome-ter, model R3-50, Gill Instruments Ltd., England) and wa-ter vapour mixing ratio (measured with a closed-path infra red gas analyzer, model LI7000, LI-COR Inc., Lincoln, NB, USA) was used to computeQE. Quality control procedures
described by Lafleur et al. (2005) were applied to theQE
data. Gaps were then filled using an empirical relationship with available energy (net radiation minus the soil heat flux and changes in energy storage) parameterized using a mov-ing window method. ET was calculated by dividmov-ingQE by
the latent heat of vaporization (2.45×10⁶J kg−1).
Piezometers were constructed from 2.6 cm ID PVC pipe screened with 55 round inlets of 35 mm diameter each per piezometer, distributed over a 10 cm interval and covered with a nylon mosquito mesh. The length of the screened sec-tion was chosen according to Waddington and Roulet (1997). The design provided 26 % inner-diameter screening, or “in-take”, area (see Supplement, Fig. S1, for images). A total of eleven piezometer nests (P1–P11, Fig. 1) were installed across the transect in hollows 0, 3, 15, 30, 60 and 200 m dis-tance from the ditch at depths of 0.25, 0.50, 0.75, 1.0, 2.0 and 3.0 m, where peat depth permitted. Two additional piezome-ters were installed at the ditch and at the 3 m Forest site at 1.75 and 2.25 m depth. Additional piezometer nests were in-stalled; one at 600 m distance west of the ditch at the Bog and two piezometer nests at both sides at 45 m and 30 m distance perpendicular from the ditch and the transect, respectively. All piezometers were “developed” (Baird et al., 2004) be-fore any other measurement by pumping them empty at least once, depending on an examination of the sediment load in the extracted water; additional pumping preceded the deter-mination of hydraulic conductivity by slug tests (see below). Before hydraulic head measurements were carried out, the rebound of water tables to previous equilibrium levels was awaited. Hydraulic head was monitored with an electric dip stick every two to nine days. The most shallow, yet water-filled piezometer was used to approximate water table posi-tion, as referred to hereafter, which was always within 15 cm of a slotted portion of a shallow piezometer. Two potentio-metric water level loggers, reading every half-hour, were in-stalled in piezometers with slotted heads at 0.75 and 2.0 m depth at the 200 m sites of the transect. An atmospheric pres-sure sensor allowed for barometric compensation of the wa-ter level loggers.
The dominant groundwater flow direction in this study was inferred from the head differentials in the piezometer nests according to the definitions in Drexler et al. (1999). To min-imize the chance of artifacts in hydraulic head due to slow equilibration, only hydraulic head readings at local tempo-ral maxima or minima were considered for assessing ver-tical flow. Locations where hydraulic head decreases with depth in the peat column define areas of recharge or down-ward flow and locations where hydraulic head increases with depth define areas of discharge or upward flow. Locations with hydraulic head changes smaller than 2 cm with depth
and horizontal head gradients suggest areas of lateral or hor-izontal flow.
Horizontal hydraulic conductivity was estimated from slug insertion after Hvorslev (1951) subsequent to the measure-ment of hydraulic heads and the sampling of pore water. This sequence ensured (a) that slug tests did not influence other measurements in the piezometers along the transect and (b) that piezometers were pumped out on three more occasions after their initial development. In some piezometers we ex-amined the reproducibility of water table adjustment after slug insertion. Exemplary test runs are shown in the Supple-ment (Fig. S2). The results suggested that some differences between test runs occurred. The deviation did not seem sys-tematic since both higher and lower hydraulic conductivity was found when repeating slug insertion. In practical terms, the piezometers were manually filled with a conventional wa-tering can and immediately after, the water table decline was recorded. As the method can only be applied in the saturated zone a determination ofKhdue to the low water table was not
possible in some piezometers because they never contained water or fell dry at some point. Vertical hydraulic conduc-tivity was calculated using an average anisotropy (Kh/Kv)of
450, as proposed by Fraser et al. (2001) for a pristine section of the Mer Bleue peatland. Porosity was determined in peat samples collected with a Finnish box corer in 10 cm intervals down to 0.7 m depth at the 60 m sites and a Russian corer at the 200, 60, 30 and 3 m sites at 0.75, 1.0, 2.0 and 3.0 m depth by drying at 70◦C to constant mass. Porosity was calculated from bulk density and a specific density of the peat solids of 1.5 g cm−3(Weiss et al., 1998).
2.4 Sampling and analyses
Peat pore water was sampled on 13 August, 5 Septem-ber and 4 OctoSeptem-ber, after emptying piezometers the day be-fore, completing hydraulic head measurements, and insert-ing polyethylene (PE) float levers to prevent air circulation (Heitmann et al., 2007). Samples were taken using a tube and 50 mL luer lock syringe, filtered (0.45 µm, nylon), and frozen for further analysis. Following further filtration (0.2 µm, ny-lon) pore-water concentrations of chloride (Cl−)were an-alyzed using an ion chromatograph (Metrohm IC-System, Metrosep Anion Dual 3 column at 0.8 mL min−1flow rate, conductivity detection after chemical suppression). The de-tection limit was 5.6 µmol L−1.
2.5 Groundwater modelling
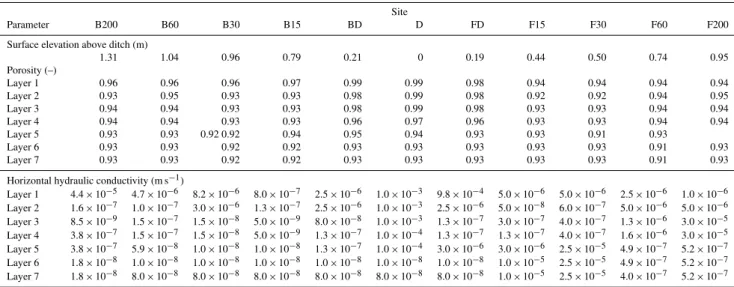
Table 1.Porosity and hydraulic conductivity estimates for each layer implemented in the steady-state and transient MODFLOW models.
Site
Parameter B200 B60 B30 B15 BD D FD F15 F30 F60 F200
Surface elevation above ditch (m)
1.31 1.04 0.96 0.79 0.21 0 0.19 0.44 0.50 0.74 0.95
Porosity (–)
Layer 1 0.96 0.96 0.96 0.97 0.99 0.99 0.98 0.94 0.94 0.94 0.94
Layer 2 0.93 0.95 0.93 0.93 0.98 0.99 0.98 0.92 0.92 0.94 0.95
Layer 3 0.94 0.94 0.93 0.93 0.98 0.99 0.98 0.93 0.93 0.94 0.94
Layer 4 0.94 0.94 0.93 0.93 0.96 0.97 0.96 0.93 0.93 0.94 0.94
Layer 5 0.93 0.93 0.92 0.92 0.94 0.95 0.94 0.93 0.93 0.91 0.93
Layer 6 0.93 0.93 0.92 0.92 0.93 0.93 0.93 0.93 0.93 0.91 0.93
Layer 7 0.93 0.93 0.92 0.92 0.93 0.93 0.93 0.93 0.93 0.91 0.93
Horizontal hydraulic conductivity (m s−1)
Layer 1 4.4×10⁻⁵ 4.7×10⁻⁶ 8.2×10⁻⁶ 8.0×10⁻⁷ 2.5×10⁻⁶ 1.0×10⁻³ 9.8×10⁻⁴ 5.0×10⁻⁶ 5.0×10⁻⁶ 2.5×10⁻⁶ 1.0×10⁻⁶ Layer 2 1.6×10⁻⁷ 1.0×10⁻⁷ 3.0×10⁻⁶ 1.3×10⁻⁷ 2.5×10⁻⁶ 1.0×10⁻³ 2.5×10⁻⁶ 5.0×10⁻⁸ 6.0×10⁻⁷ 5.0×10⁻⁶ 5.0×10⁻⁶ Layer 3 8.5×10⁻⁹ 1.5×10⁻⁷ 1.5×10⁻⁸ 5.0×10⁻⁹ 8.0×10⁻⁸ 1.0×10⁻³ 1.3×10⁻⁷ 3.0×10⁻⁷ 4.0×10⁻⁷ 1.3×10⁻⁶ 3.0×10⁻⁵ Layer 4 3.8×10⁻⁷ 1.5×10⁻⁷ 1.5×10⁻⁸ 5.0×10⁻⁹ 1.3×10⁻⁷ 1.0×10⁻⁴ 1.3×10⁻⁷ 1.3×10⁻⁷ 4.0×10⁻⁷ 1.6×10⁻⁶ 3.0×10⁻⁵ Layer 5 3.8×10⁻⁷ 5.9×10⁻⁸ 1.0×10⁻⁸ 1.0×10⁻⁸ 1.3×10⁻⁷ 1.0×10⁻⁴ 3.0×10⁻⁶ 3.0×10⁻⁶ 2.5×10⁻⁵ 4.9×10⁻⁷ 5.2×10⁻⁷ Layer 6 1.8×10⁻⁸ 1.0×10⁻⁸ 1.0×10⁻⁸ 1.0×10⁻⁸ 1.0×10⁻⁸ 1.0×10⁻⁸ 1.0×10⁻⁸ 1.0×10⁻⁵ 2.5×10⁻⁵ 4.9×10⁻⁷ 5.2×10⁻⁷ Layer 7 1.8×10⁻⁸ 8.0×10⁻⁸ 8.0×10⁻⁸ 8.0×10⁻⁸ 8.0×10⁻⁸ 8.0×10⁻⁸ 8.0×10⁻⁸ 1.0×10⁻⁵ 2.5×10⁻⁵ 4.0×10⁻⁷ 5.2×10⁻⁷
observation period from 10 August to 3 October was subse-quently created. The simulations used a total of 56 stress pe-riods, with each stress period representing one day. A stress period is defined as an increment of time in a transient sim-ulation during which aquifer recharge and discharge are held constant. A cell size of 3×3 m was chosen and each layer consisted of 33 rows in width (ydirection), 133 columns in length (x direction) and a total of 8 layers (zdirection). The layers consisted of seven peat layers and one marine clay layer (aquitard). For the uppermost peat layer a thickness of∼0.7 m was defined to avoid wetting/drying problems in MODFLOW due to large water table fluctuations, especially at the Forest. The thickness of the shallowest peat layer was chosen to coincide with piezometer depth, therefore rang-ing from∼0.25 to∼0.75 m. In general, layer thickness de-creased in the vicinity of the ditch. The following boundary conditions (BC) were assigned: constant head BCs for the east and west margins (first and last column) of each layer, deduced from the potentiometric water level logger data, and adjusted for each stress period; constant head drain BCs for the ditch in the uppermost layer deduced and adjusted for each stress period from the manually measured water level; a no-flow BC for the underlying marine clay layer. Model domain thickness was set to 4 m. Active cells in the model domain were defined by the surface elevation and the ele-vation of the marine clay layer.Kh values (Table 1) were
assigned based on slug tests in the piezometers. Porosity es-timates were obtained from laboratory analysis of soil sam-ples taken at the piezometer locations. Both parameters were interpolated (Kriging) for areas in between the piezometers. Due to interpolation errors, parameters for some sites were adjusted manually. We assumed layers to be homogenous in they direction. Furthermore, we applied the difference be-tween precipitation (P) and I and ET (P −ET−I) to the top layer of the transient model at the Bog and assumed it to
be lower at the Forest due to greater ET andI. The changes in ET (ET Bog + 2 mm) andI (I Bog + 0.5 mm) for the Forest were based on model calibration where we compared sim-ulated hydraulic heads to hydraulic heads measured in the field. Differences in a similar range in ET between mosses and trees in the growing season were found in other stud-ies (Heijmanns et al., 2004; Bond-Lamberty et al., 2009) al-though the additional 2 mm in our study for a forest stand is in the upper range of the literature.
2.6 Statistics and sensitivity analyses
To examine the statistical significance of differences in the horizontal hydraulic conductivities between the Bog and For-est side for each depth (Table 3), a pairedt test was applied with a 95 % confidence interval using the statistical software R.
To assess the variability and uncertainty of Kh and
anisotropy on model performance a sensitivity analysis was carried out (Auto Sensitivity Analysis, Groundwater Vistas 5). For each cell in the model from the channel to a distance of 60 m, theKhvalues were changed using a multiplier and
the residual sum of squares between measured and modelled hydraulic heads with variation of Kh was calculated. The
residual sum of squares here is an indicator for the impact of variation of a parameter in a single cell on the quality of the overall model. Increasing residual sum of squares indi-cate a high sensitivity as well as deterioration of the good-ness of fit. To reduce computing time, cells at distances more than 60 m from the channel were not considered. Further-more, these cells are more influenced by the constant head model boundaries.Khmultipliers of 0.001, 0.01, 0.1, 0.5, 1,
A sensitivity analysis of the impact of water input (P−ET−I) was carried out for each zone (Bog, Forest and ditch) in the uppermost layer using multipliers of 0.01, 0.1, 0.5, 1, 2, 10 and 100 the same way as described above.
3 Results
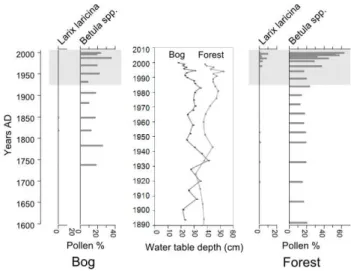
3.1 Pre- and post-drainage development of tree cover
A detailed reconstruction of the recent history of each side of the ditch pre- and post-drainage confirmed that the sites 60 m into both sides of the transect were relatively uniform prior to drainage, as analyzed in more detail in Talbot et al. (2010). Water table depth reconstructed via a testate amoeba transfer function showed that divergence of water tables between Bog and Forest side of the peatland took place after drainage. On the Bog side of the transect, a delayed increase in tree pollen (Larix laricinaandBetula ssp.) and a decrease inSphagnum
spores was detected in the peat layers that accumulated post-drainage (Fig. 2). The analysis thus suggests that post-drainage led to the currently large difference in the vegetation cover and plant biomass that was described in the Sect. 2.1.
3.2 Porosity and bulk density
Porosity at the 60 m sites was slightly higher in the upper-most 0.5 m of peat at the Bog compared to the Forest. At depths of 0.6 and 0.7 m the values were approximately equal. Mean porosity for the upper 0.7 m layer was 0.96 at the Bog and 0.94 at the Forest. Porosity deeper into the peat ranged between 0.94 and 0.92 at the Bog, and 0.95 and 0.91 at the Forest, slightly decreasing with depth at both areas. Mean porosity in marine clay was around 0.34 (n=2). Peat bulk density in the uppermost 0.5 m was higher in the For-est peat than in the Bog peat. ForFor-est bulk density peaked at 0.1 g cm−3at 0.2 m depth, 2.4 times the Bog bulk density of 0.04 g cm−3, and declined to 0.09 g cm−3, which is 1.3 times the Bog bulk density of 0.07 g cm−3at 0.5 m depth, until they were equal at 0.6 m depth at 0.09 g cm−3.
3.3 Hydraulic conductivities
Results of theKh measurements are shown in Table 2.Kh
estimates in acrotelm peat (∼0–0.55 m) at the Bog ranged from 10−8to 10−4m s−1(±8.3×10⁻⁵, standard deviation)
(n=5) and 10−8to 10−6m s−1(±3.4×10⁻⁶)(n=4) at the
Forest. In deeper peat (>0.55 m depth)Khestimates ranged
from 10−9to 10−6m s−1(±1.6×10⁻⁶)(n=14) at the Bog,
and from 10−8 to 10−5m s−1 (±1.1×10⁻⁵) (n=12) at the Forest. With Kh≪10−9m s−1 (±4.7×10⁻¹⁰)(n=7)
the underlying marine clay layer was least permeable. Un-der and near the ditch a clay lens seemed to be present at 2 m depth (Kh∼10−10m s−1 (±3.8×10⁻¹¹), n=3),
fol-lowed by amorphous clay material with higherKhvalues at
2.25 and 2.5 m depths (∼10−6to 10−7m s−1(±3.3×10⁻⁶),
Fig. 2. Pollen records of important trees at the site and testate amoeba-based water table reconstructions from peat cores sampled on each side of the drainage ditch (approx. 60 m from each ditch boundary), based on Talbot et al. (2010). The drainage ditch was es-tablished in 1922; the shaded area thus indicates the post-drainage period.
n=4). In general, both 15 m sites were characterized by low Kh estimates (10−7 to 10−9m s−1). Compared to the Bog
Khvalues at the Forest were significantly lower at a depth
of 0.75 m and significantly higher at a depth of 1.0 m (Ta-ble 3). No significant difference could be identified for the other depths.
3.4 Precipitation, evapotranspiration, and water table
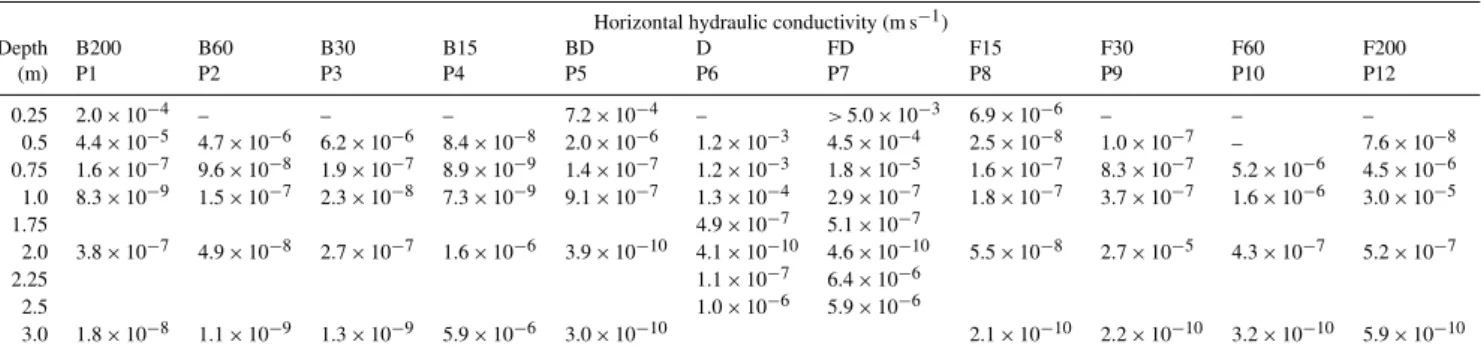
Table 2.Estimates of the horizontal hydraulic conductivities across the transect determined by slug tests after Hvorslev (1951).
Horizontal hydraulic conductivity (m s−1)
Depth B200 B60 B30 B15 BD D FD F15 F30 F60 F200
(m) P1 P2 P3 P4 P5 P6 P7 P8 P9 P10 P12
0.25 2.0×10⁻⁴ – – – 7.2×10⁻⁴ – >5.0×10⁻³ 6.9×10⁻⁶ – – – 0.5 4.4×10⁻⁵ 4.7×10⁻⁶ 6.2×10⁻⁶ 8.4×10⁻⁸ 2.0×10⁻⁶ 1.2×10⁻³ 4.5×10⁻⁴ 2.5×10⁻⁸ 1.0×10⁻⁷ – 7.6×10⁻⁸ 0.75 1.6×10⁻⁷ 9.6×10⁻⁸ 1.9×10⁻⁷ 8.9×10⁻⁹ 1.4×10⁻⁷ 1.2×10⁻³ 1.8×10⁻⁵ 1.6×10⁻⁷ 8.3×10⁻⁷ 5.2×10⁻⁶ 4.5×10⁻⁶ 1.0 8.3×10⁻⁹ 1.5×10⁻⁷ 2.3×10⁻⁸ 7.3×10⁻⁹ 9.1×10⁻⁷ 1.3×10⁻⁴ 2.9×10⁻⁷ 1.8×10⁻⁷ 3.7×10⁻⁷ 1.6×10⁻⁶ 3.0×10⁻⁵
1.75 4.9×10⁻⁷ 5.1×10⁻⁷
2.0 3.8×10⁻⁷ 4.9×10⁻⁸ 2.7×10⁻⁷ 1.6×10⁻⁶ 3.9×10⁻¹⁰ 4.1×10⁻¹⁰ 4.6×10⁻¹⁰ 5.5×10⁻⁸ 2.7×10⁻⁵ 4.3×10⁻⁷ 5.2×10⁻⁷
2.25 1.1×10⁻⁷ 6.4×10⁻⁶
2.5 1.0×10⁻⁶ 5.9×10⁻⁶
3.0 1.8×10⁻⁸ 1.1×10⁻⁹ 1.3×10⁻⁹ 5.9×10⁻⁶ 3.0×10⁻¹⁰ 2.1×10⁻¹⁰ 2.2×10⁻¹⁰ 3.2×10⁻¹⁰ 5.9×10⁻¹⁰
Fig. 3.Hydraulic potentials in 0.75 and 2.0 m depth of the 200 m sites at the Forest (light and dark grey triangles, Forest) and the bog
(light and dark grey squares, Bog).P in mm d−1 is displayed as
black bars and ET in mm d−1as white bars.
3.5 Hydraulic heads
Continuously monitored hydraulic heads at the 200 m Bog site indicated generally recharging conditions, i.e. downward directed flow, with the exception of a dry period at the end of September (Fig. 3). Recharge was suggested by a higher hy-draulic potential at 0.75 m than at 2.0 m depth. The hyhy-draulic dynamics differed at the Forest, where a discharging com-ponent, i.e. upward-directed flow, occurred in periods with water table decline. This was indicated by a higher hydraulic potential at a depth of 2.0 m than at 0.75 m (Fig. 3). At the Forest, recharge only occurred during and shortly after peri-ods with largerP than ET when the water table rose. The de-cline in hydraulic heads during late summer conditions was also much smaller at the Bog than at the Forest, especially in August when ET, measured in the open peatland, was still high at about 3 mm d−1.
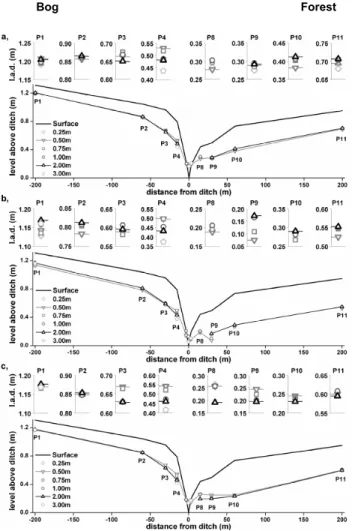
Manually monitored hydraulic heads along the transect are illustrated in Fig. 4 and depict the spatial pattern de-scribed above. We manually measured hydraulic heads be-tween 3 and 5 days after the preceding rainfall (compare
Table 3.Results of a pairedttest comparing the hydraulic conduc-tivities of the bog and forest side for each depth.
Significance
Depth Bog Forest (pvalue)
0.5 B200, B30, B15 F200, F30, F15 No (0.9396) 0.75 B200, B60, B30, B15 F200, F60, F30, F15 Yes (0.0064) 1.0 B200, B60, B30, B15 F200, F60, F30, F15 Yes (0.0295) 2.0 B200, B60, B30, B15 F200, F60, F30, F15 No (0.3228) 3.0 B200, B60, B30, B15 F200, F60, F30, F15 No (0.9298)
with precipitation record in Fig. 3). For this reason heads in the piezometers should have been adjusted to the true heads in the peat. Notable exceptions are layers with Kh<10−9m s−1, which mostly occurred in clay and cannot
be safely interpreted regarding changes in vertical head gra-dients. At the Bog, differences in hydraulic head with depth were small at the 60 and 200 m sites, suggesting predom-inantly lateral flow in this area. Near the channel this pat-tern changed. The vertical hydraulic heads 15 m from the channel indicated continuous recharge with differences in hydraulic head between 0.5 and 2.0 m depth ranging from −4.6 cm to−10.3 cm. It should be noted that at the piezome-ter nest 15 m from the ditchKhwas very low at 8.4×10⁻⁸
to 8.9×10⁻⁹m s−1so that the hydraulic head recorded with the piezometers may have been delayed in this position. Recharge also occurred 30 m from the channel, except for a brief period at the end of August. In the ditch, hydraulic heads measured at depths of 0.5 to 1.0 m indicated discharge, except for the dry period in late August and early Septem-ber, when conditions changed to recharge. Differences in hydraulic head between the open water and the hydraulic potentials at 2.25 and 2.5 m depth were around 5.0 cm and thus indicated confined conditions underneath the clay lens at around 2.0 m depth.
5
6
!
Fig. 4.Hydraulic heads of all piezometer nests on three different
days: 13 August(a), 2 September(b)and 4 October(c). Hydraulic
potential at 0.5 m depth is marked with grey reversed triangles and at 2.0 m depth with black triangles. Little diagrams above the panels are close-ups of the hydraulic potentials of each piezometer nest as shown in the panels and are given in units of level above the ditch (l.a.d.) in meters. The close-ups illustrate the occurrence of
both recharging hydraulic gradients (e.g.apiezometer nest P4) and
discharging conditions (e.g.bpiezometer nest P9). Peat depth is
vertically exaggerated.
15 September, 29 September and 4 October. Hydraulic heads at the 30 m site at the Forest at 0.5 and 2.0 m depth indicated a strong discharge reaching a maximum difference of 9.7 cm on 2 September. Hydraulic heads thus primarily indicated discharging conditions, rather than recharging as recorded at the Bog.
3.6 Groundwater modelling
The MODFLOW (GW-Vistas 5) model adequately repre-sented hydraulic heads in the flow field. The root mean square error (RMSE) between measured and observed hy-draulic potentials of 0.025 m for the steady-state simulation
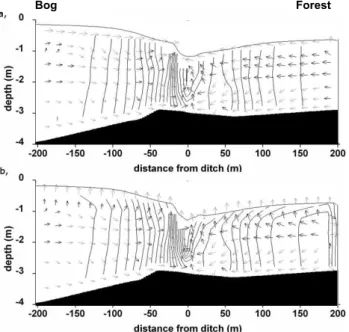
and of 0.056 m for the transient simulation, and Nash– Sutcliffe efficiencies (E2) of 0.994 and 0.972, respectively, confirm the realistic representations. The groundwater levels of the steady-state and the transient simulation were simi-lar, with lower water table positions at the Forest. The simu-lated hydraulic potentials differed between the two types of simulation also because net rainfall was not included in the steady-state simulation. The steady-state simulation (Fig. 5a) suggested slightly discharging hydraulic potentials in the Forest; however, streamlines indicated that the groundwater predominantly moved laterally across the transect in the up-per peat layers, whereas in the deeup-per peat layers movement was slightly downward. At the ditch, groundwater movement was dominated by upwelling.
In the transient simulation (Fig. 5b) the water balance be-tweenP, ET, andI was included, and therefore vertical hy-draulic potentials alternated between recharge and discharge in the Bog, depending on whetherP or ET was the dominant parameter for each stress period. At the Forest discharging hydraulic potentials only changed in magnitude. Dry peri-ods, e.g. stress period 25 (4 September), resulted in flow re-versals with upward-orientated movement in both the Bog and the Forest sites within the upper peat layer. In contrast, in the deeper peat water moved downward and more slowly, with the longest residence times at the Bog and the deepest layers. In agreement with the hydraulic head measurements the model indicated upwelling groundwater under the ditch. The horizontal runoff into the channel, assumed to be four cells (1.08 m) deep, was 4.0 L m−2d−1 from the Bog and 2.2 L m−2d−1from the Forest in the steady-state simulation,
in line with the different ET andI.
3.7 Validation of hydraulic and modelling results
Some artifacts of vertical hydraulic gradients likely locally occurred on the scale of hours to a few days, where layers of very low and highKhwere monitored at individual
piezome-ter nests. The main findings outlined above should not be compromised, given the precaution of manual head measure-ments taken days after the last preceding rainfall, and given the number of sites, where such very strong verticalKh
gra-dients were absent. The occurrence of gradient changes with rainfall and during dry conditions as well as the similar tem-poral response of shallow and deep piezometers (Fig. 3) also suggested that the response time of the piezometers was ad-equate to identify hydraulic gradients several days after rain-fall. A reasonably similar response occurred at the Bog 200 m site with a vertically strongly differing Kh of 4.4×10⁻⁵
and 3.8×10⁻⁷m s−1, and at the Forest 200 m site with a moderately differingKhof 4.5×10⁻⁶and 3.8×10⁻⁷m s−1
(Fig. 3). This conclusion was further supported by a reason-able match between measured and modeled hydraulic heads in the transient simulation.
1
!
Fig. 5.Results of the steady-state simulation(a)and of the transient
simulation(b)represented by the hydraulic conditions on 4
Septem-ber. Note that the simulation domain is bordered by no-flow bound-aries at the west and east end, and at the boundary to the under-lying clay layer. Illustrated is the water table, hydraulic potentials in 0.05 m contours, flow direction (black arrows indicate upward groundwater flow and grey arrows downward flow) and flow veloc-ity (arrow size). Peat depth is vertically exaggerated.
residual sum of squares describes the sensitivity of the model and thus is unitless. This finding suggests that the modelling results were robust with respect to uncertainty in measured and interpolatedKhvalues. There were some exceptions to
this finding near the drainage ditch. A higher residual sum of squares, i.e. higher sensitivity to uncertainty inKh,
oc-curred at the Bog for small multipliers and for big multi-pliers at the Forest. In the uppermost layer at the Bog, in distance from 6 to 24 m from the channel, the residual sum of squares was higher for multipliers of 0.5 to 0.001. They peaked at 12 m from the ditch with a value of 10.31. At the Forest side, cells in this layer and distance were also sensi-tive to variation inKh. Here, the residual sum of squares for
a multiplier of 0.001 reached a maximum of 2.48 at a dis-tance of 15 m. Multiplication of anisotropy had little impact on model performance. The highest residual sum of squares was 1.12 for cells at the Forest side. The uncertainty in our choice of anisotropy, which was not constrained by actual measurements but based on literature values from a nearby site of the Mer Bleue peatland (Fraser et al., 2001), was thus likely of little consequence. The residual sum of squares for recharge increased with increasing multipliers, revealing a more sensitive behavior for recharge of the Forest than of the Bog with values of 55.4 (Forest) compared to 7.5 (Bog) for a
5
!
Fig. 6.Mean chloride concentrations in µmol L−lin the pore water across the transect. Peat depth is vertically exaggerated.
multiplier of 10, and 13507 (Forest) compared to 496 (Bog) for a multiplier of 100.
The observed Cl− concentrations were broadly in agree-ment with the hydraulic head measureagree-ments and ground-water flow modelling results (Fig. 6). Concentration of Cl−
peaked in the marine clay layer at 5900 µmol L−1. Mean Cl−
concentrations at the Bog were generally lower than at the Forest for a given depth. The local minima in Cl− concentra-tions of 100 to 200 µmol L−1near the channel in the Bog pre-dominantly indicated recharge, which is in agreement with hydraulic heads over the analyzed period (Fig. 3) and mod-elling results. In contrast, in the forest and under the chan-nel discharging conditions were indicated by high concentra-tions of up to 1700 µmol L−1at a depth of 0.75 to 1.0 m. The pattern of Cl− concentrations changed little over time, sug-gesting that short-term dynamics in hydraulic gradients had limited influence on the movement of solutes.
4 Discussion
4.1 Hydraulic conductivities
Prior to drainage 90 yr ago vertical profiles of hydraulic con-ductivities in the study area were likely quite uniform, such as described by Fraser et al. (2001) for the northwestern arm of the Mer Bleue peatland. It seems reasonable to make this assumption because water tables and vegetation cover did not vary systematically on both sides of the transect pre-drainage (Fig. 2 and Talbot et al., 2010). In the study by Fraser et al. (2001), which covered a transect from a beaver pond to the central peatland dome at 3 km from our site, values of Kh differed little horizontally and generally
de-creased from 10−3to 10−7m s−1in the acrotelm to 10−6to
10−8m s−1in the catotelm. In our study, the decrease inK h
with depth at the Bog was similar to measuredKhchanges
reported there and in other studies (Fraser et al., 2001; Beck-with et al., 2003; Baird et al., 2008; Quinton et al., 2008; Rosa and Larocque, 2008). The vertical distribution of the Khestimates at the Forest, however, strongly deviated from
the reported pattern. Values ofKhwere significantly lower
has thus been linked to the decomposition of fibric litter into a macroscopically amorphous peat. Drainage accelerates this process; Silins and Rothwell (1998) found an increase in peat bulk density after drainage and subsidence associated with a collapse of macropores (>600 µm), and an increase in mi-cropores (3–30 µm). We thus attribute the lower hydraulic conductivity in shallow peat of the Forest to deeper water ta-bles post-drainage, as observed by us (Fig. 3), and the subse-quent consolidation, compression and decomposition of peat (Kennedy and Price, 2005). Our findings corroborate simi-lar reports about saturated hydraulic conductivity differences between drained and undrained peat (Silins and Rothwell, 1998; Price et al., 2003; Kennedy and Price, 2004; Whitting-ton and Price, 2006; Strack et al., 2008).
Saturated hydraulic conductivities are also in agreement with a previous study addressing peat decomposition and humification along the transect (Blodau and Siems, 2010). A strongly lowered decomposability and advanced humifi-cation, as indicated by accumulation of aromatic and car-boxylic groups, was found down to about 1.5 m peat depth near the drainage ditch, and particularly at one location in the Forest. Changes in plant litter quality with tree growth may also have influenced this pattern (Silins and Rothwell, 1998; Laiho, 2006).
Deeper into the peat, differences in hydraulic conductiv-ity reversed and the explanation given above does not apply. At depths of 1 m (p=0.0295) and 2 m (not significant), sat-urated hydraulic conductivity was higher under forest than at the corresponding Bog sites (Tables 2 and 3). It is plau-sible, albeit speculative, that the phenomenon reflects a dual porosity established with tree root growth in strongly decom-posed peats (Ours et al., 1997). The development of such a dual porosity may have occurred initially after drainage, but before land surface subsidence and water table rebound rela-tive to the subsiding peatland surface restricted the growth of birch, larch and spruce roots deeper into the then again water saturated peat.
A few critical points with regard to hydraulic conduc-tivities and hydraulic parameters in groundwater modelling should be mentioned. First, hydraulic conductivity in peat-lands can also reflect gas-filled porosity and bubbles occlud-ing peat pores (Fraser et al., 2001; Baird et al., 2008). To as-sess the importance of this gas-filled porosity along the tran-sect is thus important. A gas phase forms when the total gas pressure exceeds the confining hydrostatic pressure initially at CH4partial pressures above ca. 0.2 atm, equivalent to ca.
390 µmol L−1(at 8◦C). With continuous stripping of
nitro-gen by ebullition of CH4, higher partial pressures of CH4
are required for bubble formation and release (Fechner-Levy and Hemond, 1996). In a previous investigation we found CH4concentrations down to peat depths of 2 m to be lower
than the above mentioned threshold values at 200 m, 60 and 30 m in the Bog and 60 m in the Forest (Blodau and Siems, 2010). This finding suggests a limited or lacking contribution of bubbles to hydraulic conductivity differences at our site.
Other than the effect of gas bubbles, Kh estimates
ob-tained by piezometer slug tests can be compromised by peat compression during insertion of the piezometers (Surridge et al., 2005; Whittington and Price, 2006). In a similar study Rosa and Larocque (2008) found slug tests to be repro-ducible, suggesting that a differential alteration of hydraulic properties by this approach at different sites is not very likely. Because we were interested in finding relative differences inKh between Bog and Forest, we hence consider the
sin-gle piezometer slug test method adequate for our purpose. Additional uncertainty arises from our choice of anisotropy (Kh/Kv: 450) in the model. Anisotropy in peat has been
re-ported to be heterogeneous (Beckwith et al., 2003; Surridge et al., 2005; Rosa and Larocque, 2008) and possibly differed in peat at the Bog and Forest side, owing to the differing de-gree of decomposition and rooting of shrubs and trees. On the other hand, the sensitivity analysis of anisotropy showed little reaction of model behavior to changes in individual cell anisotropy values, which increases confidence in the mod-elled hydraulic heads and resulting groundwater flow pat-terns.
4.2 Groundwater flow patterns
Groundwater flow patterns are controlled by hydraulic con-ductivities, storage capacity of the peat (Fraser et al., 2001; Reeve et al., 2006) and hydraulic gradients driven byP, ET andI. InterceptionI accounted for 20 % and 32 % ofP in studies of forested peatlands (Price et al., 2003; Emili and Price, 2006). Vertical flow reversals from recharge to dis-charge have received particular attention. Waddington and Roulet (1997) suggested that such flow reversals are driven by internal mechanisms following ET increase and lower wa-ter tables. Also from the northweswa-tern arm of the Mer Bleue peatland flow reversals were reported (Fraser et al., 2001) when ET exceeded P in summer (Fraser et al., 2001). In other peatlands Reeve et al. (2006), Devito et al. (1997) and Fraser et al. (2001) found vertical hydraulic reversals to be driven by groundwater recharge and changes in ET.
line with previous work (Price et al., 2003; Heijmans et al., 2004; Lafleur et al., 2005; Beheim, 2006; Bond-Lamberty et al., 2009) (Fig. 3). Flow direction only reversed in the be-ginning of October and during rainfall events to recharge (Fig. 3). These patterns are supported by the chloride con-centrations (Fig. 6), which indicate discharge at the Forest and under the channel, and increased recharge near the chan-nel compared to the Bog sites that were farther away. Chlo-ride concentration patterns were similar to those determined by Blodau and Siems (2010) two years earlier, suggesting a consistent average flow pattern over long periods of time. Drainage and evolving tree cover have thus distinctly altered the groundwater flow patterns.
An interesting aspect was the effect of increased hydraulic conductivity on groundwater flow at depths>1 m under the Forest area. Due to the inversion of theKhprofile the
ground-water flow through the Forest catotelm was relatively more significant (Tables 2 and 3). Modelled flow velocities in the catotelm, here operationally defined by peat depth>0.55 m, were also higher than in the Bog (Fig. 5a, b), likely with consequences for DIC and DOC export. In pristine bogs the catotelm often has been assumed to be of limited importance for groundwater movement (Siegel and Glaser, 1987; Baird et al., 2008), especially when underlain by sediments of low Kh(Reeve et al., 2000). It has been considered to primarily
dampen groundwater dynamics in the hydrological system (Siegel and Glaser, 2006). According to our results, severe drainage involving invasion of trees may alter this role to some extent.
4.3 Ecohydrological response to drying
One of our intentions was to study long-term drainage as an analogue to drier conditions that may occur in some peatland-rich areas of Canada in the future (Tarnocai, 2006). Summers in Ontario are predicted to sustain current, slightly higher or lower (±10 %), precipitation depending on region and model, towards the mid-century and beyond (Plummer et al., 2006; IPCC, 2007). Steady summer precipitation levels should still lead to decreased soil moisture and runoff dur-ing the growdur-ing season due to substantial increases in evap-otranspiration with rising air temperature. The significance of this effect has, for example, been shown on the watershed scale in the Experimental Lakes Area in Northwestern On-tario (Schindler, 1997). However, it should be noted that the analogue is of somewhat limited applicability as climatic ef-fects on the water balance will be spatially more homogenous and temporally more complex than induced by unidirectional drainage. Based on our study, little can thus be said about the effect of lower precipitation and water tables in the inte-rior of peatlands. It should further be noted that many of the continental peatlands that may be more strongly affected by drying than those located in Ontario, such as systems north of the Canadian prairies, are also already treed today (Glaser and Janssens, 1986; Vitt et al., 1994). This finding limits an
extrapolation of our results to those sites. Nevertheless, some insight can be gained about how vegetation and hydrologic structures and processes reacted locally and what processes occurred that need further attention.
Long-term drainage entailed a complex ecohydrological response at the Mer Bleue peatland that differed between the small eastern and the large western peatland area. Where the water table decline was strongest, near the ditch and in the now forested, small eastern area, drainage triggered the es-tablishment and growth of vascular plants. Our interpreta-tion is supported by the disparateLarix laricinaandBetula
ssp. pollen records from the Bog and Forest sites of the tran-sect (Fig. 2). The spread of trees is further in agreement with the reconstructed water tables before and after drainage that shows that the now forested area became drier in compari-son (Fig. 2). We also observed this pattern in our hydrolog-ical measurements. Enhanced tree growth with drainage is further in agreement with observations from other sites in previous studies (Pellerin et al., 2008). Some of the vege-tation change began soon after drainage according to addi-tional pollen analyses that we have reported earlier (Talbot et al., 2010). In contrast, the spread ofLarix laricinaand the in-tensification ofBetulassp. pollen signals occurred later, after 1950.
According to our modelling results, increases in ET andI, and decreases in groundwater recharge occur in the treed area in summer, otherwise the response in hydraulic heads during the measurement period and chloride concentration patterns cannot be explained. This process was potentially aided by the higher hydraulic conductivity in the catotelm. Extrapo-lating this pattern into the past, it is reasonable to assume that the summer discharge conditions already occurred ear-lier in the last century, at least once tree and shrub biomass became close to present levels, which are currently up to an order of magnitude larger than in the open Bog area (Talbot et al., 2010). We further assume that discharge improved con-ditions for vegetation change by supplying nutrients from the deeper groundwater during this period. As we did not carry out nitrate, ammonium, phosphate and metal cation analy-ses over long periods of time, we cannot support this idea by data. Counteracting this chain of change, subsidence and peat decomposition accelerated post-drainage (Blodau and Siems, 2010) and reduced hydraulic conductivity in the surface peat of the eastern forested peatland area and near the drainage ditch.
al., 2010), the difference in ecohydrologic response can only be attributed to the difference in the extent of peatland area west and east of the drainage ditch (Fig. 1). Following this idea, our findings suggest that the margins of larger bogs are more resilient with respect to drier conditions in their drainage networks, for example resulting from warmer and drier climate. Ecosystem stabilization would be effective be-cause of the larger lateral water flux from the main body of the peatland. A further contribution to stabilization is the pro-tection of the bog from water loss by even lower Kh near
drainage channels than have been documented under cur-rent conditions (Baird et al., 2008). Smaller peatlands may be less resilient because the water table drawdown would ex-tend farther and may trigger growth of upland vascular plants (Moore et al., 2002; Laiho, 2006, Talbot et al., 2010). Posi-tive feedbacks may reinforce the changes in vegetation cover and hydrologic processes that were seen at the Forest side of the transect. Although these interpretations are intuitive, they are speculative. Further systematic studies relating long-term drying and ecohydrological functioning across peatlands of different size will be required to substantiate or refute our in-terpretations and to identify potential thresholds upon which vegetation and ecohydrological change occur.
Supplementary material related to this article is
available online at: http://www.hydrol-earth-syst-sci.net/ 17/3485/2013/hess-17-3485-2013-supplement.pdf.
Acknowledgements. We thank D. Fortin and T. R. Moore for logistical support. Field support by M. Reichert and S. Minderlein was greatly appreciated. We acknowledge comments by A. Baird that greatly helped improving this paper and of two anonymous reviewers and editorial improvements by I. van Meerveld. The research was in part funded by the German Ministry of Science and Education (BMBF) grant CAN 08/A06 and German Science Foundation (DFG) grant BL563/14-1 to C. Blodau. B. Kopp was supported by a fellowship of the German Academic Exchange service (DAAD). We would also like to thank the National Capital Commission for permission to sample Mer Bleue for our research and the assistance of the personnel of the NCC Greenbelt land-use office.
Edited by: I. van Meerveld
References
Appleby, P. G. and Oldfield, F.: The calculation of lead-210 dates
assuming a constant rate of supply of unsupported210Pb to the
sediment, Catena, 5, 1–8, 1978.
Baird, A. J., Surridge, B. W. J., and Money, R. P.: An assessment of the piezometer method for measuring the hydraulic
conduc-tivity of aCladium mariscus–Phragmites australisroot mat in
a Norfolk (UK) fen, Hydrol. Process., 18, 275–291, 2004.
Baird, A. J., Eades, P. A., and Surridge, B. W. J.: The hydraulic structure of a raised bog and its implications for ecohydrolog-ical modelling of bog development, Ecohydrology 1, 289–298, doi:10.1002/eco.33, 2008.
Beckwith, C. W., Baird, A. J., and Heathwaite, A. L.: Anisotropy and depth-related heterogeneity of hydraulic conductivity in a bog peat. I: laboratory measurements, Hydrol. Process., 17, 89– 101, doi:10.1002/hyp.1116, 2003.
Beer, J., Lee, K., Whiticar, M., and Blodau, C.: Geochemical con-trols on anaerobic organic matter decomposition in a northern peatland, Limnol. Oceanogr., 53, 1393–1407, 2008.
Beheim, E.: The effect of peat land drainage and afforestation on runoff dynamics: Consequences on floods in the Glomma River, Environmental Role of Wetlands in Headwaters, 63, 59– 75, doi:10.1007/1-4020-4228-0, 2006.
Belyea, L. R. and Malmer, N.: Carbon sequestration in peat-land: patterns and mechanisms of response to climate change, Glob. Change Biol., 10, 1043–1052, doi:10.1111/j.1529-8817.2003.00783.x, 2004.
Blodau, C. and Siems, M.: Impact of a century of drainage on hydrogeochemical processes in peats of the Mer Bleue Bog, Canada, Biogeochemistry, 107, 107–123, doi:10.1007/s10533-010-9535-1, 2010.
Blodau, C., Roehm, C. L. and Moore, T. R.: Iron, sulfur, and dis-solved carbon dynamics in a northern peatland, Arch. Hydro-biol., 154, 561–583, 2002.
Bond-Lamberty, B., Peckham, S. D., Gower, S. T., and Ewers, B. E.: Effects of fire on regional evapotranspiration in the cen-tral Canadian boreal forest, Glob. Change Biol., 15, 1242–1254, doi:10.1111/j.1365-2486.2008.01776.x, 2009.
Booth, R.: Testate amoebae as proxies for mean annual water-table
depth inSphagnum-dominated peatlands of North America, J.
Quat. Sci., 23, 43–57, 2007.
Bubier, J. L., Moore, T. R., and Bledzki, L. A.: Effects of nutrient addition on vegetation and carbon cycling in an ombrotrophic bog, Glob. Change Biol., 13, 1168–1186, doi:10.1111/j.1365-2486.2007.01346.x, 2007.
Devito, K. J., Waddington, J. M., and Branfireun, B. A.: Flow reversals in peatlands influenced by local groundwater sys-tems, Hydrol. Process., 11, 103–110,
doi:10.1002/(SICI)1099-1085(199701)11:1<103::AID-HYP417>3.0.CO;2-E, 1997.
Drexler, J. Z., Bedrod, B. L., Scognamiglio, R., and Siegel, D. I.: Fine-scale characteristics of groundwater flow in a peat-land, Hydrol. Process., 13, 1341–1359,
doi:10.1002/(SICI)1099-1085(19990630)13:9<1341::AID-HYP810>3.0.CO;2-5, 1999.
Emili, L. A. and Price, J. S.: Hydrological processes con-trolling ground and surface water flow from a hypermar-itime forest-peatland complex, Diana Lake Provincial Park, British Columbia, Canada, Hydrol. Process., 20, 2819–2837, doi:10.1002/hyp.6077, 2006.
Environment Canada: Canadian Climate Normals 1971–2000, available at: http://climate.weather.gc.ca/climate normals (last access: September 2013), 2004.
Fechner-Levy, E. J. and Hemond, H. F.: Trapped methane volume and potential effects on methane ebullition in a northern peatland, Limnol. Oceanogr., 41, 1375–1383, 1996.
Glaser, P. H. and Janssens, J. A.: Raised bogs in Eastern North America – Transitions in landforms and gross stratigraphy, Can. J. Bot., 64, 395–415, 1986.
Glaser, P. H., Janssens, J. A., and Siegel, D. I.: The response of veg-etation to chemical and hydrological gradients in the Lost River peatland, Northern Minnesota, J. Ecol., 78, 1021–1048, 1990. Gorham, E.: Northern peatlands – role in the carbon cycle and
prob-able responses to climatic warming, Ecol. Appl., 1, 182–195, doi:10.2307/1941811, 1991.
Heijmans, M. M. P. D., Arp, W. J., and Chapin, F. S.: Controls on moss evaporation in a boreal black spruce forest, Global Bio-geochem. Cy., 18, GB2004, doi:10.1029/2003GB002128, 2004. Heitmann, T., Goldhammer, T., Beer, J., and Blodau, C.: Electron transfer of dissolved organic matter and its potential significance for anaerobic respiration in a northern bog, Global Change Biol., 13, 1771–1785, doi:10.1111/j.1365-2486.2007.01382.x, 2007. Hvorslev, M. J.: Time lag and soil permeability in groundwater
observations, U.S. Army Corps Engineers Waterways Exp. Stn, Bull. 36, Vicksburg, Mississippi, 50 pp., 1951.
IPCC: The physical Science Basis. Contribution of Working Group I to the Fourth Assessment Report of the Intergovernmental Panel on Climate Change, Cambridge University Press, Cambridge, United Kingdom and New York, NY, USA, 887 pp., 2007. Kennedy, G. W. and Price, J. S.: Simulating soil water
dy-namics in a cutover bog, Water Res. Res., 40, W12410, doi:10.1029/2004WR003099, 2004.
Kennedy, G. W. and Price, J. S.: A conceptual model of volume-change controls on the hydrology of cutover peats, J. Hydrol., 302, 13–27, doi:10.1016/j.jhydrol.2004.06.024, 2005.
Lafleur, P. M., Hember, R. A., Admiral, S. W., and Roulet, N. T.: Annual and seasonal variability in evapotranspiration and water table at a shrub-covered bog in southern Ontario, Canada, Hy-drol. Process., 19, 3533–3550, doi:10.1002/hyp.5842, 2005. Laiho, R.: Decomposition in peatlands: Reconciling seemingly
con-trasting results on the impacts of lowered water levels, Soil Biol. Biochem., 38, 2011–2024, doi:10.1016/j.soilbio.2006.02.017, 2006.
Moore, T. R., Bubier, J. L., Frolking, S. E., Lafleur, P. M.,
and Roulet, N. T.: Plant biomass and production and CO2
exchange in an ombrotrophic bog, J. Ecol., 90, 25–36, doi:10.1016/j.soilbio.2006.02.017, 2002.
Ours, D. P., Siegel, D. I., and Glaser, P. H.: Chemical dilution and the dual porosity of humified bog peat, J. Hydrol., 196, 348–360, doi:10.1016/S0022-1694(96)03247-7, 1997.
Pellerin, S., Mercure, M., Desaulniers, A. S., and Lavoie, C.: Changes in plant communities over three decades on two dis-turbed bogs in southeastern Qu´ebec, Appl. Veg. Sci., 12, 107– 118, doi:10.1111/j.1654-109X.2009.01008.x, 2008.
Plummer, D. A., Caya, D., Frigon, A., Cˆot´e, H., Gigu`ere, M., Paquin, D., Biner, S., Hervey, R., and de Elia, R.: Climate and climate change over North America as simulated by the Cana-dian RCM, J. Climate, 19, 3112–31132, 2006.
Price, J. S., Heathwaite, A. L., and Baird, A. J.: Hydrological processes in abandoned and restored peatlands: An overview of management approaches, Wet. Ecol. Manag., 11, 65–83, doi:10.1023/A:1022046409485, 2003.
Quinton, W. L., Hayashi, M., and Carey, S. K.: Peat hydraulic con-ductivity in cold regions and its relation to pore size and ge-ometry, Hydrol. Process., 22, 2829–2837, doi:10.1002/hyp.7027,
2008.
Reeve, A. S., Siegel, D., and Glaser, P. H.: Simulating vertical flow in large peatlands, J. Hydrol., 227, 207–217, doi:10.1016/S0022-1694(99)00183-3, 2000.
Reeve, A. S., Evensen, R., Glaser, P. H., Siegel, D. I., and Rosen-berry, D.: Flow path oscillations in transient ground-water sim-ulations of large peatland systems, J. Hydrol., 316, 313–324, doi:10.1016/j.jhydrol.2005.05.005, 2006.
Rosa, E. and Larocque, M.: Investing peat hydraulic properties us-ing field and laboratory methods: application to the Lanoraie peatland complex (southern Quebec, Canada), Hydrol. Process., 22, 1866–1875, doi:10.1002/hyp.6771, 2008.
Roulet, N. T, Lafleur, P. M., Richard, P. J. H., Moore, T. R., Humphreys, E. R., and Bubier, J.: Contemporary carbon bal-ance and late holocene carbon accumulation in a northern peat-land, Global Change Biol., 13, 397–411, doi:10.1111/j.1365-2486.2006.01292.x, 2007.
Schindler, D. W.: Wide-spread effects of climatic warming on fresh-water ecosystems in North America, Hydrol. Process., 11, 1043– 1067, 1997.
Siegel, D. I.: Groundwater hydrology, in: Patterned Peatlands of Minnesota, edited by: Wright Jr., H. E., Coffin, B., and Aaseng, N., University of Minnesota Press, St. Paul, 163–173, 1993. Siegel, D. I. and Glaser, P.: Groundwater flow in a bog-fen complex,
lost river peatland, Northern Minnesota, J. Ecol., 75, 743–754, 1987.
Siegel, D. I. and Glaser, P.: The hydrology of peatlands, Ecol. Stud-ies, 188, 289–311, doi:10.1007/978-3-540-31913-9 13, 2006. Silins, U. and Rothwell, R. L.: Forest peatland drainage and
sub-sidence affect soil water retention and transport properties in an Alberta peatland, Soil Sci. Soc. Am. J., 62, 1048–1056, 1998. Strack, M. and Waddington, J. M.: Response of peatland
car-bon dioxide and methane fluxes to a water table draw-down experiment, Global Biogeochem. Cy., 21, GB1007, doi:10.1029/2006GB002715, 2007.
Strack, M., Waddington, J. M., Bourbonniere, R. A., Buckton, E. L., Shaw, K., Whittington, P., and Price, J. S.: Effect of water table drawdown on peatland dissolved organic carbon export and dy-namics, Hydrol. Process., 22, 3373–3385, doi:10.1002/hyp.6931, 2008.
Surridge, B. W., Baird, A. J., and Heathwaite, A. L.: Eval-uating the quality of hydraulic conductivity estimates from piezometer slug tests in peat, Hydrol. Process., 19, 1227–1244, doi:10.1002/hyp.5653, 2005.
Talbot, J.: Drainage as a model for long-term climate change effect on vegetation dynamics and carbon cycling in boreal peatlands, Ph.D. thesis, 148 pp., McGill University, Montreal, Canada, 2009.
Talbot, J., Richard, P. J. H, Roulet, N. T., and Booth, R.: Assessing long-term hydrological and ecological responses to drainage in a raised bog using paleoecology and a hydrosequence, J. Veg. Sci., 21, 143–156, doi:10.1111/j.1654-1103.2009.01128.x, 2010. Tarnocai, C.: The effect of climate change on carbon in Canadian
peatlands, Gobal Planet. Change, 53, 222–232, 2006.
Vitt, D. H., Halsey, L. A., and Zoltai, S. C.: The Bog landforms of continental Western Canada in relation to climate and permafrost patterns, Arctic Alp. Res., 26, 1–13, 1994.
122–138, doi:10.1016/S0022-1694(96)03075-2, 1997.
Weiss, R., Alm, J., Laiho, R., and Laine, J.: Modeling moisture retention in peat soils, Soil Sci. Soc. Am. J., 62, 305–313, doi:10.2136/sssaj1998.03615995006200020002x, 1998. Whittington, P. N. and Price, J. S.: The effects of water table
draw-down (as a surrogate for climate change) on the hydrology of a patterned fen peatland near Quebec City, Quebec, Hydrol. Pro-cess., 20, 3589–3600, doi:10.1002/hyp.6376, 2006.