JUSCIMAR DA SILVA
EFFECTIVENESS AND STABILITY OF ALUMINIUM AND IRON
OXIDES NANOPARTICLES FOR ARSENATE ADSORPTION
Tese apresentada à Universidade Federal de Viçosa, como parte das exigências do Programa de Pós-Graduação em Solos e Nutrição de Plantas, para obtenção do título de Doctor Scientiae.
VIÇOSA
Aos meus pais, Amado e Maria, e à minha avó,
Fabiana, pela educação e pelo amor.
À Ângela minha esposa, pelos momentos de
companheirismo e pela convivência.
Ao Guilherme (in memoriam) e ao nosso
filho(a), que ainda está para nascer, mas já
é a motivação maior para continuar
trabalhando.
Aos meus irmãos, Rita, Itamar e Gislene, pelo
carinho e pela compreensão.
Aos meus sobrinhos, Gustavo, Isadora, Letícia,
Bruno, Franciele e Gabriel.
“Never regard study as a duty, but as an
enviable opportunity to learn to know the
liberating influence of beauty in the realm
of the spirit for your own joy and the profit
of the community to which your later work
belongs.”
AGRADECIMENTOS
A Deus, pela vida e pela paz, nos momentos de dificuldade, pela calma na hora de decidir o que é certo ou errado e pela sabedoria, nas tomadas de decisões.
A minha esposa Ângela, pela constante companhia, carinho e incondicional dedicação.
À Universidade Federal de Viçosa, especialmente ao Departamento de Solos, pela oportunidade de realização do curso.
Ao CNPq, pela concessão da bolsas de Doutorado e Doutorado “Sandwich”. À FAPEMIG pelo financiamento da pesquisa.
Aos professores Jaime Wilson Vargas de Mello e Walter Antônio Pereira Abrahão, pela amizade, experiência e ensinamentos compartilhados, pela colaboração e pelos incentivos em diversas etapas, desde a iniciação científica até o curso de Pós-Graduação.
Aos professores Massimo Gasparon e Paulo Vasconcelos da The University of Queensland, Austrália, pela amizade e experiência compartilhada, bem como pela recepção incondicional e utilização das dependências do Earth Science Department que proporcionaram o bom desenvolvimento de grande parte deste trabalho.
À professora Virgínia Ciminelli e suas colaboradoras Cláudia Lima Caldeira, Maria Sylvia Silva Dantas (Sica) e demais funcionários e alunos do Departamento de Engenharia Metalúrgica e Materiais da Universidade Federal de Minas Gerais, pelo auxílio, pela orientação e pelas trocas de experiência durante as análises de Espectroscopia Raman.
Ao professor Victor Hugo Alvarez Venegas, pelo apoio, pelos ensinamentos e pelo exemplo de pessoa e profissionalismo.
Aos demais professores, colegas de curso e a todos os funcionários do Departamento de Solos, pela convivência, pelas críticas, pela colaboração e amizade.
A todos os amigos, de longa e de recente data, em especial ao Geraldo Robésio, Ítalo, Augusto, Mattiello, Maurão, Nilton, Cristiane Assis, Diego, Elton Valente, Pacheco, dentre tantos outros, pelo convívio e pela amizade.
Aos grandes amigos de Brisbane, Autrália, que fizeram mais fácil a adaptação e vida no exterior: Marinho (verdadeiro irmão que tomou conta de mim e minha esposa), Arne, Auk, Guia, Maurizio, Jia Jia, Ben, Felipe, Maria D’aguia, Fiona, Tony Jong, Frank, Peter, Emma, Ai e Eric.
BIOGRAFIA
JUSCIMAR DA SILVA, filho de Amado Francisco da Silva e Maria da Conceição Silva, nasceu em 4 de agosto de 1977, em Viçosa, Minas Gerias, Brasil.
Em maio de 2002, graduou-se em Agronomia, pela Universidade Federal de Viçosa e, em abril do mesmo ano, iniciou, nesta mesma instituição, o Programa de Pós-Graduação, em nível de Mestrado, em Solos e Nutrição de Plantas.
Em março de 2004, iniciou o Programa de Pós-Graduação, em nível de Doutorado, em Solos e Nutrição de Plantas, na Universidade Federal de Viçosa. De agosto de 2006 a agosto de 2007, participou do Programa Doutorado “Sandwich” do CNPq, onde efetuou trabalhos da presente Tese no Earth Science Department da The University of Queensland, Australia.
CONTENT
Page
TABLE LIST ... ix
FIGURE LIST ... ix
RESUMO ... xii
ABSTRACT ... xv
INTRODUCTION ... xviii
CHAPTER 1 ... RAMAN SPECTROSCOPY OF As(V) LOADED Al AND Fe (HYDR)OXIDES ... 1
ABSTRACT ... 1
1. INTRODUCTION ... 2
2. MATERIAL AND METHODS ... 4
2.1. Synthesis of Al and Fe (Hydr)oxides ... 4
2.1.1. Iron (hydr)oxides synthesis ... 4
2.1.2. Aluminium hydroxides synthesis ... 4
2.2. Characterisation analyses ... 4
2.3. As(V) loaded (hydr)oxides ... 5
2.4. X-ray diffraction (XRD) and diffuse reflectance (DR) ... 5
2.5. Raman spectroscopy ... 6
3. RESULTS AND DISCUSSION ... 7
3.1. Characterisation analyses ... 7
3.2. XRD spectra ... 9
3.3. DR spectra ... 9
3.4. Raman spectroscopy ... 12
3.4.1. Raman spectra for Gb and poorly crystalline Al(OH)3 ... 12
3.4.2. Raman spectra for Hm and Fh ... 15
3.4.3. Raman spectra for Gt and Al-substituted goethites ... 16
3.4.4. Raman spectra for Magnetite and phase transformation ... 18
5. REFERENCE ... 22
CHAPTER 2 ... ARSENIC ADSORPTION ONTO ALUMINIUM AND IRON (HYDR)OXIDES: KINETICS, ISOTHERM AND ENVELOPE OF ADSORPTION ... 27 ABSTRACT ... 27
1. INTRODUCTION ... 28
2. MATERIAL AND METHODS ... 30
2.1. Adsorbents ... 30
2.2. Adsorption isotherms ... 30
2.3. As(V) adsorption kinetics ... 31
2.4. As(V) adsorption envelopes ... 32
2.5. Arsenic analyses ... 32
3. RESULTS AND DISCUSSION ... 32
3.1. Adsorption isotherms ... 32
3.2. As(V) adsorption kinetics ... 36
3.3. As(V) adsorption envelopes ... 39
4. CONCLUSIONS ... 40
5. REFERENCE ... 42
CHAPTER 3 ... EFFECT OF BACTERIAL IRON REDUCTION AND COMPETING ION ON ARSENIC MOBILISATION ... 48
ABSTRACT ... 48
1. INTRODUCTION ... 49
2. MATERIAL AND METHODS ... 51
2.1. Synthesis of Al and Fe (Hydr)oxides ... 51
2.2. As(V) loaded adsorbents ... 52
2.3. Bacterial culture and growth medium ... 52
2.4. Incubation experiments ... 53
2.4.1. Dissimilatory Fe(III) reduction ... 53
2.4.2. Influence of competing anions ... 54
2.5. Analytical Techniques ... 54
3. RESULTS AND DISCUSSION ... 54
3.1. Reduction of Fe(III) and arsenic release ... 54
3.3. Influence of carbonate as competing anion ... 64
4. ENVIRONMENTAL IMPLICATION ... 67
5. REFERENCE ... 70
OUTLLOK AND CONCLUSIONS ... 75
REFERENCE ... 76
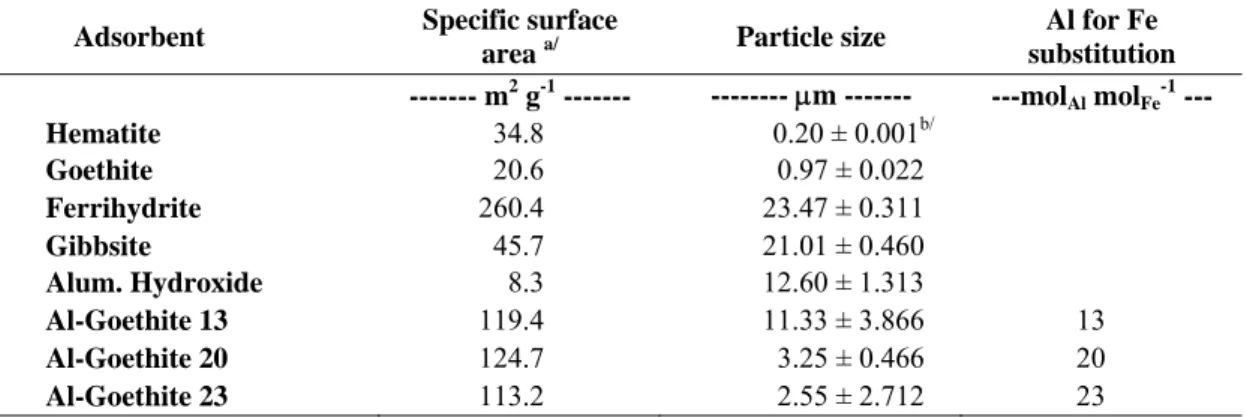
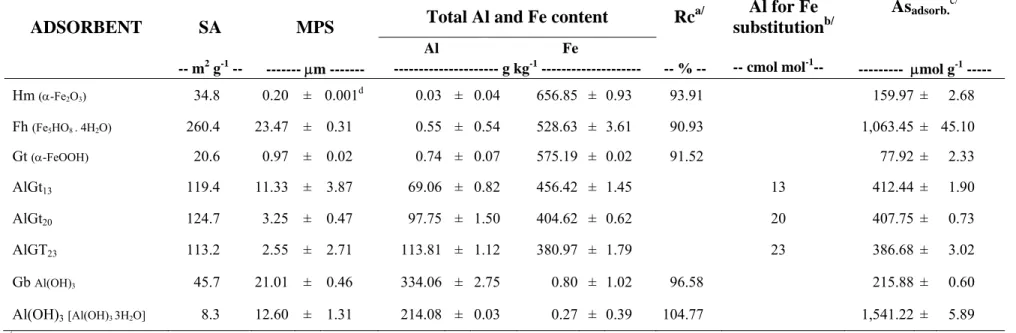
TABLE LIST Page CHAPTER 1 1 Surface area (SA), mean particle size (MPS), content of Al and Fe, recovered (Rc), degree of Al substitution in the goethites, and adsorbed As(V). Data are represented as means ± standard error of the mean (n=3) ... 8 CHAPTER 2 1 Specific surface area, mean particle size, and maximum As(V) adsorption capacity of the adsorbent materials ... 31
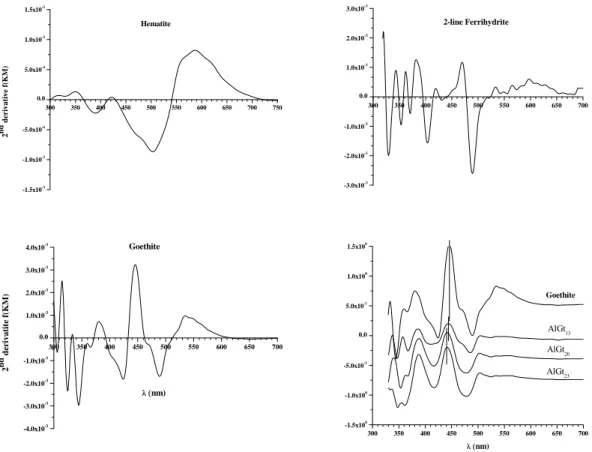
3 Diffuse reflectance spectra of unsubstituted and substituted goethites
in the near ultra violet-visible-near infra-red regions ... 12
4
Raman spectra of gibbsite (Gb) and aluminium hydroxide [Al(OH)3]
with and without As(V). a, Gb and Al(OH)3 spectra in the 150 – 1050
region; b, Gb and Al(OH)3 spectra in the 3000 – 3800 region. Inset in
panel a represents the remaining band after subtraction of the Raman spectrum of Gb with and without As loaded ...
13
5
Raman spectra of hematite (Hm) and 2-line ferrihydrite (Fh) with and without As(V). The symbol * indicates residual bands of the reagent (NO3-) used in the synthesis. Inset in the panel represents the
remaining band after subtraction of the Raman spectrum of Hm with and without As loaded ...
16
6
Raman spectra of goethite and Al-substituted goethites (AlGt13,
AlGt20, and AlGt23) with and without As(V). The symbol * indicates
residual bands of the reagent (NO3-) used in the synthesis. ...
17
7
Raman spectra of magnetite before and after thermal treatment. Pure hematite spectrum was plotted in order to compare with heated magnetite spectrum ...
19
CHAPTER 2
1
Adsorption isotherm for synthetic Al and Fe (hydr)oxides. Solid line represents theoretical Langmuir model (Asads = K*b*Aseq/1+K*Aseq)
where Asads is the maximum of adsorbed arsenate by the sorbent
(mmol g-1), K is the constant related to the energy of adsorption (L mmol-1), b is the arsenate adsorption maximum (mmol g-1), and Aseq
is the equilibrium concentration of As(V) remaining in the solution (mmol L-1). Data are represented as means ± standard error of the mean (n = 3); bars not visible are smaller than symbol ...
33
2
Arsenate adsorption onto different Al and Fe (hydr)oxides normalized by specific surface area. Data are represented as means ± standard error of the mean (n = 3); bars not visible are smaller than symbol ...
37
3
As(V) adsorption kinetics by Al and Fe (hydr)oxides in a 2 g L-1 (a) and 5 g L-1 (b) suspension at pH 5.0 ±0.2. Data are represented as means ± standard error of the mean (n = 3); bars not visible are smaller than symbol ...
38
4
Adsorption envelope for the reaction of arsenate with hematite, goethite, ferrihydrite, Al-substituted goethites, gibbsite, and aluminium hydroxides. Data are represented as means ± standard error of the mean (n = 3); bars not visible are smaller than symbol ...
CHAPTER 3
1
Fe(III) reduction and As mobilisation from different Fe (hydr)oxides incubated with S. putrefaciens. Data are represented as means ± standard error of the mean (n=3); bars not visible are smaller than symbol ...
56
2
Reduction of Fe(III) and mobilisation of arsenic from different Fe (hydr)oxides. a, relationship between the fraction of mobilised As and Fe release; b, relationship between the fraction of mobilised As and the fraction of Fe reduced; and c, the fraction of mobilised As and reduced Fe from Gt (●, ○), Hm (d, V), AlGt23 (, ), AlGt20 (▲, U), AlGt13 ( , ), and Fh (◊, ♦) plotted against specific surface area. Data are represented as means ± standard error of the mean (n = 3); bars not visible are smaller than symbol ...
59
3
Fe(III) reduction, As release, and P immobilisation from different Al and Fe suspension in the presence of S. putrefaciens. Inset in each panel represents the experiments without adsorbed arsenic. Data are represented as means ± standard error of the mean (n = 3); bars not visible are smaller than symbol ...
60
4
Fe(III) reduction and P immobilisation from different Al and Fe suspension in the presence of S. putrefaciens. Data are represented as means ± standard error of the mean (n = 3); bars not visible are smaller than symbol ...
65
5
Fraction of arsenic desorbed and Fe(III) reduced from different adsorbents by carbonate in the presence of S. putraciens cells. a, fraction of As mobilised in the presence of bacteria; b, fraction of As mobilised in the absence of bacteria, and; c. fraction of Fe dissolved by S. putraciens cells ...
RESUMO
SILVA, Juscimar, D.Sc., Universidade Federal de Viçosa, Junho de 2008. Eficiência e estabilidade de nanopartículas de óxidos de alumínio e de ferro para adsorver
arsênio. Orientador: Jaime Wilson Vargas de Mello. Co-orientadores: Walter
Antônio Pereira Abrahão e Virgínia Sampaio Teixeira Ciminelli.
A geoquímica do arsênio e do ferro estão intimamente correlacionadas, de modo que os métodos de remoção de As da água são baseados na alta afinidade deste metalóide por nanominerias de oxihidróxidos de ferro. No entanto, em ambientes anóxicos as bactérias redutoras de ferro desempenham papel crucial na catálise de transformações redox que, em última análise, controlam a mobilidade do As em ambientes aquáticos. Nanominerias de Al são comuns em solos e sedimentos e também apresentam grande afinidade por As. Além disso, sob condições redutoras, o Al é estável e sua presença na estrutura dos oxihidróxidos de Fe aumenta a establidade destes oxidos, conforme bem documentado na literatura. Desta maneira, a associação da alta afinidade dos oxihidróxidos de Fe por As com a estabilidade do Al sob condições anóxicas pode ser uma alternativa vantajosa para a remoção de As da água. Neste estudo, a espectroscopia Raman foi utilizada para investigar a influência do alumínio estrutural nos modos vibracionais de goethitas e das fases formadas entre arsenato e os diferentes oxihidróxidos de Al e Fe, bem como o potencial destes nanominerais para adsorção de As. A estabilidade do As retido por oxihidróxidos de Al e Fe sob condições anóxicas, na presença da bacteria Shevanella putrefaciens e anions competidores, fosfato ou carbonato, também foi investigada. Hidróxido de Al de baixa cristalinidade [Al(OH)3], gibisita (Gb), ferrihidrita 2 linhas (Fh), hematita (Hm), goethita (Gt) e três
arsenato foram caracterizados por difração de raios-X, reflectâcia difusa e espectroscopia Raman. A cinética de adsorção em duas diferentes relações solido:solução, 2,0 e 5,0 g L-1, e as isotermas de adsorção foram obtidas após equilibrar as amostras com soluções de arsenato sob agitação constante. A adsorção máxima de As(V) foi medida em diferentes valores de pH, variando de 3 até 9. Os adsorventes foram incubados anaerobicamente, sob atmosfera de N2, e os sobrenadantes foram
periodicamente amostrados para avaliar as concentrações de As solúvel. A presença de alumínio estrutural aumentou a área superficial específica e a capacidade de adsorção de As da goethita. Os efeitos gerais da presença do Al estrutural foram diminuir a cristalinidade e deslocar as linhas espectrais da goethita. Tal desordem estrutural foi claramente identificada por espectroscopia Raman e difração de raios-X. As alterações nas frequências vibracionais e largura de bandas devido ao Al estrutural resultou em perdas e sobreposição de muitas bandas ativas da goethita. Esses efeitos aumentaram com o grau de substituição. A técnica Raman também confirmou a ocorrência de magnetita na amostra de goethita com menor grau de substituição, conforme identificado por difração de raios-X. Bandas vibracionais da ligações As-O foram observadas em todos os espectros Raman, exceto para goethita não substituída, provavelmente devido ao seu menor carregamento de As. As posições das bandas vibracionais As-O sugerem que o As(V) foi fortemente retido na superfície dos minerais como complexos de esfera interna. A despeito do rápido equilíbrio, a aumento na concentração de sólido, limitou a eficiência e a velocidade da adsorção de As. A adsorção máxima de As(V) diminuiu na seguinte ordem: Al(OH)3 > Fh > AlGt13 >
AlGt20 > AlGt23 > Gb > Hm > Gt. No entanto, calculando as capacidades de adsorção por
foram capazes de se ligar nas superficies minerais e utilizar os oxihidróxidos de Fe, tanto cristalinos quanto mal cristalisados, como aceptores finais de elétrons, mobilizando arsenio em solução. Goethitas substituidas por Al apresentaram decrescimo na fração de ferro solúvel e As mobilizado com o aumento do Al estrutural. A relação entre área surperficial específica e dissolução redutiva de Fe e As também foi afetada pelo aumento do Al estrutural, conforme esperado. O fosfato e o carbonato afetaram a cinética de redução do Fe devido à precipitação do ferro em solução como fases minerais metaestáveis (por exemplo vivianita e siderita). Parece que fases minerais análogas de fosfatos serviram como sumidouro para o arsênio, limitando sua mobilização. Fosfato competiu fortemente com o arsenato e sua eficiência parece ter sido governada pela natureza da ligação entre o As e a surperfície adsorvente. Uma maior fração de As foi dessorvido por fosfato na gibbsita, seguida pelas goethitas substituidas por Al. Por outro lado, apenas a gibbsita mostrou quantidades significativas de arsenato deslocado por carbonato. Não obstante a baixa cristalinidade, o Al(OH)3 foi mais eficiente para reter
ABSTRACT
SILVA, Juscimar, D.Sc., Universidade Federal de Viçosa, June 2008. Effectiveness and stability of aluminium and iron oxides nanoparticles for arsenate
adsorption. Adviser: Jaime Wilson Vargas de Mello. Co-advisers: Walter Antônio
Pereira Abrahão and Virgínia Sampaio Teixeira Ciminelli.
The geochemical fates of arsenic and iron are closely correlated that methods of arsenic removal from water are based on the high affinity of this metalloid with Fe (hydr)oxides nanominerals. Nevertheless, in anoxic environment dissimilatory iron reducing bacteria play a fundamental role in catalysing the redox transformations that ultimately control the mobility of As in aquatic environment. Aluminium nanominerals are ubiquitous and also have great affinity for arsenic. Additionally, under reducing conditions, Al is rather stable and its presence in the Fe (hydr)oxides framework enhance their stability, as well reported in the literature. Thus, by associating the higher binding affinity of Fe (hydr)oxides for arsenic and the higher stability of Al under anoxic conditions can be an advantageous alternative for removing arsenic from water. In this study, we investigated the influence of structural Al in the Raman vibrational stretching modes of goethite and arsenate phases formed on its surface and on other Al and Fe (hydr)oxides, as well as their potential in adsorbing arsenic. The stability of arsenic retained by aluminium and iron (hydr)oxides under anoxic conditions in the presence of S. putrefaciens cells, and phosphate or carbonate competing anions was also investigated. Poorly crystalline aluminium hydroxide [Al(OH)3], gibbsite (Gb), 2-line
different solid:solution ratios, 2.0 and 5.0 g L-1, and adsorption isotherms were obtained after equilibrating the samples with arsenate solution under constant shaking. As(V) adsorption maxima was measured at different pH ranging from 3 to 9. The adsorbents were anaerobically incubated under N2 atmosphere and supernatants were periodically
sampled to evaluate the contents of soluble As. Presence of structural Al increased the specific surface area and the As adsorption capacity of the Gt. The general effects of the structural Al were to reduce Gt crystallinity and displace spectral lines. Such structural disorder was clearly identified by Raman spectroscopy and X-Ray diffraction. Changes in vibrational frequencies and linewidths due to structural Al resulted in loss and overlap of many Gt active bands. These effects increased as the degree of substitution increased. Raman technique also confirmed the co-occurrence of magnetite in AlGt13 sample, as
indicated by XRD. As-O vibrational bands were visualised on all Raman spectra, except for pure Gt probably due to its lowest content of adsorbed As(V). Positions of As-O vibrational band suggested that As(V) was strongly retained on the minerals as inner-sphere surface complexes. In spite of the fast equilibrium, the increase in solid concentration limited the efficiency and velocity of arsenic adsorption. The As(V) adsorption maxima decreased in the following order: Al(OH)3 > Fh > AlGt13 > AlGt20 >
AlGt23 > Gb > Hm > Gt. Nevertheless, by calculating adsorption capacities in terms of
affected the kinetics of iron reduction due to precipitation of soluble iron as metastable mineral phases (e.g. vivianite and siderite). It seems that analogous mineral phases of phosphates served as a sink for As limiting its mobilisation. Phosphate competed strongly with arsenate and its efficiency seemed to be governed by the nature of the binding mechanism between As and adsorbent surface. Higher fraction of arsenic was desorbed by phosphate from gibbsite followed by AlGts. Conversely, only Gb showed significant amounts of arsenate displaced by carbonate. In spite of low crystallinity, Al(OH)3 was the most efficient in retaining arsenate on its surface followed by Fh and
INTRODUCTION
Arsenic is a waterborne contaminant and its occurrence in groundwater is a public health concern. The long term exposure to arsenic can lead to critical problems, mainly cancers. Following the recommendation of the World Health Organization (WHO) many countries worldwide, including Brazil, have adopted the threshold of 10 μg L-1 of As in drinking water, as safer for consumption.
Among the heavy metalloids and oxianions-forming elements (e.g. As, Se, Sb, Mo, V, Cr, U, Re), arsenic is perhaps unique to mobilise at the pH values typically found in groundwaters (pH 6.5 – 8.5) and under both oxidising and reducing conditions. The geodistribution of As depends on parental rock, and its global average in soil is about 5 mg kg-1. Mudstones, shales and slates have the highest concentrations among the common rocks, although extremely high concentrations can be found in some coals. As the chemistry of arsenic follows closely that of S, the greatest concentration of the element tend to occur in sulphide minerals, of which arsenopyrite (FeAsS) is the most abundant mineral followed by orpiment (As2S3) and realgar (AsS) (Matschullat, 2000;
Smedley and Kinniburg, 2002; O’Day, 2006). Then, the natural input of arsenic in the environment is closely related to weathering of As-bearing rocks and minerals. Anthropogenic source, i.e. mining and smelting activity and pesticides and wood preservative uses, has also contributed to such addition.
In the environment arsenic can be found as inorganic and organic compounds, in several valence states, i.e. -3, -1, 0, +3, and +5. In natural water arsenic occurs mainly in inorganic forms as trivalent arsenite [As(III)] (as H3AsO3) or pentavalent arsenate
[As(V)] (as H2AsO4- and HAsO42-). In addition, in marine waters and lakes arsenic can
euphotic zone of many oceanic regions. Furthermore, redox potential (Eh) and pH control the toxicity, mobility, and bioavailability of arsenic as well as the distribution of its species. Therefore, arsenite is expected to be the stable aqueous form under moderately reducing conditions, roughly from Eh of about +300 mV at pH 4 to -200 mV at pH 9, whilst arsenate is the dominant species in oxidising aqueous solutions (O’Day, 2006). Because of relatively slow transformation on the redox conditions, both species, As(III) or As(V), can be often found in either redox environment.
Nanominerals of aluminium and iron (hydr)oxides are ubiquitous and play a crucial role on geochemical and biogeochemical reactions and kinetics of arsenic in the environment. Sorption reactions on the surface of these nanoparticles have been extensively investigated in order to elucidate the mechanisms associated with arsenic mobility and bioavailability, as an attempt to improve the methods of water treatment which are still based on coagulation/precipitation processes. Problems with regard to addition of undesirable anions, such as sulphate, nitrate, and chloride into the water are the major limitation of this method as well as the safe separation, handling, and disposal of the contaminated sludge (Driehaus et al., 1998; Banerjee et al., 2008). Several adsorbent materials have been assessed, i.e. aluminium hydroxide (Anderson et al., 1976; Ladeira et al., 2001), activated alumina (Mortazavi et al., 1999), natural (hydr)oxides (Deschamps et al., 2003, 2005; Vithanage et al., 2007), clay minerals (Manning and Goldberg, 1996a, 1997; Garcia-Sanchez et al., 2002), granular ferric hydroxides (Driehaus et al., 1998; Wilkie and Hering, 1996), ferrihydrite (Waychunas et al., 1993; Jain et al., 1999; Jia and Demopoulos, 2005; Jia et al., 2006), goethite (Grossl et al., 1997; Hongshao and Stanford, 2001; Gimenez et al., 2007), and others.
Even though Al and Fe (hydr)oxides have great affinity for arsenic, attention concerning the stability of these nanoparticle should be taken into account. As well known, the solubility of aluminium hydroxides are much higher than of ferric ones. For instance, stability diagrams developed by Lindsay (1979), show that at the same pH activity of Al3+ is roughly 106.12 times higher than the activity of Fe3+, both controlled by their poorly crystalline hydroxide phases, under oxidising conditions. Then, soluble arsenic in equilibrium with Al nanominerals can be a matter of greater concern. On the other hand, changes in redox status affect considerably the stability of the Fe (hydr)oxides nanoparticles.
terminal electron acceptors (Bonneville et al., 2006). In addition to being an important oxidation pathway of organic matter and generating soluble ferrous iron, microbial iron reduction can have a major impact on the persistence and mobility of arsenic, toxic metals, radionuclides, and organic contaminants under anoxic conditions (Lovley et al., 1993; Cummings et al., 1999; Zachara et al., 2001; Behrends and Van Cappellen, 2005). Many authors have reported arsenic release as a result of dissimilatory reduction of Fe(III) to Fe(II) (Cummings et al., 1999; Zobrist et al., 2000; Islam et al., 2004; Burnol et al., 2007). Microbially mediated reduction of assemblages comprising arsenic sorbed to ferric (hydr)oxides is gaining consensus as the dominant mechanism for the mobilization of arsenic into the West Bengal and Bangladesh aquifers (Smedley and Kinniburg 2002; Islam et al., 2004; O’Day 2006).
Several of the iron (hydr)oxide nanoparticles have isostructural equivalents in which cations other than Fe occupy the interstices of the oxygen framework. Therefore, the existence of these isostructural compounds suggests that solid solutions could be formed between end members via isomorphous substitution for Fe(III) by other cations (Cornell and Schwertmann, 2003). Al is 17% smaller than iron, and, even though it is separated from Fe by forming Al-silicates (clay minerals), a significant proportion is always also incorporated into Fe(III) (hydr)oxides. Goethite is one of the thermodynamically most stable iron oxides (Cornell and Schwertmann, 2003) in soil and sediments and the full range of substitution in natural sample of up to 33 cmol mol-1 is found.
Natural attenuation of arsenic by adsorption on (hydr)oxides nanominerals may be also limited due to competing oxyanions, in which one anion will normally be competing for the sorption sites (Hongshao and Stanforth, 2001; Sahai et al., 2007; Zang et al.; 2008). Due to similar acid dissociation constants phosphate (pKa1 = 2.1,
pKa2 = 7.2, pKa3 = 12.3) behaves much like arsenate (pKa1 = 2.2, pKa2 = 6.9, pKa3 =
11.4). Therefore, they should have similar effects on the surface of the (hydr)oxides nanoparticles. Hongshao and Stanforth (2001) found that under acidic conditions the quantity of arsenate that is replaced with phosphate from goethite increases with contact time before phosphate is added, but the amount of arsenate that can not be replaced with phosphate is independent of contact time at an initial molar ratio of phosphate to arsenate of 1, and vice versa. Zang et al. (2008) verified that the density of irreplaceable phosphate or arsenic on goethite decreases to a limit with an increase in the initial concentration of the other anion. Liu et al. (2001) reported that more arsenate is replaced by phosphate from goethite as the initial molar ratio of phosphate to arsenate increases. Manning and Goldberg (1996) suggested that there were sites on the surface that were specific for each ion as well as some nonspecific sites on which both ions could adsorb.
In addition to phosphate, carbonate may also, to a lesser extent, limit the arsenate sorption reactions. The displacement of adsorbed As with dissolved carbonate was recently examined theoretically by Appelo et al. (2002), and this mechanism was proposed to be potentially one of the major reasons for high As concentrations in groundwater. In Bangladesh, the mobilization of As by carbonate has been used to explain the occurrence of high levels of As in groundwaters (Anawar et al., 2003).
Thus, it is worthwhile to investigate the adsorption and replacement of one anion from mineral nanoparticles by another. In addition, investigations of the competition between the anions can provide insight into the reactions occurring on the surface.
Spectroscopy investigations show that arsenic is strongly bonded on the surface of the Al and Fe (hydr)oxide nanoparticles due to ligand exchange with hydroxyl groups (OH or OH2), and the formation of inner-sphere binuclear monodentate-bidentate
applied to assess arsenic coordination in a variety of geologic and synthetic material with environmental remediation purpose (Myneni et al., 1998; Frost and Kloprogge, 2003; Frost et al., 2003; Frost et al., 2006). Raman spectroscopy is a scattering technique that provides information on vibrational modes of molecules. When photons of visible light are scattered with the emission or absorption of phonons, the energy (or frequency) shifts are very small, but they can be measured. The process is referred to as Raman Scattering when the phonon emitted or absorbed is optical. Otherwise, they are acoustical and the process is referred to a Brilhonin scattering. The resulting differences between scattered and incident energy correspond to specific energy-level differences for the substance under study and such yield insights into its molecular structure. It can distinguish, unambiguously, between minerals with the same stoichiometry but different crystal structure. Unlike FTIR, the Raman spectroscopy in aqueous system is straightforward because water is a weak Raman scatter. In addition, this technique is non-destructive, requires minimal sample preparation, and can be used on massive specimens from lump or to fine powder and liquid (Hope et al., 2001).
Vibrational spectroscopy studies have shown that the symmetry of the AsO4
3-tetrahedron is strongly distorted by the protonation, cation presence, and water coordination (Myneni et al., 1998a and 1998b). The vibrational spectra of Ca, Mn, Fe, Co, Ni, Cu, and Zn AsO43- complexes in crystalline hydrated solids indicate that the
As-OMetal symmetric stretching vibrations shifted to different energies when compared to
the aqueous AsO43-. For example, the transition metal arsenates, such as those of Mn,
Fe, Co, Ni, Cu, and Zn exhibit a red shift for symmetric stretching vibrations, whilst the vibrational Al-arsenate spectra shifted to a lower wavenumber, as predicted by theoretical studies (Myneni et al. 1998). Among all tetrahedral oxyanions, the position of the arsenate vibrations occurs at lower wavenumbers than the other naturally occurring mineral oxyanions (Frost et al., 2006).
Chapter 1
RAMAN SPECTROSCOPY OF As(V) LOADED Al AND Fe (HYDR)OXIDES
ABSTRACT
Raman spectroscopy has been widely used to characterise Al and Fe (hydr)oxides features. Nowadays, that technique has also been applied to the study of contaminants in soils, sediments, and waters. Most of investigations involve identification of arsenate phase in connection with Al and Fe (hydr)oxides since they are ubiquitous and play a key role in controlling As mobility and bioavailability. However, these investigations have been carried out on pure minerals, and little is known about the vibrational stretching modes of the Fe (hydr)oxides containing structural Al. Thus, the objective of this work was to investigate the influence of structural Al in the vibrational stretching modes of goethite as well as identify the arsenate phase formed on its surface and on other Al and Fe (hydr)oxides. Hematite (Hm), goethite (Gt), 2-line ferrihydrite (Fh), gibbsite (Gb), poorly crystalline aluminium hydroxide [Al(OH)3], and Al-substituted
goethites (AlGts) were synthesised, and characterised chemically and physically. These adsorbents without and with adsorbed arsenate were investigated by means of X-Ray diffraction, diffuse reflectance, and Raman spectroscopy. Presence of structural Al increased the specific surface area of the Gt, and its As adsorption capacity. The general effects of the structural Al were to reduce Gt crystallinity and displace spectral lines. Such structural disorder was clearly identified by Raman spectroscopy and X-Ray diffraction. Changes in vibrational frequencies and linewidths due to structural Al resulted in loss and overlap of many Gt active bands. These effects increased as the degree of substitution increased. Raman technique also confirmed the co-occurrence of magnetite in AlGt13
sample, as indicated by XRD. As(V) loading adsorbents caused changes or no additional phases in the XRD and diffuse reflectance patterns. On the other hand, As-O vibrational bands were visualised on all Raman spectra, except for pure Gt probably due to its lowest content of adsorbed As(V). Positions of As-O vibrational band suggested that As(V) was strongly retained on the minerals as inner-sphere surface complexes, except for Gb and Hm where a lesser stable complex seems to predominate due to evidence of surface precipitation. After thermal treatment, magnetite transformed completely into Hm which presented a red shift on the spectral line evidencing the presence of Al in the magnetite lattice.
1. INTRODUCTION
The groundwater and surface water contamination by arsenic around the world is a very sensitive issue which has concerned the scientific community. The most serious problems related to arsenic contamination have been reported in Bengal Basin (West Bengal and Bangladesh, mainly) where more than 40 million people have been drinking water with excessive arsenic (Smedley and Kinniburg, 2002). In Brazil, some areas of the Iron Quadrangle mineral province in Minas Gerais State revealed a naturally high As background due to arsenopyrite mineralization in either disseminated veins or fractures, with average As concentrations above 100 mg kg-1 in soils and 100 µg L-1 in local water (Mello et al., 2006; Deschamps et al., 2005; Matschullat et al., 2000). On the basis of chronic toxicological effect of As, currently WHO recommends the threshold of 10 μg L-1 in drinking water.
Arsenic in the environment can exist either as organic or as inorganic forms, and its toxicity depends primarily on its valence states (-3, 0, -1, +3, or +5). Redox potential (Eh) and pH control As speciation, and then its toxicity, mobility, and bioavailability in terrestrial environment. In addition, arsenic can be methylated and both As(III) and As(V) can coexist with monomethylarsonic acid (MMA), and dimethylarsinic acid (DMA). Because of relatively slow transformation on the environmental redox conditions, both species, As(III) or As(V), can be often found in either redox environment.
The most common technique for removing arsenic from water is coagulation with ferric salts, followed by filtration (Driehaus et al., 1998). However, due to the difficulties to handle the waste generated by coagulation technique, the attempt to seek for more efficient methods have propelled the investigation of different adsorptive materials. Adsorptive process have been assessed and materials such as activated alumina, poorly crystalline ferric hydroxides and granular ferric hydroxides, have been shown to be more promising due to their high affinity for arsenate (USEPA 2000, and references therein).
The main surface complexes formed between arsenic and Al and Fe (hydr)oxides are inner-sphere mono and, or, binuclear, involving ligand exchanges with surface OH and OH2 groups. These linking mechanisms have been confirmed by different
Raman spectroscopy has also been a useful tool to identify arsenic compounds with environmental remediation purpose (Frost and Kloprogge, 2003; Frost et al., 2003; Frost et al., 2006), since its mobility and availability is mostly controlled by Al and Fe (hydr)oxides. Raman spectroscopy is a scattering technique that provides information on vibrational modes of molecules. When photons of visible light are scattered with the emission or absorption of phonons, the energy (or frequency) shifts are very small, but they can be measured. The process is referred to as Raman Scattering when the phonon emitted or absorbed is optical. Otherwise, they are acoustical and the process is referred to a Brilhouin scattering. The resulting differences between scattered and incident energy correspond to specific energy-level differences for the substance under study and such yield insights into its molecular structure. It can distinguish, unambiguously, between minerals with the same stoichiometry but different crystal structure. Unlike FTIR, the Raman spectroscopy in aqueous system is straightforward because water is a weak Raman scatter. In addition, this technique is non-destructive, requires minimal sample preparation, and can be used on massive specimens from lump or to fine powder and liquid (Hope et al., 2001).
Vibrational spectroscopy studies have shown that the symmetry of the AsO4
3-tetrahedron is strongly distorted by the protonation, cation presence, and water coordination (Myneni et al., 1998a and 1998b). The vibrational spectra of Ca, Mn, Fe, Co, Ni, Cu, and Zn AsO43- complexes in crystalline hydrated solids indicate that the
As-OMetal symmetric stretching vibrations shifted to different energies when compared to
the aqueous AsO43-. For example, the transition metal arsenates, such as those of Mn,
Fe, Co, Ni, Cu, and Zn exhibit a red shift for symmetric stretching vibrations, whilst the vibrational Al-arsenate spectra shifted to a lower wavenumber, as predicted by theoretical studies (Myneni et al. 1998b). Among all tetrahedral oxyanions, the position of the arsenate vibrations occurs at lower wavenumbers than the other naturally occurring mineral oxyanions (Frost et al., 2006).
2. MATERIAL AND METHODS
2.1. Synthesis of Al and Fe (Hydr)oxides
2.1.1. Iron (Hydr)oxides Synthesis. Hematite (Hm), Goethite (Gt), and 2-line
Ferrihydrite (Fh) were synthesised by neutralizing Fe(NO3)3 solution with KOH
following the procedure described in Schwertmann and Cornell (2000). A series of Aluminium substituted goethite was also synthesised following the methods therein. Three Al-substituted goethites with different Al:Fe ratio (15:50, 25:50, and 35:50) were prepared from a ferrous solution and aluminium chloride by precipitation with potassium hydroxides and aged in a plastic bottle during 90 days. Slow oxidation of Fe2+ to Fe3+ and incorporation of Al3+ in the goethite structure were achieved by opening the bottle daily and vigorously stirring the suspensions during 5 minutes. In order to remove the excess of Al3+, the precipitates were washed twice with 0.01 mol L-1 KOH solution. All (hydr)oxides were washed with Milli-Q water, centrifuged, and dried at 50 oC at an oven with air circulation, except for Ferrihydrite which was freeze-dried.
2.1.2. Aluminium Hydroxides Synthesis. Gibbsite was prepared following
procedures outlined in Kyle et al. (1975). An Al(NO3)3 solution was titrated with
4 mol L-1 NaOH solution to a pH of 4.6 ± 0.2. The gelatinous precipitate was heated for two hours at 40 oC, then washed twice, dialyzed against Milli-Q water for 36 days, and dried at 50 oC. Poorly crystalline aluminium hydroxide was prepared from an aluminium nitrate solution by precipitation with 4 mol L-1 NaOH solution. The procedure was similar to that followed for the synthesis of gibbsite, but the heating was suppressed step to preserve a low crystallinity. Similarly to ferrihydrite, poorly crystalline aluminium hydroxide was freeze-dried in order to prevent further crystallization.
2.2. Characterisation Analyses. Particle size distribution was obtained by laser
particle size analyser (Micromeritics Saturn Digisizer model 5200). Prior to particle measurement, samples were externally dispersed in a sodium metaphosphate medium for 1 h. The content of Al and Fe were determined by wet chemistry methods. Thus, 0.1000 g of dried sample was mixed with 3 mL of HCl and 1 mL of HNO3 (both
at 120 oC for about 4h, and after that, the samples were left digesting overnight at 70 oC constant temperature. After cooling to room temperature, the digested samples were transferred to 25 mL volumetric flask, filled with Milli-Q water. Aliquots were transferred to 10 ml plastic bottles and stored until measurements. Total Al and Fe were determined by inductively coupled plasma optical emission spectroscopy (ICP-OES), using a perking Elmer Optima 3300 DV. The degree of Al3+ substitution in the Gt was determined by the Al:Fe molar ratio, i.e. cmol mol-1 = Al3+/(Al3++Fe3+)*100.
The specific surface area was determined by N2 adsorption (BET method) using multiple point technique (Quantachrome model NOVA 1000). The sample was previously degassed at 110 oC for 2 h with vacuum a continual stream of N2 prior to the
surface area determination.
2.3. As(V) Loaded (Hydr)oxides. Al and Fe (hydr)oxides were loaded with
arsenate by supplying As(V) to one gram of each sample in 10 mmol L-1 CaCl2
solutions at pH 5.0 ±0.2. Suspensions were left reacting in a horizontal shaker for one week, and after that, the tubes were centrifuged (3000 rpm, 30 min.), the supernatants were filtered through 0.22 μm membrane filters (Millipore Millex-GV, USA) and stored for further As analyses. The As-rich (hydr)oxides were freeze-dried and stored for further spectroscopic studies. Amounts of adsorbed As(V) were calculated by the difference between the initial and final As concentration in solution. Arsenic adsorbed by the reaction vessels were measured in blanks containing arsenic solution but no adsorbent materials. Contents of As in solution were measured by inductively coupled plasma optical emission spectroscopy (ICP-OES), using a Perkin Elmer Optima 3300 DV. Scandium was used as internal standard to correct for instrumental instabilities and matrix effect. Solution of this element was added to the solution to reach a final concentration of 44.5 µmol L-1. Typical detection limits (3σ) of 0.42 µmol L-1 of As were obtained. All assays were carried out in triplicates.
2.4. X-ray diffraction (XRD) and diffuse reflectance (DR). These techniques
spectrometer, respectively. XRD was performed using a cobalt Kα radiation at 40 kV and 30 mA in a Rigaku diffractometer with graphite monochromator. Acquisition time for the XRD patterns in the 4-80o 2θ interval was set at 10 sec per 0.05o 2θ step. For DR, samples were gently pressed against aluminium paper to minimise preferred orientation. Holders were placed into the sphere, and the spectra were recorded from 300 to 900 nm in 0.5 nm steps at 52 nm min-1 using a double cluster GBC, model CINTRA 20, equipped with an MgSO4-coated integrating sphere 10 cm in diameter.
The diffuse reflectance spectra of each adsorbent were treated mathematically in order to eliminate imperfections and noises. From this process, the data were smoothed following the method stated by Barrón et al. (2000). The graphics of the second derivative of the Kubelka-Munk function [f(KM) = (1 – R)2/2R, where R is the reflectance in percentage] were obtained from the percentage of the spectra of the smoothed reflectance.
2.5. Raman Spectroscopy. Analyses were performed on dried samples in a Jobin
Yvon/Horiba model LabRam HR 800. The detector was 1024 x 256 pixel liquid nitrogen cooler charge coupled device (CCD). A He-Ne laser 632.8 nm wavelength and power output of 20 mW measured at the laser head was used as the excitation force. In order to avoid sample degradation, the laser power was always kept below 0.08 mW on the sample, except for Gb and Al(OH)3. Samples were targeted by the laser beam
through microscope objective (Olympus 100X, 0.9 NA), and the scattered light was collected through the same objective in a back scattering configuration. The entrance slits to the spectrograph were 100 micrometers with a correspondent resolution of 2.0 cm-1. Holographic grating was of 600 g mm-1. Frequency calibration was achieved using the 520 cm-1 line silicon. The sample was pressed on a glass slide on the microscope stage. Acquisition time was at 30 s per scan (≅ 10). Collected Raman spectra were analysed and optimised with Origin 7.0 software, and the collected spectra were normalised and background corrected.
seconds. After that, the power of the laser beam was decreased to the initial value (0.08 mW), and a second run was carried out upon the modified sample.
3. RESULTS AND DISCUSSION
3.1. Characterisation Analyses. Assuming the theoretical formula for each
mineral, the recovering percentage by wet digestion was higher than 90%. Trace amounts of Al in Hm, Gt, and Fh, as well as Fe in Gb and poorly crystalline Al(OH)3
were, in general, lower than standard error of the mean, and so attributed to analytical error. The Al-goethites end products presented 0.13, 0.20, and 0.23 cmol mol-1 of Al (Table 1). According to these substitution degrees in the Al-goethite structures, they will be henceforth referred to as AlGt13, AlGt20, and AlGt23.
Ferrihydrite exhibited the highest surface area followed by AlGts. Specific surface area of the Al-substituted goethites slightly increased as the aluminium incorporation increased from 13 to 20 cmol mol-1, but decreased with further increase of Al content. No trend between Al content and surface area was observed, as also previously reported by Schulze and Schwertmann (1987), Strauss et al. (1997), and Gonzales et al. (2002). According to Gonzales et al. (2002) the crystal size of goethite became smaller as Al substitution increased, but no clear trend between Al content and surface area was observed.
Particle size distribution obtained for samples passed through < 53 µm sieve decreased in the following order: Fh > Gb > Al(OH)3 > AlGt13 > AlGt20 > AlGt23 > Gt >
Table 1 – Surface area (SA), mean particle size (MPS), content of Al and Fe, recovered (Rc), degree of Al substitution in the goethites, and adsorbed As(V). Data are represented as means ± standard error of the mean (n=3)
ADSORBENT SA MPS Total Al and Fe content Rc
a/ Al for Fe
substitutionb/
Asadsorb.c/
Al Fe
-- m2 g-1 -- --- μm --- --- g kg-1 --- -- % -- -- cmol mol-1-- --- μmol g-1 ---
Hm (α-Fe2O3) 34.8 0.20 ± 0.001 d
0.03 ± 0.04 656.85 ± 0.93 93.91 159.97 ± 2.68
Fh (Fe5HO8 . 4H2O) 260.4 23.47 ± 0.31 0.55 ± 0.54 528.63 ± 3.61 90.93 1,063.45 ± 45.10
Gt (α-FeOOH) 20.6 0.97 ± 0.02 0.74 ± 0.07 575.19 ± 0.02 91.52 77.92 ± 2.33
AlGt13 119.4 11.33 ± 3.87 69.06 ± 0.82 456.42 ± 1.45 13 412.44 ± 1.90
AlGt20 124.7 3.25 ± 0.47 97.75 ± 1.50 404.62 ± 0.62 20 407.75 ± 0.73
AlGT23 113.2 2.55 ± 2.71 113.81 ± 1.12 380.97 ± 1.79 23 386.68 ± 3.02
Gb Al(OH)3 45.7 21.01 ± 0.46 334.06 ± 2.75 0.80 ± 1.02 96.58 215.88 ± 0.60
Al(OH)3[Al(OH)3 3H2O] 8.3 12.60 ± 1.31 214.08 ± 0.03 0.27 ± 0.39 104.77 1,541.22 ± 5.89 a/
calculated considering the theoretical formula for each material;
b/
calculated from the following molecular relation: Al for Fe substitution = (Al / Fe + Al)*100;
c/
In addition, the technique does not take into account imperfections on the mineral structure which can significantly contribute to increase the reactive adsorption sites. For instance, ionic substitution of Al for Fe in the goethite lattice has a marked effect on goethite properties, such as variations in crystal size, shape and surface area, and structural OH content (Murad and Schwertmann, 1983; Schwertmann, 1984; Schulze and Schwertmann, 1987; Torrent et al., 1987; Jeanroy et al., 1991) which account for great structural disorder. The amount of adsorbed arsenate calculated herein indicates that all adsorbents were fully loaded, as indicated by maximum capacities measurements (Silva et al., 2008).
3.2. XRD spectra. In general, the XRD patterns revealed well defined sharp
peaks, characteristics of well crystallised minerals for Hm, Gt, and Gb (Figure 1). The main peaks corresponds to d(104), d(110), and d(002), as previously reported by Dixon and Weed (1989) and Cornell and Schwertmann (2003). Ferrihydrite spectrum exhibited high degree of structural disorder with two broad peaks at ~38 and ~74 2θ corresponding to d(110) and d(300), typical of 2-line ferrihydrite. Aluminium hydroxide [Al(OH)3] also showed typical spectrum with no diffraction pattern confirming its poor
crystallinity. XRD peaks for Al-substituted goethites fairly agree with the pure goethite, but with shifts on the diffraction lines towards higher angles due to the presence of structural aluminium. It is well known that the size at the unit cell decreases when Al replaces Fe in the goethite structure, because the Al3+ ion is slightly smaller than the Fe+3 ion, i.e. 0.053 vs 0.065 nm respectively (Schulze and Schertmann, 1984). The higher is the degree of Al substitution the greater are the shifts, as observed herein. In addition, a narrow peak at ~42o 2θ (d = 0.2532 nm) was detected on the AlGt13 XRD
spectrum, which can be ascribed to magnetite. The presence of magnetite as coprecipitated with AlGt13 was confirmed by attraction to a magnet. Magnetite
formation is feasible at low Al/(Al + Fe) ratio due to the slow oxidation of ferrous ions. As the aluminium concentration is low, the excess of Fe3+ can encapsulate part of the soluble Fe2+ ions, leading to formation of magnetite rather than goethite. At an Al/O4
molar ratio close to 0.4, substitution of aluminium for iron tetrahedrically coordinated in the magnetite structure is expected (Cornell and Schwertmann, 2003).
3.3. DR spectra. The second derivative of the Kubleka-Munk function [f(KM)]
10 20 30 40 50 60 70 80 d(300) 2-line Ferrihydrite
o
2θ CoKα
Poorly crystalline Al(OH) 3
d(110)
10 20 30 40 50 60 70 80
Hematite d(024) d(313) d(311) d(021) d(110)
d(002)
d(300) d(214) d(116)
d(024) d(113) d(110) d(104)
o2θ CoKα
Gibbsite
d(021)
10 20 30 40 50 60 70 80
Magnetite
d(121)
d(221) d(140)
d(111)
d(301)
AlGt23
AlGt20
AlGt13
o
2θ CoKα
pure Goethite
d(110)
Figure 1 – X-ray powder diffraction of hematite, goethite, gibbsite, Al-substituted goethite, 2-line ferrihydrite, and poorly crystalline aluminium hydroxide.
ferrihydrite, and goethite (Figure 2), as reported in the literature (Sherman and Waite, 1985; Scheinost et al., 1999; Torrent and Barrón, 2003). Al-substituted goethites showed reflectance pattern similar to pure goethite, but with slight shifts of the ∼430 nm band to shorter wavelengths (blue shift), as Al-substitution increased. In addition, absorption bands close to 360-380 nm were pronounced for Al-goethites, which this band is ascribed to the 6A1 4E(4D) ligand field transition of Fe3+ (Sherman and Waite,
300 350 400 450 500 550 600 650 700 750 -1.5x10⁻³ -1.0x10⁻³ -5.0x10⁻⁴ 0.0 5.0x10⁻⁴ 1.0x10⁻³ 1.5x10⁻³ 2 nd d eri va ti ve f (KM) Hematite
300 350 400 450 500 550 600 650 700
-3.0x10⁻³ -2.0x10⁻³ -1.0x10⁻³ 0.0 1.0x10⁻³ 2.0x10⁻³ 3.0x10⁻³ 2-line Ferrihydrite
300 350 400 450 500 550 600 650 700
-4.0x10⁻³ -3.0x10⁻³ -2.0x10⁻³ -1.0x10⁻³ 0.0 1.0x10⁻³ 2.0x10⁻³ 3.0x10⁻³ 4.0x10⁻³ 2 nd d eri v a ti te f (K M )
λ (nm) Goethite
300 350 400 450 500 550 600 650 700
-1.5x100 -1.0x100 -5.0x10⁻¹ 0.0 5.0x10⁻¹ 1.0x100 1.5x100 AlGt13 AlGt20 AlGt23
λ (nm)
Goethite
Figure 2 – Second derivative of the Kubelka-Munk (KM) function of the hematite, ferrihydrite, goethite, and Al-substituted goethite samples.
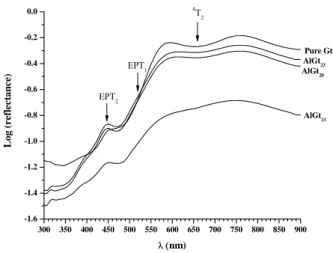
can be also seen in the logarithmic function of the diffuse reflectance spectra against wavelength (Figure 3). The blue shift of the main absorption edge (towards higher energy), represented by the electron pair transition (EPT1 and EPT2), is in line with
Kosmas et al. (1986) and Scheinost et al. (1999). Malengreau et al. (1996) also observed such blue shift, but they were not able to establish a quantitative relationship between band shift and Al substitution. We also failed to evidence that relation because the AlGt13 reflectance spectrum is quite different from the other goethites. It exhibited a
higher light absorption capacity due to its darker colour as a resulted of the co-occurrence of the magnetite.
300 350 400 450 500 550 600 650 700 750 800 850 900 -1.6
-1.4 -1.2 -1.0 -0.8 -0.6 -0.4 -0.2 0.0
AlGt13
AlGt23
L
o
g
(ref
lect
an
ce
)
λ (nm)
4 T2
EPT2 EPT1
Pure Gt
AlGt20
Figure 3 – Diffuse reflectance spectra of unsubstituted and substituted goethites in the near ultra violet-visible-near infra-red regions
3.4. Raman spectroscopy. The As-O stretching vibration is very sensitive to its
environment and it has been used to identify different arsenate phases (Goldberg and Johnston, 2001; Frost et al., 2006; Jia et al., 2006). It can be observed that the Raman spectra of crystalline (hydr)oxides showed sharp peaks whilst the poorly crystalline minerals exhibited a noise broad peaks due to high degree of structural distortion.
3.4.1. Raman spectra for Gb and poorly crystalline Al(OH)3. Hydroxyl stretching
150 450 750 1050 7 0 0 7 5 0 80 0 85 0 9 0 0 9 5 0 1 0 0 0
R e la ti v e In te n s ity (a .u .)
R am a n S h ift (cm-1
)
G bA s (V ) - pu re G b
~ 86 7
~713 ~360 430 414 ~590 ~895 57 2 54 1 507 397 38 2 32 4 ~30 8 25 7 24 3 Gb+As Pure Gb Al(OH)3+As ~82 3 ~860 R ela tiv e in te n sit y ( a .u .) ~583 Pure Al(OH)3
a
3000 3100 3200 3300 3400 3500 3600 3700 3800
b
~ 342 9 3431 3615 3522 3358 Gb+As Pure Gb Al(OH)3+As R ela ti v e in te n sit y ( a .u.) Pure Al(OH)
3
Raman Shift (cm-1)
Figure 4 – Raman spectra of gibbsite (Gb) and aluminium hydroxide [Al(OH)3] with
and without As(V). a, Gb and Al(OH)3 spectra in the 150 – 1050 region; b, Gb and
Al(OH)3 spectra in the 3000 – 3800 region. Inset in panel a represents the remaining
By subtracting the Raman spectrum of pure gibbsite from As(V)-gibbsite sorption product one, a broad band at ∼867 cm-1 was obtained (Figure 4a, inset) . This band positions lay close to that reported by Goldberg and Johnston (2001) which observed vibrational band in the 874 cm-1 frequency region for As(V) aqueous solution. These authors argued that at pH 5.0 the dominant arsenate species is H2AsO42- with symmetry
of C2v, and addressed that band position to As-O vibrational group. Theoretical studies have indicated that Al may strongly distort arsenate tetrahedron and the As-OAl
vibrations should shift to low wavenumbers when compared to the uncomplexed arsenate. FTIR spectra of arsenate in poorly crystalline Al-arsenate supported this statement and showed that the As-OAl vibrations shifted to 740 cm-1, whilst the
As-Ouncomplexed exhibited a broad band at 887 cm-1 (Myneni et al., 1998, and reference
therein). The presence of adsorbed As(V) enhanced the vibrational stretching of the OH units and seems to have slightly contributed to diminish the luminescence of the pure Gb spectrum.
Raman spectrum of the poorly crystalline Al(OH)3 exhibits a broad peak at ~590
cm-1 which is very close to that reported to Gb at 572 cm-1. Then, it also can be assigned to Al-O stretching vibration unit. The presence of adsorbed arsenate is clearly resolved by the strong As-O stretching vibration band at ~860 cm-1 (Figure 4a). A band displaced of 7 cm-1 is also observed in the As(V)-Al(OH)3 sorption product in relation to pure
Al(OH)3 spectra. This finding is also in line with Goldberg and Johnston (2001). These
authors pointed out that the infrared and Raman-active As-O bands in the 844 – 865 cm-1 region are ascribed to As-O vibration of an inner-sphere Al-O-As complex. In our investigation the As-O vibration band lay between this range (~860 cm-1), therefore, we can infer that arsenic is strongly retained on Al(OH)3 surface as a very stable surface
complex.
For poorly crystalline aluminium hydroxide of empirical formula Al(OH)3.3H2O,
two types of OH groups maybe assumed, one from the OH units and another from interlamellar water (OHH2O). Bands at ~3429 cm-1 is assigned to OH stretching vibration
of the hydroxyl unit. The enlargement observed on the pure Al(OH)3 line which starts
from ~1250 up to ~3200 cm-1 may be ascribed to OHH2O units due to water stretching
bands (Figure 4b). This OHH2O stretching vibrational bands on arsenate-Al(OH)3
Then, considering the high structural disorder of the poorly crystalline Al(OH)3, the
exchange of protons between water molecules and arsenate ions is feasible.
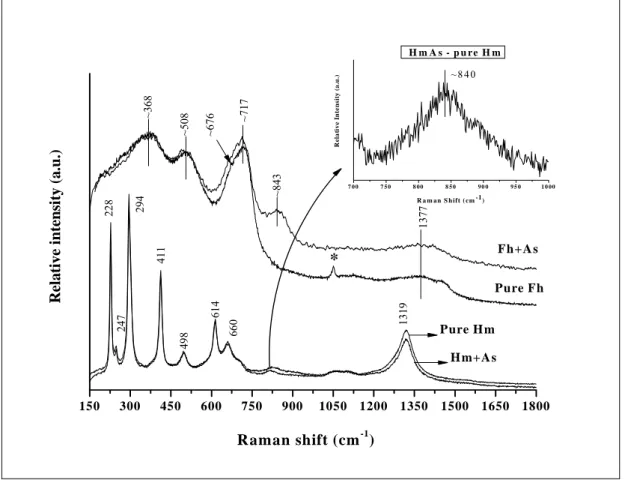
3.4.2. Raman spectra for Hm and Fh. Hematite spectrum exhibited narrow peaks
characteristic of a well crystalline mineral (Figure 5). The positions of the Raman-active bands are in good agreement with previous studies (de Faria et al., 1997; Bouchard and Smith, 2003; Chamritski and Burns, 2005). Sharp peaks can be observed at 228, 247, 294, 412, 498, 614, and 1315 cm-1. The band at 660 cm-1 can be attributed to structural defects on hematite making it appears as a prohibited line on the Raman spectrum. This band is active on infrared spectrum. The weak broad band at ~840 cm-1 could be better observed on the subtracted As(V)-loaded hematite spectrum (Figure 5, inset). This band is assigned to As-O stretching vibration. Low resolution of this band can be attributed to the relative low As(V) adsorption capacity of the Hm in comparison with Fh. This band position also lay close that one addressed by Jia et al. (2006) probably as product of surface adsorption. No shift was observed on the spectral line due to the presence of adsorbed As(V), indicating that the sample remained unchanged evenupon the laser beam.
Similarly to Hm, all diagnostic peaks on the Raman spectrum of the 2-line ferrihydrite can be observed at ~368, ~508, ~717, and 1377 cm-1. A shoulder is also observed at ~676 cm-1 (Figure 5). These positions of the Raman-active bands agree with previous studies carried out by Mazetti and Thistlethwaite (2002). Nevertheless, our results differ from that reported by Jia et al. (2006). These authors reported three strong narrow peaks at 222, 289, and 407 cm-1. Such pattern would not be expected for poorly crystalline minerals which usually exhibit broad and unresolved bands due to their high degree of structural disorder. Therefore, this discrepancy may be due to the laser power used in the experiment. Laser-induced thermal effect on mineral phases was shown by de Faria et al. (1996) who argued that the laser power magnitude is an important consideration when interpreting Raman.
150 300 450 600 750 900 1050 1200 1350 1500 1650 1800
7 0 0 7 5 0 8 00 8 5 0 90 0 9 5 0 1 0 00
R e la ti v e I n te n sit y (a .u .)
R a m a n S h ift (cm-1)
H m A s - p u re H m
~ 8 4 0
Raman shift (cm-1)
1 377 ~ 717 ~67 6 ~ 508 ~ 368 ~ 843 1 319 66 0 61 4 49 8 24 7 41 1 294 Re la ti ve i n tens it y (a .u.) 22 8
Pure H m
H m+As Pure Fh
Fh+As
*
Figure 5 – Raman spectra of the hematite (Hm) and 2-line ferrihydrite (Fh) with and without As(V). The symbol * indicates residual bands of the reagent (NO3-) used in
the synthesis. Inset in the panel represents the remaining band after subtraction of the Raman spectrum of Hm with and without As loaded.
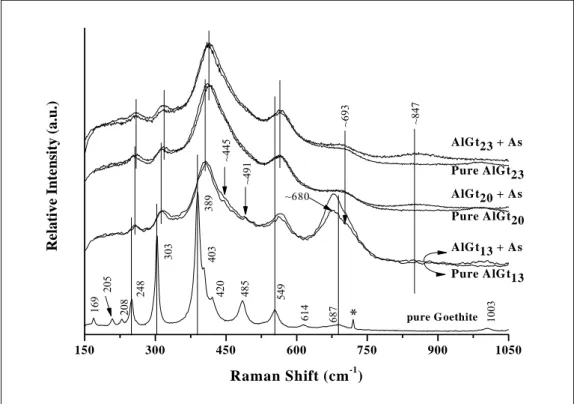
3.4.3. Raman spectra for Gt and Al-substituted goethites. Pure Gt spectrum
150 300 450 600 750 900 1050 61 4 208 16 9 ~69 3 549 ~4 45 ~4 91 ~ 847 pure Goethite AlGt13 + As
Pure AlGt13 Pure AlGt20 AlGt20 + As Pure AlGt23 * 1003 687 48 5 42 0 403 389 30 3 24 8 Re lati ve Int ensi ty (a. u.)
Raman Shift (cm-1)
205
AlGt23 + As
~680
Figure 6 – Raman spectra of the goethite and Al-substituted goethites (AlGt13, AlGt20,
and AlGt23) with and without As(V). The symbol * indicates residual bands of the
reagent (NO3-) used in the synthesis.
Aluminium substitution in the goethite structure affected considerably its vibrational features, especially the resolution of the Raman spectrum. In general, Al had a major influence under the degree of crystallinity and under the frequency of the spectral bands of the goethite. The main sharp peaks observed on pure Gt spectrum were broadened and shifted towards the high frequency region (red shift), as indicated by vertical bars in Figure 6. For goethites with higher Al content, the lines are broader and the shifts are less pronounced. For instance, the vibrational frequency of the main Gt peak at 389 cm-1 shifted to ~406 cm-1, and then to 414 cm-1 as the Al content increased to 13 and to 20 cmol mol-1, respectively.
counter effect, i.e. substitution of iron in the (hydro)xide lattices by other ions (e.g. Al), should result in intensity depletion. The scope of this process occurs gradually as suggested by the two shoulders at 445 and 491 cm-1 on the AlGt13 spectrum, probably
product of the Raman band alterations at 420 and 485 cm-1 on pure Gt spectrum.
In general, the presence of arsenate phase adsorbed on Al-substituted goethites can be visualised at ~847 cm-1 frequency on the As(V)-AlGt Raman spectra (Figure 6). Even though arsenate band on the As(V)-AlGt Raman spectrum is more pronounced as structural Al increase, arsenate seems to be more associated with iron than aluminium, since the As(V)-AlGt band positions are much closer to those verified for Hm (~840) and Fh (~843) than those observed for Gb (~867 cm-1) and poorly crystalline Al(OH)3
(~860 cm-1). Similar to other Raman spectra analysed herein , these bands are also ascribed to As-O stretching vibrational group.
The Raman technique also revealed that AlGt13 sample is rather heterogeneous.
The well resolved Raman-active band at ~680 cm-1 is characteristic of magnetite, formed during the synthesis, as argued earlier. This band appears wider and somewhat shifted concerning to that one observed at 670 cm-1 for pure magnetite (Gasparov et al., 2000; Chamritski and Burns, 2005). Fe3O4 has an inverse spinel, cubic unit cell, and there are
two iron position in the magnetite structure: A positions characterised by tetrahedral oxygen surrounding the Fe ions, which is occupied only by Fe3+; whereas the octahedral B positions can be occupied by Fe2+ and Fe3+ (Gasparov et al., 2000). Thus, substitution of Al3+ for tetrahedral Fe3+ is feasible to occur, as discussed previously (section 3.2.1). As these modifications are the same of those verified for AlGts, i.e. increase in frequency and linewidth, we infer that Al is also incorporated in the magnetite lattice.
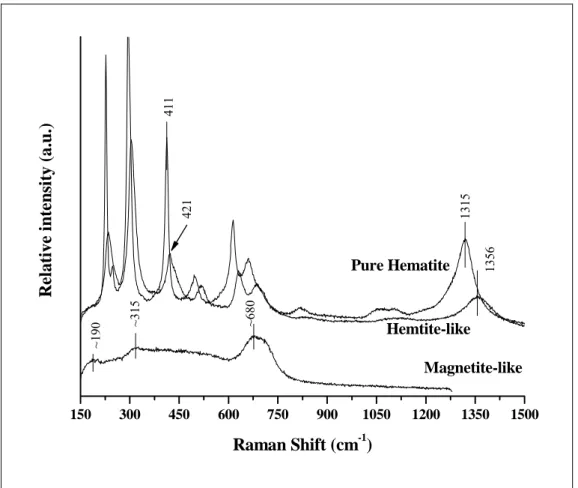
3.4.4. Raman spectra for Magnetite and phase transformation. In order to
confirm the presence of co-precipitated magnetite and to investigate the laser-induced thermal effect giving rise to magnetite phase transformation, the laser was set at a darker region on the sample. The Raman-active bands observed at 190, 315, and 680 cm-1 confirmed the co-occurrence of magnetite with AlGt13. The peak at ~670 cm-1 is
assigned to A1g mode which has a higher frequency than Eg mode and is addressed to
the stretching vibrations of the oxygen atoms along the Fe(A)-O bonds (Gasparov et al., 2000). Similarly to that observed on the AlGt13 spectrum, the main magnetite
150 300 450 600 750 900 1050 1200 1350 1500
135
6
1315
421
411
Pure Hematite
~
680
~3
1
5
Magnetite-like
R
ela
tiv
e in
te
n
sit
y
(
a
.u
.)
Raman Shift (cm-1)
Hemtite-like
~1
9
0
Figure 7 – Raman spectra of magnetite before and after thermal treatment. Pure hematite spectrum was plotted in order to compare with heated magnetite spectrum.
magnetite spectrum (Gasparov et al., 2000; Chamritski and Burns, 2005) were lost due to spectral modifications on the linewidth. This lack can be ascribed to the presence of Al in the magnetite lattice.
Indeed, this band is displaced on Hm-like spectra, but our data suggest that the band at the higher frequency region seems to be most sensitive to such variations.
4. SUMMARY AND CONCLUSIONS
Raman spectroscopy and complementary XRD and diffuse reflectance were used to characterise different Al and Fe (hydr)oxides, to investigate the influence of structural Al in the goethite vibrational features as well as to identify the arsenate phase formed on the mineral surfaces. Spectroscopic results of the synthesised mineral phases fairly agreed with previous data reported in the literature. The presence of aluminium increased greatly the specific surface area of the goethite and improved its efficiency in adsorbing As(V). In addition, aluminium distorted considerably the spectroscopic patterns of the goethite mostly displacing its spectral lines due to change in its unit cell parameters. Raman spectroscopy was the major technique to reveal the structural disorder caused by Al in the Gt properties. Furthermore, this technique was sensible to detect As(V) adsorbed on the mineral surfaces, mainly on poorly crystalline Al(OH3) and ferrihydrite. Raman spectra in general revealed well resolved bands between 800 and 915 cm-1 frequencies, addressed to As-O stretching vibrational groups. The presence of arsenate was not visualised for Gt and rather slightly observed for Hm probably due to their lower As(V) adsorption capacities. As a general observation, our results agree that arsenic is retained as inner-sphere complex on poorly crystalline Al(OH)3, Fh, and AlGts. But for Gb and Hm a lesser stable complex seems to
predominate due to evidence of precipitation on their surface. The presence of coprecipitated magnetite was confirmed by Raman spectroscopy and X-Ray diffraction. Evidence of aluminium replacing iron even in the magnetite lattice was supported by modifications on its main spectral band along with the laser-induced Hm-like Raman spectrum.
resulting in arsenic mobilisation. In contrast, the presence of structural Al is expected to enhance the stability of goethites face to reductive dissolution. Consequently, the dissolution-desorption mechanisms is limited in Al-substituted goethite, contributing to prevent the arsenic dispersion. Nevertheless, further studies are warranted to better understand the role of aluminium in the sorption mechanisms and in the stability of the binding complex formed between arsenic and goethite surface under environmental conditions.
5. REFERENCE
Barrón, V., Mello, J.W.V., and Torrent, J. Caracterização de oxidos de ferro em solos por espectroscopia de reflectância difusa. In: Novais, R. F., Venegas, V. H. A, Schaefer, C. E. R. G. (Eds). Tópicos em Ciência do Solo. Viçosa, 139-162, SBCS, 2000.
Bouchard, M. and Smith, D.C., 2003. Catalogue of 45 reference Raman spectra of minerals concerning research in art history or archaeology, especially on corroded metals and coloured glass. Spectrochimica Acta Part a-Molecular and Biomolecular Spectroscopy 59, 2247-2266.
Chamritski, I. and Burns, G., 2005. Infrared- and Raman-active phonons of magnetite, maghemite, and hematite: A computer simulation and spectroscopic study. Journal of Physical Chemistry B 109, 4965-4968.
Cornell, R.M. and Schwertmann, U., 2003. The iron oxides: structure, properties, reactions, occurences and uses. Wiley-VCH, Weinheim; Cambridge.
deFaria, D.L.A., Silva, S.V., and deOliveira, M.T., 1997. Raman microspectroscopy of some iron oxides and oxyhydroxides. Journal of Raman Spectroscopy 28, 873-878. Deschamps, E., Ciminelli, V.S.T., and Holl, W.H., 2005. Removal of As(III) and As(V)
from water using a natural Fe and Mn enriched sample. Water Research 39, 5212-5220.
Dixon, J.B. and Weed, S.B., 1989. Minerals in soil environments. Soil Science Society of America, Madison, Wisconsin.
Driehaus, W., Jekel, M., Hildebrandt, U., 1998. Granular ferric hydroxide - a new adsorbent for the removal of arsenic from natural water. J. Water Supply Res. Technol. 47, 30 - 35.
Frost, R.L. and Kloprogge, J.T., 2003. Raman spectroscopy of some complex arsenate minerals - implications for soil remediation. Spectrochimica Acta Part a-Molecular and Biomolecular Spectroscopy 59, 2797-2804.

![Figure 4 – Raman spectra of gibbsite (Gb) and aluminium hydroxide [Al(OH) 3 ] with](https://thumb-eu.123doks.com/thumbv2/123dok_br/15390132.67961/38.892.202.780.108.1018/figure-raman-spectra-gibbsite-gb-aluminium-hydroxide-al.webp)