Volume VI Number 4, 2014
Supporting a Regional Agricultural Sector with Geo & Mainstream ICT
– the Case Study of Space4Agri Project
T. Kliment1, G. Bordogna1,2, L. Frigerio1, D. Stroppiana2, A. Crema2, M. Boschetti2, S. Sterlacchini1, P. A. Brivio2
1 National Research Council of Italy, Institute for the Dynamics of Environmental Processes, Milan, Italy
2 National Research Council of Italy, Institute of Electromagnetic Sensing of the Environment, Milan, Italy
Abstract
Agriculture is a global issue nowadays. At the European level, it is a sector, in which we are investing many resources. In particular, the Agri-Food sector plays a central role in the policies of the European Commission and the Horizon 2020 research and innovation program, as well as being the main theme of Expo 2015 that will be held in Milan, Lombardy. In the Lombardy region, the farmers represent 2% of the entire population, cultivating about 80% of the agricultural land. Increasing needs to develop a common body of knowledge shared at the regional and national level so as to make it possible to effectively monitor cropping systems, water stress and impacts of climate changes affecting more frequently the territory, are becoming more and more urgent. In this context, the project Space4Agri (S4A) intends to support the regional and local needs in terms of management of the agriculture sector, by designing and developing an information and knowledge based platform for managing geospatial and mainstream information by making it accessible over the Internet by standard communication technologies (Geo&Mainstream ICT). This platform has been
designed to allow data worklows integrating i) spatial data and observations, ii) non-spatial information available from existing agronomic databases, iii) data collected in the ield by farmers, agronomists
and volunteers using mobile applications, iv) data collected by unmanned aerial sensors, and/or data produced
by researchers as a result of applying scientiic analysis on high quality remote sensing data. Foreseen results of the Space4Agri project and from other similar ongoing research activities may signiicantly spur
the socio-economic development of Europe and create new growth opportunities for companies, public administrations, students and citizens.
Key words
Agriculture, Geo & Mainstream ICT, Space4Agri, Lombardy.
Introduction
Agriculture is a global issue nowadays. Two
principal factors are inluencing the agricultural
sector; one is an economist’s view that agriculture is a key pro-poor strategy for economic growth (Batchelor et al., 2014, Charvat et al., 2014a). The second is a concern for food security, based on the recognition that natural resources are limited, farm sizes are getting smaller, populations are increasing, and that climate change and water scarcity threaten the security of basic food production (Batchelor et al., 2014). There is broad agreement that agricultural productivity needs to improve. The introduction of modern technologies to improve crop yield, provide information
to enable better in-ield management decisions,
reduce chemical and fertilizer costs through more
eficient application, permit more accurate farm records, increase proit margin and reduce pollution.
area; the farmers represent 2% of the entire population, cultivating about 80% of the agricultural land (Acutis et al., 2014). Modern agriculture has a major impact on the environment (Charvat et al., 2014a). Farms and pastures can cause
erosions, desertiication, chemical pollution
and water shortages, these risks need to be monitored
and managed in an effective and eficient
way (Lackóová et al., 2013). One way for an improved sustainable agriculture is the application of geoinformatics. Agro-geoinformatics, a branch of geoinformatics, is critical for agricultural sustainability, food security, environmental research, bioenergy, natural resource conservation, land use management, carbon accounting, global climate change, health research, agricultural industry, commodity trading, economy research, education, agricultural decision-making and policy formulation. Agro-geoinformatics, is the science and technology about handling digital agro-geoinformation, such as collecting, processing, storing, archiving, preservation, retrieving, exploring, transmitting, accessing, visualizing, analysing, synthesizing, presenting, and disseminating agro-geoinformation (Han et al., 2012). Agro-geoinformation, can play a key role in the agricultural decision-making and policy formulation process. Recent advances in geoinformatics have created new opportunities to apply agro-geoinformation for agricultural management, monitoring, and planning (Kaivosoja et al., 2014). Geospatial irrigation data that is detailed, comprehensive, consistent, and timely is needed to support studies tying agricultural land use change to aquifer water use and other factors (Brown et al., 2014).
Within this frame, the Space4Agri (S4A) project aims at developing innovative methodologies for the integration of earth observations into monitoring activities of the agricultural sector in Lombardy (http://space4agri.irea.cnr.it/it). The objective of S4A is to answer the needs from a regional and national level for the
agro-food sector to support in an eficient and effective
way the planning and management of cropping systems, providing information on water stress and impacts of changing climate affecting more frequently the territory. In this context, the project intends to design and develop an information knowledge platform for managing geospatial and mainstream information based on standard communication technologies (Geo & Mainstream ICT). The S4A project consists of seven work packages (WP): WP1, examining
the state of art of the user and system needs. WP2, WP3, and WP4 are the core of the project
covering the three main technological and scientiic
areas SPACE, AERO and IN-SITU, respectively.
The irst focuses on the data analysis performed
on remote sensing, (extraction of crop information data acquired by Earth Observation systems). The second aims at designing
and developing software interface for lying
planning and control of Unmanned Aerial Vehicles
(UAV or drones), and inally the third develops
a system for both acquisition of in-situ data and sharing and dissemination of all the data created relevant for the project. The interaction of these three WPs will allow integration of:
- Satellite data for monitoring
of the environment and the territory (SPACE).
- Aeronautical technologies, such as a UAVs or drones, which will be more precise in monitoring and promoting the understanding of the agro dynamics at the local scale (AERO).
- Smart technologies and methodologies to capture, collect and exchange information via sensors or through reports from operators in the agricultural sector (IN-SITU).
WP 5 will test the methodologies developed within WP2, 3, and 4. WP 6 will evaluate the economic impact of these developed
technologies on the Lombardy region and inally,
WP7 is in charge of project’s dissemination and divulgation activities.
Very few public bodies, in Italy, maintain an active SDI with a portal to make in situ data available routinely; among them meteorological data are the most common type of data published by, for example, Emilia Romagna (ARPA_EMR), Lombardy (SIAR_L, and ARPA_L), Tuscany (ARPA_T), Puglia (SIAR_P), Veneto (ARPA_V) and the Ministry of Agriculture (Ministero delle Politiche Agricole Alimentari e Forestali).
from in-situ sensors (such as infrastructure of agro-meteorological stations), or will be collected through special applications (App), the so-called
„human sensors“, i.e. operators in the ield. Among
these operators, in addition to farmers, volunteer users may also be involved, as individual citizens or students cooperating in the project. According to the latest experiences of citizen science, nowadays spread globally, many volunteers actively
contribute to scientiic research. Furthermore, data
collection by citizens was reported with a higher frequency comparing to data collected by public bodies (Charvat et al., 2014b).
The present article will describe the results achieved so far in building the S4A information and knowledge platform supporting the following objectives of IN-SITU (WP4):
1. To design and implement a Spatial Data Infrastructure (SDI) for the management and sharing of images and products obtained from the processing of remotely sensed data. Additionally, measurements from the sensors, data from existing databases, and agronomic data from in-situ observations acquired by the actors of the agricultural world using smart technologies developed within the project itself.
2. To provide information speciic to the user
proile (public, administration) and location
(farmer) on regional level based on analysis performed on data collected and managed by S4A SDI.
Materials and methods
General Uses Cases of the Space4Agri information and knowledge platform
This section gives an overview of the three use cases based on experts’ knowledge of the domain that have been a foundation for the design and implementation of the S4A information and knowledge platform. The use cases represent
the roles of users and the low of data starting
from acquisition by meteorological stations, sensors on satellites or drones, and experts
in the ield, to further processing to yield
new valuable information, and dissemination by communication channels to targeted stakeholders. The three proposed use cases have been modelled and are described in the following text.
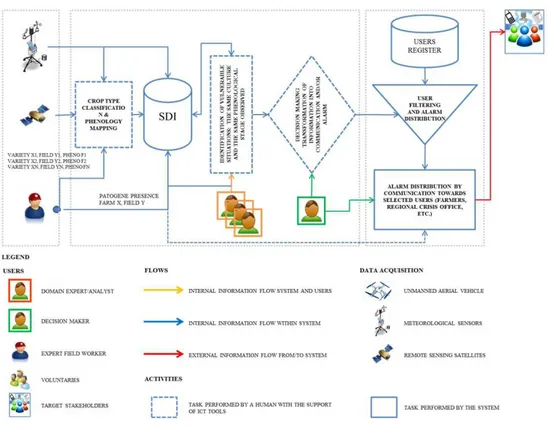
Use case 1. Distribution of authoritative agro meteo information to target users
Figure 1 schematically represents the worklow
of how data from heterogeneous sources are collected, processed, and transformed for allowing the regional operator and the decision
maker, to eficiently visualize and analyze
them in order to provide end users (the public and farmers), with synthetic relevant information on ongoing agro-meteo and crop conditions in the form of bulletins. The dissemination channel must select and send the personalized information using the most suitable means (emails, web portal, and/or sms) that is relevant to each target user.
The worklow is assembled by a starting
phase of data collection by different sources as meteorological stations, satellites, and in-situ by experts and farmers through smart applications installed on their mobile devices. This information is integrated into SDI and processed by experienced researchers/analysts. The outputs of the analysis is turned into knowledge by experts and provided to the decision makers who may exploit it for taking decisions on the policies for the agro sector, and may identify and communicate personalized relevant information to the stakeholders, the public and farmers.
The use case fosters the application of Smart technologies for both collecting in-situ observations (qualitative and quantitative) performed by experienced operators using mobile devices and publishing them in real time on the Internet; it also considers disseminating personalized information to stakeholders based on their interests, type of crops they cultivate, and context, region where their estate is located and current season. Remote observations can be used
for the identiication of anomalies of crop
conditions due, for example, to abiotic and biotic
factors (Hatield, Pinter, 1993; Qin, Zhang, 2005;
Bhattacharya, Chattopadhyay, 2013). Satellite
data can be analysed in conjunction with ield
observations and data acquired by meteorological station networks to produce additional spatially distributed information on crop development (crop phenology), crop status and, with the support of crop growth models, yield forecast (Nouvellon et al., 2001; Doraiswamy et al., 2004).
The inal goal of this use case is the provision
Source: own processing
Figure 1: Schematic representation of the worklow representing the use case 1 (the legend applies all use case diagrams).
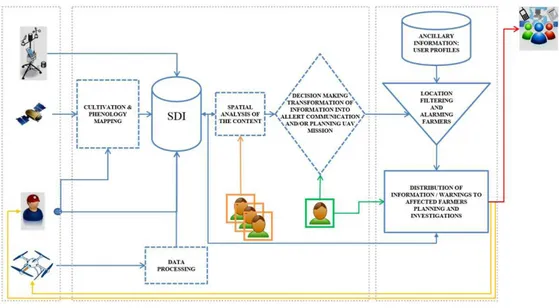
Use case 2. Generation of information on anomalous states of the crop
Figure 2 represents the worklow of how the data
are collected, processed, analysed and transformed for the dissemination of information on anomalous states of the crops. As described in the use case 1
the worklow is assembled by a starting phase
of data collection. The crop typology (Fontanelli et al., 2014) and stages are detected by remote observations through the computation of indicators and/or in-situ observations collected by volunteers (Voluntary contribution by students, citizens). The observations of critical conditions (stress/late season crop) in agricultural areas of the Lombardy region trigger an alert map that is published in S4A SDI thus highlighting that something anomalous might be ongoing. The regions affected by the anomaly shown on the alert map are more closely analysed by experienced researchers/ analysts. The output of the analysis can provide either knowledge on the actual ongoing situation or uncertainties that may require further in-situ
investigations at a local scale in speciic regions, possibly by planning lights of UAVs or ield
surveys, in order to verify if something anomalous is actually occurring. Both knowledge and advices to perform further investigations are delivered via
communication channels to the decision makers so that they may take decisions in the early warning phases and send alerts to the stakeholders on the current critical situation or guide operators
in the ield to check the status of the crops.
Use case 3. Knowledge based forecast of potential critical situations
The worklow schematically represented in igure 3
shows how data are collected, processed, analysed and transformed for communication of knowledge-based forecast of potential future critical situations. As described in the previous use cases
the worklow is assembled by a starting phase
of data collection by Meteorological station, satellites, and by experts. Additionally observations from drones can be included if available. These observations of a critical condition (stress/late season crop) are cross analysed by the expert
with respect to the speciic season drivers
(meteorological and agro-practises) to foresee the possible evolution of a critical situation. The output of the analysis is converted into maps on a possible evolution of the critical situation
of the crops in speciic areas, and is distributed via
communication channels, to the decision makers.
of the forecasts and distribution of possible advices on how to prevent the crisis to target stakeholders.
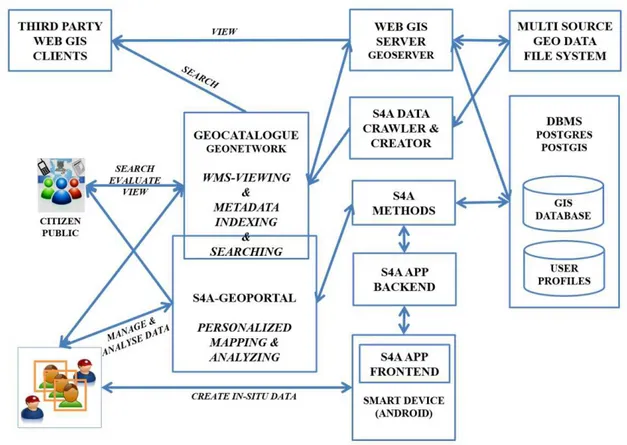
Architecture of the S4A information and knowledge based platform
The overall architecture of the S4A platform
is depicted in igure 4, encompassing also
representations of applications developed
or deployed and conigured to the project needs.
S4A Core Methods component
The core of the platform consists of three
basic layers deined in the computer software
developments. Application layer is an abstraction layer reserved for communications protocols and methods designed for process-to-process communications in the Internet model. Domain layer is the part of the program that encodes
Source: own processing
Figure 2: Schematic representation of the worklow representing the use case 2.
Source: own processing
the real-world business rules that determine how the data can be created, displayed, stored, and changed. Data access layer is a layer
of a computer program which provides simpliied
access to data stored in persistent storage of some kind, such as an entity-relational database. Web service component allows users applications (e.g. S4A mobile application) interacting with the core layers in a standardised REST (Representational state transfer) manner. REST has become a popular method for publishing
Web services as a Web-friendly alternative
to SOAP, which is primarily focused on deining
and addressing web resources (like documents and images) and for managing their representations
(Riva, Laitkorpi, 2009). Web layer encompasses end-user applications allowing human interactions with the platform through the World Wide Web system with a web browser. The core components of the platform are being implemented with Java programming language.
Web GIS server component
In order to provide a straightforward and standardized way of handling different
sources of the geospatial data, a Web GIS server application has been incorporated into the platform architecture. Common set of functionalities for a Web GIS server can be dissemination of maps, query, search, feature editing, transformation, advanced geoprocessing, delivery of Web Services (OGC, REST), in a customizable and scalable way and with acceptable performance measures (Fu, Sun, 2010). Requirements originating from the use cases include management and publication time series of geospatial raster (Remote Sensing images, or outputs from data analysis) and vector (agriculture, meteo data) datasets. Additionally various spatial analysis are requested as well as statistical representations of time-series raster data of vegetation, meteo and other indexes (NDVI, EVI, NDFI). An important component of the S4A platform is a database management system (DBMS). Since the most data relevant for the project are georeferenced, a GIS
database has been deined as a system component.
GIS database allows handling and integrity of spatial data with consistent DBMS through
spatial data formats and functions deinitions
and all this in high performance with high data
Source: own processing
volumes (Fu and Sun, 2010). In order to accomplish the requirements on S4A Web GIS server component, we have used GeoServer opensource software, which is designed to ensure interoperability by publishing data from any major spatial data source using open standards (Giannecchini, Aime, 2013). Relevant geospatial data are being published on S4A GeoServer instance from the data server devoted to remote sensing experts from the institutes involved in the project. Currently products of remote sensing data
as phenology classiication maps of vegetation
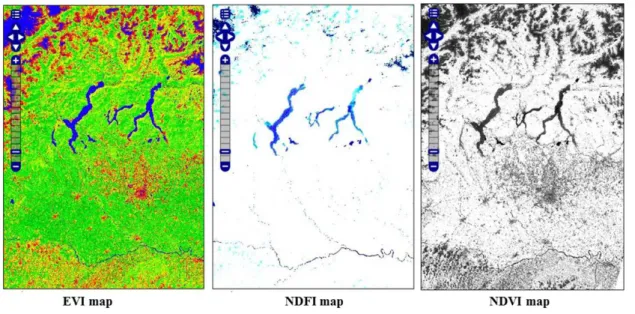
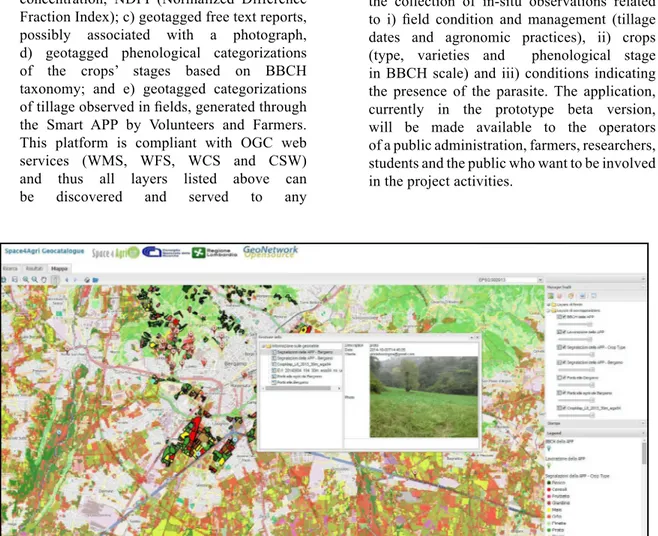
indexes are made available as raster data layers for viewing (WMS – Web Map Service) and downloading (WCS – Web Coverage Service) (Fig. 5).
Vector data of agricultural parcels and observations collected by the smart mobile application are stored in the a GIS database described in the next section and exposed via GIS server in the web, this available for viewing (WMS) and downloading (WFS – Web Feature Service) from within any OGC compliant GIS clients (Fig. 6).
Source: own processing
Figure 5: Raster data published on the web as vegetation and meteo indexes maps via OGC WMS.
Source: own processing
DBMS and S4A database model
The underneath GIS database has been implemented
using PostgreSQL, which is an opensource
object-relational database management system (ORDBMS) with an emphasis on extensibility and standards-compliance. Additionally, it allows to manage geographic objects through its extension – PostGIS, which is opensource and freely available to download and install. PostGIS adds extra data types (geometry, geography and others)
to the PostgreSQL database. It also adds functions,
operators, and index enhancements that apply to these spatial data types. These additional functions, operators, index bindings and types
augment the power of the core PostgreSQL DBMS,
making it a fast, feature-plenty, and robust GIS database management system (Obe, 2011).
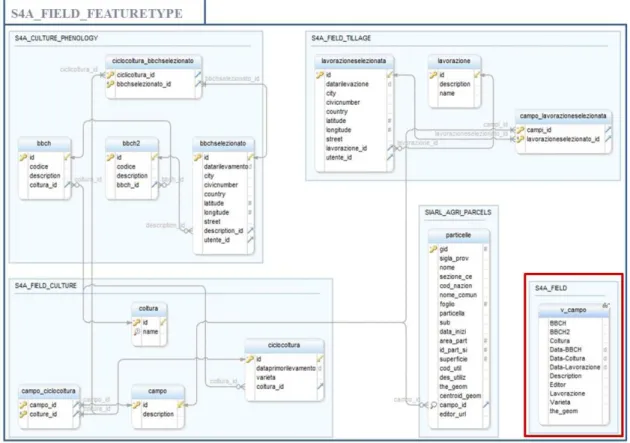
The database model is built on six basic concepts and relationships among them (Fig. 7) modelled
as follows: an agricultural ield (S4A_FIELD_
FEATURETYPE), which represents a piece of territory delimitated by boundaries with information about a tillage status on it (S4A_FIELD_TILLAGE) with an aggregation
of information about a culture type cultivated (S4A_FIELD_CULTURE), phenological stage of the respective culture (S4A_CULTURE_ PHENOLOGY) and geospatial reference of geometry based on existing data about agricultural parcels provided by SIAR Lombardy (SIARL_AGRI_PARCELS). S4A_
CULTURE_PHENOLOGY package is deined
as a list of culture types with crop stages, each one with its own timestamp. It can have a geospatial
reference of a point type or be associated to a ield.
In-situ observations modelled for mobile application can be of three types: (1) General observation of any kind of information related to the project context or beyond; (2) Observation of a phenological status of a particular crop and (3) observation
of tillage on a particular ield. General observation is
modelled by the feature type S4A_OBSERVATION
shown in igure 8. Observations collected by expert users are assigned to a ield based on coordinates and spatial relation to the ields’ boundaries.
On the other hand the observations collected by volunteers are represented as points features
acquired in the ield.
Source: own processing
Source: own processing
Figure 8: Model of the S4A_OBSERVATION_FEATURETYPE covering both expert and volunteer users.
Space4Agri mobile app
Another component integrated into the S4A platform architecture is a mobile application, which provides an interface for users collecting in-site data. A mobile app is a computer program designed to run on smartphones, tablet computers and other mobile devices. The one implemented in S4A has been developed for Android platform. It allows registered users to create information in the form of a free text description, and/or photograph of the land. Additionally, categorized information to specify the crop
type, phenological status and ield tillage can be
collected. The crop status has been implemented on a base of an agronomic ontology - BBCH (Dal Monte et al, 2010).
Geocatalogue
The geocatalogue indexes and maintains metadata records of S4A spatial data and thus allows searching for desired information sources
about a speciic semantics the user is interested
in. This facility is offered to ease the selection based
on a data itness of use, obviously when the volume
will be huge. GeoNetwork opensource software has been used to implement the described functionality. The metadata is created for each dataset published as a WMS layer with Web GIS server described
above, extended by theme speciic information
and made available via publicly available web portal. Geocatalogue application embeds also a geospatial data viewing functionality, which is provided to the user. In this manner, the data can be searched, elaborated and used.
S4A Geoportal
An important component from the user perspective, which is currently in the development phase, is a personalized geoportal application. The geoportal will in addition of advanced functionalities as e.g. time-series data elaboration, data downloader tool, provide a personalized way to access the relevant data based on information stored
in user proiles database. Authorised users will
be able to visualize the content (e.g. agricultural
parcels, or ield observations, thematically
related datasets) linked to their account at the initial login into the geoportal. Geoportal is being developed within the same framework as the core S4A methods components in order
to ensure eficiency in communication to the core
Results and discussion
S4A platform is the result of innovative combination of three components of the
technical-scientiic domain: Technologies Aerospace, Earth
Observations and Geo & Mainstream ICT.
The irst three main ICT results achieved
in the projects at the current state are the following:
1. An Integrated data platform for publishing and serving S4A geospatial data products: this is implemented through the Geoserver toolkit and actually manages a) vector layers of the cadastral parcels of the estates of the farmers involved in the project located in 14 distinct municipalities; b) raster images of indicators which are resulting from remote sensing data analysis, such as NDVI (Normalized Difference Vegetation Index), EVI (Enhanced Vegetation Index), Chlorophyll concentration, NDFI (Normalized Difference Fraction Index); c) geotagged free text reports, possibly associated with a photograph, d) geotagged phenological categorizations of the crops’ stages based on BBCH taxonomy; and e) geotagged categorizations
of tillage observed in ields, generated through
the Smart APP by Volunteers and Farmers. This platform is compliant with OGC web services (WMS, WFS, WCS and CSW) and thus all layers listed above can be discovered and served to any
OGC compliant application with use of CSW, WMS, WFS and WCS interfaces. The main originality of the S4A lies in the integration of authoritative information (e.g. SIARL data), research information (CNR/IREA remote sensing products) and volunteers’ information (collected by S4A app) in an integrated data platform.
2. A catalogue service to search for speciic thematic layers served by the S4A platform with embedded geospatial data viewer to display results of search in an overlay mode in order to facilitate correlations analyses between indicator maps and in-situ
ield observations, textual reports and ields’
practices.
3. A inal important result of the project is the smart app currently available for mobile devices powered by Android, which allows the collection of in-situ observations related
to i) ield condition and management (tillage
dates and agronomic practices), ii) crops (type, varieties and phenological stage in BBCH scale) and iii) conditions indicating the presence of the parasite. The application, currently in the prototype beta version, will be made available to the operators of a public administration, farmers, researchers, students and the public who want to be involved in the project activities.
Source: own processing
Conclusion
The S4A project is in its halftime, thus the results represent the prototype solution, which can be used for the technology transfer in the real implementation in the regional or national agricultural sector. Nevertheless, beta version of the S4A platform components is running and currently in the testing phase. One of the following steps in this respect will be to introduce the S4A platform and particularly the S4A APP to voluntary farmers and students of agricultural high schools in the region as potential representatives of volunteers in order to provide a test-bed of the S4A products as well as support educational process.
Additionally, the remote sensing experts discovered advantages of having their data published through an SDI, thus they tend to provide more data for publishing almost on a daily basis. As an example, instead of searching for data
in the ile system of the data server (e.g. IREA data server has capacity 100TB and more than 90% is
used), they may use an SDI catalogue to search and OGC services to use the data directly
in their tools (e.g. GIS clients as QGIS) that the use
on a daily base.
The S4A project has shown already quite high potential of integrating the geo and mainstream ICT into a common platform, while developing
a complex information system for a speciic domain,
e.g. agricultural sector.
The data available through the S4A platform may
signiicantly support regional administration,
which is distributing funds among farmers,
in the veriication process. Farmers’ declaration
versus analysed status resulting from a combination of heterogeneous data sources as remote sensing products, in-situ observations collected by mobile devices and monitoring data acquired from UAV
missions. The inal score may bring signiicant
savings of public sector expenses as well as join forces together in order to enhance the current situation in agricultural sector, and not only there.
Acknowledgements
„This work has been conducted in the frame
of Progetto Space4Agri supported by AQ-Regione Lombardia-CNR, Convenzione Operativa n. 18091/
RCC, 05/08/2013)“
Corresponding author: Ing. Tomáš Kliment, PhD.
The National Research Council of Italy, Institute for the Dynamics of Environmental Processes (CNR-IDPA) Via Mario Bianco, 9, 20131 Milan, Italy
E-mail: [email protected]
References
[1] Acutis, M., Alieri, L., Giussani, A., Provolo, G., Di Guardo, A., Colombini, S., Bertoncini, G., Castelnuovo, M., Sali, G., Moschini, M., Sanna, M., Perego, A., Carozzi, M., Chiodini, E. M., Fumagalli, M. ValorE: An integrated and GIS-based decision support system for livestock manure management in the Lombardy region (northern Italy). Land Use Policy, 2014, November, Vol. 41,
p.149-162, ISSN 0264-8377.
[2] Batchelor, S., Scott, N., Valverde, A., Manfre, C., Edwards, D. Is there a role for Mobiles to support Sustainable Agriculture in Africa? Proceedings of the 2nd International Conference on ICTs
for Sustainability, 2014, July, Atlantis Press, 9p. ISBN 978-94-62520-22-6.
[3] Bhattacharya, B. K, Chattopadhyay, C. A multi-stage tracking for mustard rot disease combining surface meteorology and satellite remote sensing. Computers and Electronics in Agriculture, 2013,
January, Vol. 90, p. 35–44. ISSN 0168-1699.
[4] Brown, J.F., Pervez, M.S. Merging remote sensing data and national agricultural statistics to model change in irrigated agriculture. Agricultural Systems, 2014, May, Vol. 127, p. 28–40. ISSN 0308-521X.
[5] Charvat, K, Mildorf, T., Tuchyna, M., Vohnout, P., Krivanek, Z. SDI4Apps. IST-Africa Conference
[6] Charvat, K., Esbri, M.A., Mayer, W., Charvat, K., Campos, A., Palma, R., Krivanek, Z. FOODIE
– Open Data for Agriculture. IST-Africa Conference Proceedings, 2014a, May, IEEE, p. 1-9. ISBN 978-1-905824-43-4.
[7] Dal Monte, G., Epifani, C., Alilla, R., Godino, F., Gildi, G. Fenologia e cambiamenti climatici: le attività del progetto Agroscenari. Atti del XIII Convegno nazionale di Agrometeorologia. 2010,
June, p. 71-72. ISBN 978-8-855530-81-1.
[8] Doraiswamy, P., Hatield, J., Jackson, T., Akhmedov, B., Prueger, J., Stern, A. Crop condition and yield simulation using Landsat and MODIS. Remote Sensing of Environment, 2004, September,
Vol. 92, p. 548– 559. ISSN 0034-4257.
[9] Fu, P., Sun, J. Web GIS: principles and applications. Esri Press, 2010, October, 312 p.
ISBN 978-1589482456.
[10] Fontanelli, G., Crema, A., Azar, R., Stroppiana, D., Villa, P., Boschetti, M. Agricultural crop mapping using optical and SAR multi-temporal seasonal data: a case study in Lombardy region,
Italy. Geoscience and Remote Sensing Symposium (IGARSS), 2014 IEEE International, Quebec City, QC, Canada, 2014, July, p. 1489-1492. ISBN 978-1-4799-5774-3.
[11] Giannecchini, S., Aime, A. GeoServer, the Open Source server for interoperable spatial data
handling. SDI 2013 Proceedings, Republic of Croatia – State Geodetic Administration, Zagreb, Croatia, 2013, September, p. 14-22. ISBN 978-953-293-519-6.
[12] Han, W., Yang, Z., Di, L., Mueller, R. CropScape: A Web service based application for exploring and disseminating US conterminous geospatial cropland data products for decision support.
Computers and Electronics in Agriculture, 2012, June, Vol. 84, p. 111-123. ISSN 0168-1699.
[13] Hatield, P. L, Pinter Jr., P. J. Remote sensing for crop protection. Crop Protection, 1993, September,
Vol. 12, 6, p. 403–413. ISSN 0261-2194.
[14] Kaivosoja, J., Jackenkroll, M., Linkolehto, R., Weis, M., Gerhards, R. Automatic control of farming operations based on spatial web services. Computers and Electronics in Agriculture, 2014, January,
Vol. 1000, p. 110-115. ISSN 0168-1699.
[15] Lackóová, L., Halászová, K., Kliment, M., Urban, T. Wind erosion intensity determination using soil particle catcher devices. Journal of Central European Agriculture, 2013, Vol. 14, 4,
p. 1364–1372. ISSN 1332-9049.
[16] Nouvellon, Y., Moran, M.S., Lo Seen, D., Bryant, R., Rambal, S., Ni, W., Bégué, A., Chehbouni, A.,
Emmerich, W. E., Heilman, P., Qi, J. Coupling a grassland ecosystem model with Landsat imagery
for a 10-year simulation of carbon and water budgets. Remote Sensing of Environment, 2001, April,
Vol. 78, p. 131-149. ISSN 0034-425.
[17] Obe, O., R., Hsu, S., L. PostGIS in action. Manning Publications Co., 2011, April, 520 p.
ISBN: 9781935182269.
[18] Qin, Z., Zhang, M. Detection of rice sheath blight for in-season disease management using multispectral remote sensing. International Journal of Applied Earth Observation and Geoinformation, 2005,
August, Vol. 7, 2, p. 115–128. ISSN 1569-8432.
[19] Riva, C., Laitkorpi, M. Designing web-based mobile services with REST. Service-Oriented
Computing - ICSOC 2007 Workshops, 2009, Vol. 4907, p. 439-450. ISSN 0302-9743.
[20] Seelan, S. K., Laguette, S., Casady, G. M., Seielstad, G. A. Remote sensing applications for precision agriculture: A learning community approach. Remote Sensing of Environment, 2003, November,