Abstract— In 2007, Intel Assembly and Test Manufacturing (ATM) sites was given a challenge by ATM management to do direct labor productivity to meet 2.6 DL/Tool ratio. Intel Assembly and Test Manufacturing (ATM) sites have always followed the same methodology in defining labor requirement using Man-Machine Ratios (MMR) for several years now. However, to meet 2.6 DL/Tool target, a new approach must be employed to maximize labor productivity and efficiency resulting to lower direct labor requirement. This paper aims to discuss the success story of Cavite Assembly and Test (CVAT) in employing a new approach in direct labor forecasting through area profiles and Equipment Manning Time (EMT). A Linear Programming Model was also used to optimize direct labor allocation to minimize the idle time of direct labor.
Index Terms— Labor Productivity, Labor Utilization, Area Profile, Equipment Manning Time
I. INTRODUCTION
In Intel Assembly and Test Manufacturing (ATM) sites, DL/Tool is the official indicator for headcount across ATM [1]. It is simply the ratio of total direct labor (DL) over the total tool requirement [1].
In Intel manufacturing sites, manufacturing specialist (MS), manufacturing technician (MTE) and fix headcount are considered as direct labor. Thus, to compute for the DL/Tool performance of a site, equation (1) should be used.
quirement Tool
nt FixHeadcou MTE
MS Tool DL
Re
/ = + + (1)
To meet the 2.6 DL/Tool ratio target, Cavite Assembly and Test (CVAT) ventured out on different productivity efforts to reduce overall direct labor requirement of the factory. The primary objective is to maximize Labor Utilization (LU) of
Manuscript received October 9, 2007. This work was supported by Intel Technology Philippines, Inc.
A.Y. Fong is with the Industrial Engineering Department , Intel Technology, Cavite, Philippines (phone: +639209381579; email:
M.Z.B. Santiago is with the Industrial Engineering Department , Intel Technology, Cavite, Philippines (phone: +63906327326; email:
manufacturing personnel without sacrifice of their safety, quality and delivery performance.
The succeeding sections will discuss the logic, theories and methodology applied to achieve the objective resulting to overall direct labor requirement improvement.
II. THEPROBLEM
Assembly and Test Manufacturing sites have always followed the same methodology in defining direct labor requirement using Man-Machine Ratios (MMR) for several years now. Direct labor requirement was derived from tool requirement and Man-Machine Ratios (MMR). Man-Machine Ratios (MMR) is used to identify how many machine resources a Manufacturing Specialist (MS) and Manufacturing Technician (MTE) can support considering the labor activities that needed to be done. Simply put, Man-Machine Ratio (MMR) is same as DL/Tool concept which is the ratio of direct labor used to operate a machine. Equation (2) shows the standard formula for defining headcount requirement using MMR.
(
Re)
4Re x
n Utilizatio hour Man MMR
quirment Tool
quirement Labor
×
= (2)
Take note that equation (2) also takes into account a Man-Hour Utilization (MHU) factor for absenteeism allowance.
Given the challenge of meeting 2.6 DL/Tool target, Cavite Assembly and Test (CVAT) needs to find a way to make direct labor more productive and efficient. The goal of 82% utilization per direct labor per shift must be attained for all to improve DL/Tool of 3.4 last Q4’06.
III. REVIEW OF RELATED LITERATURE
In Intel, majority of the machines are automatic or partially automatic which requires some degree of assistance from direct labor during production. This is because Intel’s production system is an equipment-paced production system. An equipment-paced line flow production system provides fast and reliable delivery of products where machines on the production line are synchronized [2]. In addition to this, Operators perform relatively simple tasks that are synchronized with machine operations [2]. As such, it is important to understand relationships between machines,
A Paradigm Shift in Achieving 2.6 DL/Tool
Through an Efficient Labor Modeling Using
Equipment Manning Time
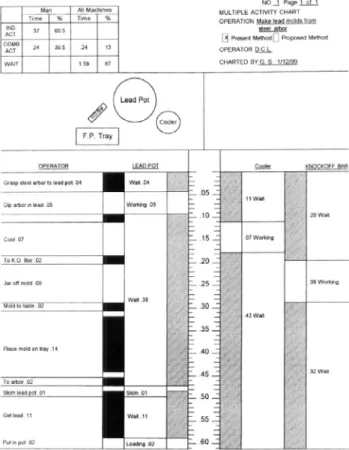
direct labor and processing time before doing any improvement so that delivery and quality won’t be impacted. If there is an interaction between man and machine, a normal academic approach in analyzing their relationship is through Person-Machine or Multiple Activity Charts. The person-machine chart portrays the element-by-element interaction between one or more operators and one or more machines [3]. The primary purpose of any multiple activity (person-machine) charts is to identify idle time that can be eliminated [4]. Idle time to be eliminated is both for man and machine to improve productivity. Figure 1 shows a sample of Person-Machine or Multiple Activity Charts [3].
Figure 1. Person-Machine or Multiple Activity Chart
In Intel, I came up with a system dynamics model to illustrate man-machine relationships shown in Figure 2 based on our environment.
Const ant at 82% Const ant at 82%
Figure 2. System Dynamics Model for Labor Productivity
It was mentioned earlier in this section that Intel is an equipment-paced production system. In this model, changes in machine utilization due to downtimes directly affect the utilization of a direct labor. As machine utilization becomes worst, utilization of direct labor increases depending on the technical ability needed in fixing the machine problem. Machine specialists (MS) are responsible for fixing simple errors while technicians (MTE) are responsible for major repairs and preventive maintenance.
Also, processing time of a product in a machine will increase or decrease depending on machine stability. When processing time increases, labor utilization will likely to become lower due to waiting time for repairs to be finished and vice versa. In the end, depending on the labor utilization of direct labor, the optimum Man-Machine Ratio (MMR) will be defined.
Labor Utilization (LU) is the percentage of productive time over the total time per shift of manufacturing personnel. Figure 3 shows the illustration of the Labor Utilization (LU) concept.
Figure 3. Labor Utilization (LU) Concept
how tasks are performed and improve it. For Cavite Assembly and Test (CVAT), direct labor utilization can only be at 82% maximum per shift equivalent to 9.82 hours in consideration to break times and shift meetings required. It is, therefore, essential that tasks to be done by direct labor in a shift per tool don’t exceed this value.
The most universally recognized and widely used form of process representation is the flow process chart [3]. Flow process chart can be used to compare alternative methods of performing individual operations or groups of operations [5]. By considering different flow process chart scenarios, we can make recommendations for improvement of direct labor task performance. Flow process charts consider 5 activity elements listed, standardized by the American Society of Manufacturing Engineers (ASME) [3].
1. Operation – An operation is an intentional change in the physical or chemical characteristics of an object; the receipt or dissemination of information; the making of calculations or plans.
2. Inspection – an inspection is the examination of an object or group of objects to verify that they have characteristics or to ascertain their quantity.
3. Transportation – Transportation is the movement of an object from one location to another; it does not include movements that are part of an operation or inspection. 4. Delay – A delay is any occurrence that prevents the
immediate performance of the next planned activity. 5. Storage – Storage is an intentional delay in which an
object is kept and protected against unauthorized removal.
Figure 4 shows the widely used symbols for flow process charts [6].
Figure 4. Standard ASME Symbols
Aside from improving labor utilization, there is also the need of addressing attrition rate. Some behavioral scientists argue that assembly line jobs are boring and monotonous and that the workers are not satisfying their needs for socialization, self-esteem and self fulfillment on these jobs [5]. This, according to studies, results to higher attrition rate and absenteeism.
The monotonous and boring perception of work in assembly lines was believed to be caused by job specialization in which
each employee performs only a particular narrowly defined task [4]. Several proposals for modifying specialized jobs are as follows [5]:
1. Cross-training – Training workers to perform several jobs so that they can be moved from job to job as needed. 2. Job enlargement – Adding additional similar tasks to
workers’ jobs; this is referred to as horizontal job enlargement.
3. Job enrichment – Adding more planning, inspecting and other management function to workers’ job; this is referred to as vertical job enlargement.
4. Team production – Organizing workers into work teams; selecting workers and training them to work in teams; assigning some responsibility for management of production to teams.
Among these four (4) proposals, three (3) are already being applied in Cavite Assembly and Test (CVAT) except for job enlargement. In job enlargement, an employee’s job is expanded to include several tasks to allow a person to see that they are making a meaningful contribution to an entire product [4]. In addition to this, they will be challenged to new sets of tasks to be performed while at work.
A. Synopsis
It is important to note that there are already various tools and techniques which are tried and tested in the real world setting which we can apply to improve direct labor requirement. What’s interesting to be done is to find a way to increase labor utilization by minimizing idle time of workers, at the same time, promote job enlargement.
IV. IMPROVEMENT PHASE
Since Q4’06 to date, CVAT is engaged on various direct labor improvement studies with focus on MMR and Fix headcount improvement using tools and techniques mentioned in the previous section. The idea is to have a leaner direct labor with high labor utilization without sacrificing their safety, quality and delivery performance. In this section, the methodology used to achieve the objective will be discussed.
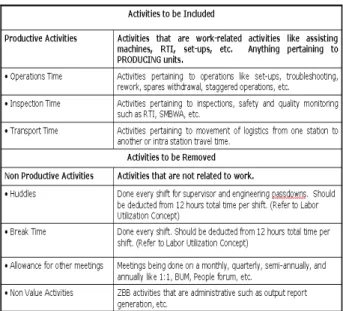
A. The Concept of Area Profile
2 on the next page shows the activities considered in area profiles.
Table 2. Area Profile Activities
Another difference of flow process chart to area profiles is the use of training certification levels in every task. Using training certification levels will help ease preparing for job training plans for employees. At the same time, having training certification level required per task will clearly define the Equipment Manning Time (EMT) required for a particular operation. Equipment Manning Time (EMT) is the term for the time it takes for a skilled direct labor to operate a tool in a shift (hrs/shift/tool) considering the repetitive tasks they are trained to do.
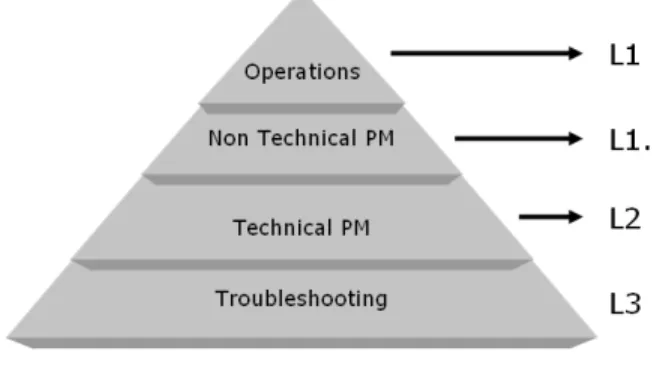
Training certification levels are as follows:
1. Level 1 (L1) – job capability involves operations activities only including lot set-up and machine set-up, moving lot between stations and real-time inspections. 2. Level 1.5 (L1.5) – job capability involves operations
activities and non-technical preventive maintenance including 5S, machine parameter checklists and changing of minor machine parts.
3. Level 2 (L2) – job capability involves operations activities and preventive maintenance including technical and non technical preventive maintenance tasks.
4. Level 3 (L3) – job capability involves operations, preventive maintenance (technical/non-technical), and machine troubleshooting.
There is a need for training certification levels because some activities will require highly technical skill and knowledge in order to be performed. Due to this limitation, not all direct labor can be considered to be trained on all levels. But still, with area profiles, job enlargement and maximizing labor utilization of direct labor can be achieved.
B. Area Profile Methodology
It only takes three (3) steps in doing the Area Profiles for a particular station. The steps are sequentially listed below: Step 1: List down all current labor activities for each operation including time per activity and identify MT Certification Level required to perform activity. Table 3 shows sample.
Table 3. Sample Area Profile Step 1
Step 2: Convert time per element to hrs per shift per tool and multiply by 15% allowance factor for Fatigue, Personal Delays and Unavoidable Delays. Table 4 on the next page shows sample.
Table 4. Sample Area Profile Step 2
Figure 5. MTE Certification Level Hierarchy
C. Optimizing Direct Labor Requirement Forecasting Using Linear Programming Model
Developing an area profile and calculating the Equipment Manning Time (EMT) per station is not enough to maximize labor utilization. There is still an opportunity to further improve direct labor requirement using an LP model to find the best number of Level 1, 1.5, 2 and 3 employees to run a particular station.
We start of by defining the set and decision variables used in the model with corresponding notation below.
Set:
i – refers to the certification level
EMTi - refers to the Equipment Manning Time (EMT) of a direct labor with training certification level i
TR - refers to the Tool Requirement based on committed capacity for a particular quarter.
Decision Variable
i – refers to the certification level
Li - refers to the number of direct labor with training certification level i
Ti – refers to the number of tools to be handled by direct labor with training certification level i
Next, we proceed with formulating the model itself. Equation (3) below defines the objective function of the model. The overall objective of the model is to minimize direct labor idle time given the Equipment Manning Time (EMT) and tool requirement.
(
) (
)
[
]
∑
−=level
i
EMTixTi xLi
x Idle
Min_ 82% 12 (3)
Where:
82% - Labor utilization goal
12 hours per shift – Total time per shift
After the objective function, the constraints will now be defined. Equation (4) below is the Tool Allocation
Constraint. This ensures that the tool allocation total will not exceed the tool requirement committed in capacity per week in a quarter.
∑
=Level
i
TR
Ti (4)
Equation (5) below defines the Idle Time Non-Negativity Constraint. This ensures that expected idle time per training certification level will not have a negative value.
(
) (
)
[
82%x12xLi − EMTixTi]
>=0 (5)Equation (6) below defines the Direct Labor Allocation Constraint. This ensures that direct labor allocated per training certification level will have a minimum initial value of 1.
1 >=
Li (6) Equation (7) below defines the Tool Allocation Non-Negativity Constraint. This ensures that tool allocated per training certification level will not have a negative value.
0 >=
Ti (7) Equation (8) below is a conditional statement that must be applied in the LP model after running solver. This ensures that equation (6) and (7) won’t conflict each other.
) _ , 0 , 0
(Ti Li no change
If = = (8)
V. IMPLEMENTATION PHASE AND RESULTS
In the previous section, the LP model was presented in detailed mathematical equation. Next step now is to embed the equations to Microsoft Excel. Below are the four (4) steps used by Cavite Assembly and Test (CVAT) in forecasting direct labor using the LP model.
Step 1: Input Equipment Manning Time (EMT), Man-Hour Utilization (MHU) and tool requirement based on committed capacity in Microsoft Excel model. Figure 6 shows a screen shot for this step.
EMT1 2.457282
EMT1.5 2.592475
EMT2 4.813352
EMT3 5.920658
MHU 0.9
Q4'07 Q1'08 Q2'08 Q3'08 Q4'08
Tool Req't 22 22 20 24 25
Figure 6. Excel Screen Shot of Data Input
Figure 7. Excel Solver Screen Shot
Step 3: Apply Man-Hour Utilization (MHU) of 90% absenteeism factor and round up if the number has a decimal of greater than or equal to 0.2. This will result to the final direct labor requirement per team.
Step 4: Multiply rounded direct labor requirement per team by 4 teams to get overall direct labor requirement.
As a result of the overall DL productivity effort of Cavite Assembly and Test (CVAT), the following results were realized.
Direct Labor Savings. 411 heads was saved from direct labor requirement and we are still working out more. Table 5 shows the breakdown of savings to date.
Table 5. Direct Labor Savings
Projects Savings
MMR Improvement 279
Fix Headcount 28
Area Profile Optimization 104
Total 411
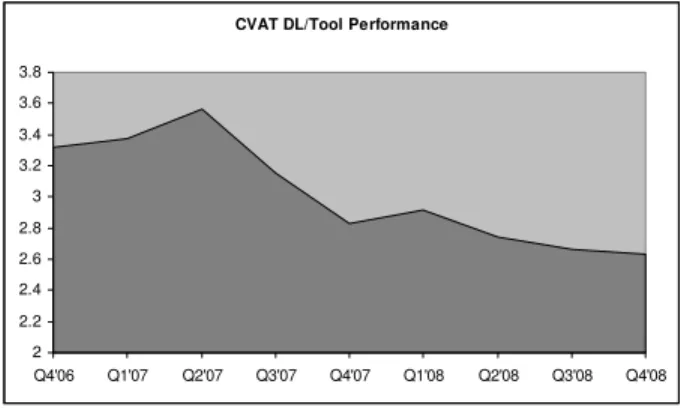
Improved DL/Tool Indicator. Forecasted to achieved a 2.63 DL/Tool based on requirement which is our lowest ever coming from a high of 3.4 back in Q4’06.
CVAT DL/Tool Performance
2 2.2 2.4 2.6 2.8 3 3.2 3.4 3.6 3.8
Q4'06 Q1'07 Q2'07 Q3'07 Q4'07 Q1'08 Q2'08 Q3'08 Q4'08
Figure 8. CVAT DL/Tool Trend
Better Development Plan for Employees. As an effect of being able to quantify Level 1, 1.5, 2 and 3 direct labor requirements, training of employees are underway which is expected to improve employee morale and technical capability.
VI. CONCLUSION AND RECOMMENDATION
In this paper, the authors discussed the concept of DL/Tool and its definition, the challenges the factory faced in order to meet the 2.6 DL/Tool target and the solution derived from literatures.
For the solution, the logic, theories and methodology applied to achieve overall direct labor requirement improvement was discussed in detail including the method of developing area profiles and calculating for Equipment Manning Time (EMT). It was clearly pointed out that area profiles and flow process charts are generally the same except for the training certification level being indicated and activities causing delay being removed from the task.
The linear programming model formulated and new direct labor forecasting method using Equipment Manning Time (EMT) was also discussed. The purpose of using the LP model is to calculate the best number of Level 1, 1.5, 2 and 3 to run a particular station.
As a result of all this, Cavite Assembly and Test (CVAT) were able to achieve 411 direct labor savings. Furthermore, an improved DL/Tool indicator at 2.63 DL/Tool based on direct labor requirement was realized. This is a big improvement from a high of 3.4 back in Q4’06. Aside from this, better development plans for employees are underway to improve morale and technical skills in the factory.
In conclusion, the approach made by Cavite Assembly and Test (CVAT) for direct labor improvement reaped good results. The tools, techniques and methodology, although simple and known across the world, can be more effective if combined together. It is, therefore, recommended that the approach of Cavite Assembly and Test (CVAT) be implemented to other Intel sites and other industries for additional evaluation in terms of effectiveness.
ACKNOWLEDGEMENTS
• Cavite Industrial Engineers namely Vince Banas, Jason Averia, Sarah Madrinan, Zalvi Santiago, Sharmy Lamasan, Mark Rogio, Arpi Quiray and Ava Gomez for contributing to direct labor improvements in their areas.
• Cavite Manufacturing Engineers and Training namely Ritchell Malasmas-Tumulak, Joan Binag Tess Dimapilis and Edwin Javier for their support in implementing solutions proposed in the production line.
• Module team leaders namely Toss Villamil, Ricky Diwa, Teddy Chua, Larry Hipolito, Emerson Chua, Mike Fadreguilan, Rommel Gloria, Chris Sumague, Rey Adriano and Bhogie Villanueva for their effort in finishing detailed area profiles.
• Ria Valino, Ruth Consolacion, Ed Herrera and Nonoy Magnaye for the guidance and providing inputs as needed.
REFERENCES
[2] J. Miltenburg, “Manufacturing Strategy: How to Formulate and Implement a Winning Plan, 2nd Edition,” Productivity Press, New York, NY, 2005, p 410-411.
[3] K. Zandin, “Maynard's Industrial Engineering Handbook, Fifth Edition,” McGraw Hill, New York, NY, 2001, p 17.9.
[4] M. Vonderembse and G. White, “Operations Management Concepts, Methods, and Strategies, Third Edition,” West Publishing Company, St. Paul, MN, 1996, p 428-435.
[5] N. Gaither, “Production and Operations Management, Seventh Edition,” Wadsworth Publishing Company, Belmont, CA, 1996, p 145, 611-615. [6] M. Armstrong, “Handbook of Management Techniques, Revised Third
Edition,” Kogan Page, Philadelphia, PA, 2006, p 614. Intel®
is a registered trademark of Intel Corporation or its subsidiaries in the United States and other countries.
![Figure 4 shows the widely used symbols for flow process charts [6].](https://thumb-eu.123doks.com/thumbv2/123dok_br/16401877.193637/3.918.182.376.733.896/figure-shows-widely-used-symbols-flow-process-charts.webp)