Annals of the University of Petroşani, Economics, 12(1), 2012, 193-204 193
ANALYSE OF LABOR FORCE MOBILITY PHENOMENOM
ON ROMANIAN INTERNAL MARKET
LUCIAN-ION MEDAR, IRINA- ELENA CHIRTOC
*ABSTRACT: Labor force mobility is an increasingly important component of contemporary society and equally adjustment tool imbalances in labor markets. The phenomenon of labor mobility is nowadays the most dynamic form of movement of potentially active population. Using cluster analysis this paper aims to highlight the relationship between economic and regional development of counties and the phenomenon of internal labor mobility. Labor mobility is both an explanatory factor of economic development and its effect or result, based on the natural desire of individuals to increase income and improve quality of life by changing jobs, which could contribute to GDP growth and economic growth.
KEY WORDS: inter-region mobility; region development; clusters; labour market; dendrogram.
JEL CLASSIFICATION: J24; O18.
1. LABOR FORCE MOBILITY THEORIES
To labor mobility theory there are many approaches to influencing factors of
this phenomenon.
Thus, neoclassical macroeconomic theory argues that neoclassical differences between demand and supply of labor, between origin and destination zones determines the mobility flows and also, the reducing or removing of these differences will lead to reduced mobility until it reaches to nothingness. According to this theoretical approach, only the labor market represents the mechanism through is induced mobility.
Micro theory of neoclassical economics focuses on potential individual actors who decide to migrate, taking into account cost-benefit calculations which show a net benefit generated by mobility. According to this theoretical approach, increasing
* Prof., Ph.D., Constantin Brâncuşi University of Tg- Jiu, Romania, [email protected]
194
Medar, L.I.; Chirtoc, I.E.
mobility is generated, on the one hand, by human capital characteristics that increase the potential benefits of mobility, and on the other, by individual social and technological factors, which reduce costs. Mobility key explanatory variables are determined by differences in incomes and labor force employment rates.
To the new economic theories mobility are group or family strategies whose
major objectives aimed at diversifying sources of income, minimize risk households, overcoming some difficulties to loan repayments and capital maintenance. Differences of wages and incomes, according to this theory, is not a necessary condition for mobility and economic development in the area of origin or reducing disparities are not factors of driving migration flows.According to dual labor market model, the volume, the structure and dynamics of migration flows are determined by the demand for low skilled labor in industrialized areas.
Global structural theory assumes that intensification of relations between developed areas and developing channels of globalization (trade, communications, infrastructure, science, culture, internet, environmental) is a contributing mobility factor, which leaves its mark on differences in income, unemployment, working conditions and the nature of the business area.
2. ISSUES OF REGION LABOR MARKET
We believe that the relationship between labor mobility and economic growth of each region should be analyzed taking into account the dynamic complexity of interdependencies factor between the two processes.
Labor mobility is a complex phenomenon involving the movement between employees, between occupations and in different career levels, between different types of contracts, as well as inside or outside labor market.
Analysis of the scale and nature of labor mobility between regions of the country emphasizes that the phenomenon vary significantly between the country counties.
Mobility phenomenon considered an important factor in stimulating productivity and regional economic growth, is not only eased by regulations on the labor market, but the ability of the economy to generate jobs.
Form of voluntary labor mobility, which seems to be more beneficial than involuntary, both from socially and economically point of view is closely linked to the
employment and unemployment level.
In the case of internal mobility, the higher incomes and benefits realized by those involved in this phenomenon remain at home country and there is no doubt about the positive effect of the phenomenon on indicators of economic growth (GDP) of that country.
Because labor markets are located in different spatial locations it is possible to resolve discrepancies between demand and supply of labor by its mobility (permanent or temporary mobility)
Analyse of Labor Force Mobility Phenomenom on Romanian ... 195
1691
‐516
‐4628 ‐
2067 ‐1436
7205
‐2602
2353
‐6000
‐4000
‐2000 0 2000 4000 6000 8000
North-West Center North-East South-East South -Muntenia
Bucureşti -Ilfov
South -West Oltenia
West
depending on the characteristic of Romanian regions in terms of economic and regional development
Regional development is a concept that aims to stimulating and diversifying economic activities, encouraging private sector investment, helping to reduce unemployment and ultimately improve living standards. Policy could be applied to regional development in Romania was established eight regions, each comprising several counties.
Socio-economic changes that have occurred nationally in the evolution and population dynamics, occupational mobility, social exclusion and active integration in the new economy have manifested itself in the regions of Romania. From national studies can draw the conclusion that demographic decline is irreversible and occupational mobility is higher in urban areas.
Along to direct and other factors whichinfluence the mobility of labor force, this is influenced by the region development of Romania which is presented as a intricately structure to under region structure ( all the regions are made by develloped areas, weak or even weak develloped).
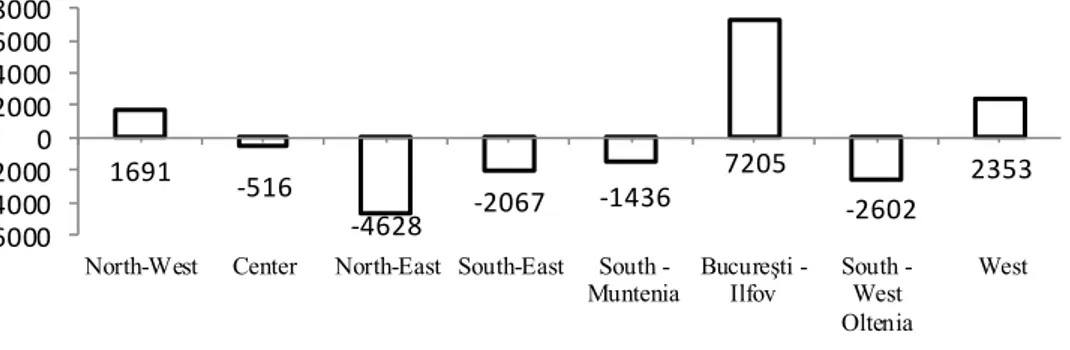
For an real analysis from Romanian Statistical Yearbook we took from Figure no.1 the balance of mobility on regions.
Figure 1. The balance of region mobility 2009
Source: Romanian Statistical Yearbook
From balance mobility analysis by region it shows that areas that attract labor are Bucharest-Ilfov (balance 7205), West (balance 2353), North - West (balance 1691). At the opposite pole is North - East where the number of people leaving the region is quite high and the balance in 2009 mobility is - 4628. If we follow the statistics that mobility is observed in terms of urban and rural environments in the regions recorded a positive balance at rural and urban level negative balance except Bucharest-Ilfov region. Positive balance in rural areas compared to urban population can be explained by the option to travel in rural areas for the conduct of low level agriculture.
196
Medar, L.I.; Chirtoc, I.E.
unemployment rate is the lowest in the region Bucharest - Ilfov (4%), followed by the North - East (5.6%) and Western region (6%). Also growth indicator GDP / capita also has the highest values in the same regions described above (Bucharest-Ilfov: 58060.6 millions lei; West: 25979.6 millions lei; Northwest: 21284.3 millions lei).
Area that attracts most foreign direct investment according to the report "Foreign direct investments in Romania in 2009" issued by NBR is Bucharest-Ilfov region they reach a value of 31.699 million euros. To a considerable difference on this indicator is the North - East region with only 975 million euros.
Indicators of transport infrastructure have the highest values in the region Bucharest-Ilfov, this being the most important country national and international transport road - rail – air hub.
Although this region has not the largest number of schools in the country, is the most important educational center of Romania. Here are the most important academic environment in Romania and concentrate the largest number of students enrolled in higher education.
3. CLUSTER ANALYSIS AND MOBILITY PHENOMENOM
Through cluster analysis seeks grouping Romanian counties through a series of attributes in a limited number of homogeneous classes. Counties of the same class should be as similar to each other by the values of variables while classes are formed as different.
It aims in this way minimizing residual variance within classes and
maximize variance obtained between the classes.
The method uses two types of classification techniques, namely hierarchical and un-hierarchical. In this paper work we used a hierarchical method which is based on the variance method (Ward's method), which generates groups by minimizing the variance within each group.
Hierarchical clustering is a way to investigate groups (clusters) by creating a "cluster tree" with several hierarchical levels, where clusters at one level are organized as clusters at the next level.
Groups need to be defined similarity and dissimilarity measures between counties studied. Similarity or difference between them is expressed by Squared Euclidean Distance.
In order to determine the number of groups we used the classification threshold. This is the grouping level from which groups created can be considered very heterogeneous, and below this threshold is considered to be homogeneous groups. The choice of this threshold is much easier to dendrogram, the graphical representation of the groups obtained.
Analyse of Labor Force Mobility Phenomenom on Romanian ... 197
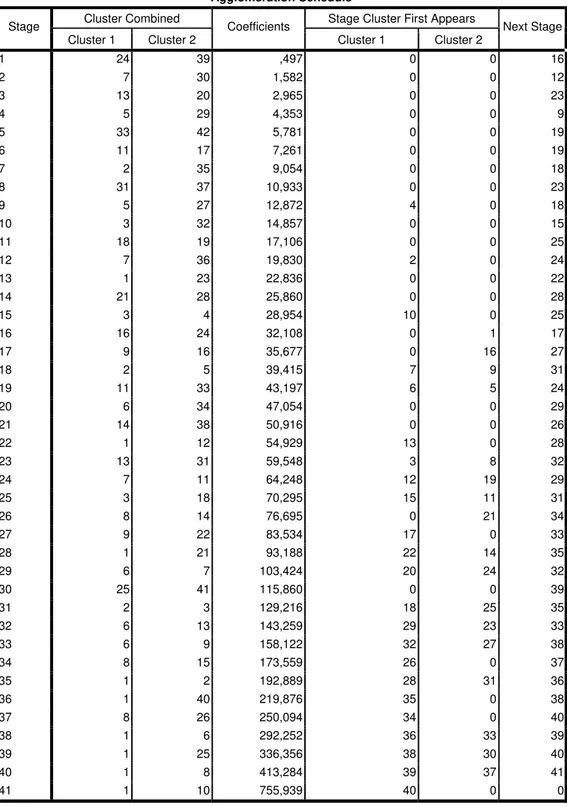
Figure 2. Clusters forming Agglomeration Schedule
Cluster Combined Stage Cluster First Appears
Stage
Cluster 1 Cluster 2
Coefficients
Cluster 1 Cluster 2
Next Stage
1 24 39 ,497 0 0 16
2 7 30 1,582 0 0 12
3 13 20 2,965 0 0 23
4 5 29 4,353 0 0 9
5 33 42 5,781 0 0 19
6 11 17 7,261 0 0 19
7 2 35 9,054 0 0 18
8 31 37 10,933 0 0 23
9 5 27 12,872 4 0 18
10 3 32 14,857 0 0 15
11 18 19 17,106 0 0 25
12 7 36 19,830 2 0 24
13 1 23 22,836 0 0 22
14 21 28 25,860 0 0 28
15 3 4 28,954 10 0 25
16 16 24 32,108 0 1 17
17 9 16 35,677 0 16 27
18 2 5 39,415 7 9 31
19 11 33 43,197 6 5 24
20 6 34 47,054 0 0 29
21 14 38 50,916 0 0 26
22 1 12 54,929 13 0 28
23 13 31 59,548 3 8 32
24 7 11 64,248 12 19 29
25 3 18 70,295 15 11 31
26 8 14 76,695 0 21 34
27 9 22 83,534 17 0 33
28 1 21 93,188 22 14 35
29 6 7 103,424 20 24 32
30 25 41 115,860 0 0 39
31 2 3 129,216 18 25 35
32 6 13 143,259 29 23 33
33 6 9 158,122 32 27 38
34 8 15 173,559 26 0 37
35 1 2 192,889 28 31 36
36 1 40 219,876 35 0 38
37 8 26 250,094 34 0 40
38 1 6 292,252 36 33 39
39 1 25 336,356 38 30 40
40 1 8 413,284 39 37 41
198
Medar, L.I.; Chirtoc, I.E.
Hierarchical clustering of the counties we performed through the following steps:
- finding similarities or disimilarităţilor between any pair of counties in the data set by
calculating the Euclidean distance;
- grouping of counties in a cluster binary hierarchical relations involving pairs of counties that are in the lowest proximity coefficient defined in Table Agglomeration Schedule.
The data from which start analysis includes 18 indicators and they are: total population, urban population (relative size), rural population (relative size), the number of people left the county, the number of people arriving in the county, the total employed population, unemployment rate, GDP / capita, the share of unemployed not registered unemployed, modernized public roads in total public roads, villages with water supply network in all cities, towns with sewerage network in all locations, number of schools, number of hospitals, accommodation number, net average monthly earnings, payments to foster labor mobility, higher education school population.
Once standards have been obtained values in the range [-2, 2], processed in
SPSS that show proximity matrix. Each element of the matrix represents Euclidean distance between counties, distance calculated based on all 18 indicators. Euclidean distance the most distant were recorded between Bucharest and other counties, reflecting thus the unique characteristics of the city as indicators examined.
In Figure 2. is way of formation of clusters based on cluster schedule SPSS
displayed.
Cluster grouping counties begin by finding the closest pair of objects. The algorithm continues step by step, uniting object pairs, pairs of clusters, or an object with a cluster until all the data is in a cluster. Once two objects are joined in a cluster, they remain together until the last step. A cluster formed in a later stage of analysis contains clusters from an earlier stage that it contains the clusters from one state and above.
To each cluster it is computed the averaged variables, then, for each object is calculated square Euclidean distance until the cluster center. These distances are summed for all objects. In each stage, the two clusters with the smallest growth distance are combined.
From the Figure 2 we can see how they grouped the cases in each group phase. In the second column Combined Cluster are grouped cases. In the third column Coefficients are distances coefficients between grouped elements. In the fourth column, Stage Cluster First Appears, is phase number that appeared in each of the two elements. The last column, Next Stage, shows which phase will occur first element in the group and in which stage will change it.
It follows that the shortest distance of 0,497 is between Tulcea and Ialomita counties and joining them in a group first. In step 16 to Ialomita county will join Covasna county. Further joins these counties (stage 17) Braila to the Euclidean distance of 35,677.
Analyse of Labor Force Mobility Phenomenom on Romanian ... 199
Suceava counties. In this group enters in the stage 29 Bistriţa county
In stage 32 and 33 form the group Bistrita Calarasi and Braila counties, but in step 27 Braila county formed group with the county. In step 38 Bistrita joins Alb county, the latter forming a group with Iasi county (stage 39) respectively Brasov county (stage 40).
Next in step 3, the cluster is formed between Calarasi and Giurgiu county, with a distance of 2,965, Calarasi appears in stage 23 where it forms group with Olt county.
In step 4 cluster is formed between Bihor and Mures counties, and in step 9 it joins Maramures county and will be joined Arad county in stage 18. This latter form group with Arges county in stage 31 which joins Alba county to step 35.
Next stage 5 is characterized by cluster consists of Satu Mare and Vrancea
joined by stage 19 Buzau that formed a cluster in step 6 with Dâmboviţa county. In
step 11 of this cluster joins also Buzau county, and to stage 29 Botoşani and Bistrita
counties with clusters they belong.
A new cluster is formed in step 7 between Arad and Sibiu, which joins Bihor county in18 stage.
Cluster formed in step 9 is composed of Olt county and Teleorman that joins to the one made by Calarasi and Giurgiu.
In step 10 is formed cluster Arges - Prahova, which joins Bacau in step 15. Stage 11 is characterized by cluster formed from Dolj and Galati, which Arges added in step 25, in step 31 Arad, Alba stage 35, stage 36 Vâlcea, Bistrita stage 38 and stage 39 Iaşi.
Cluster consists of Alba and Hunedoara counties belong to stage 13. If we analyze further the cluster 22 phase joins Caras-Severin county.
Next 25,860 distance is found between Gorj and Hunedoara counties resulting in the formation of a new cluster, which joins the stage 28 cluster consists of Alba, Hunedoara, Caras-Severin.
Along with the cluster formed in step 16, joins Brăila county (stage 17), and
Harghita (stage 27).
In step 20 is formed cluster composed of Bistrita and Salaj counties, which joins Botosani stage 29, which is part of the same cluster Neamt and Suceava. In this cluster in step 32 enters the county of Braila in stage 33 and stage 38 Bistrita county. A new cluster is formed in step 21, in this part being Cluj and Timişoara. This cluster joins Brasov in stage 26 and in stage 34 Salaj.
Table displays by the SPSS application in the formation of three clusters resulting is:
- first cluster consists of Alba, Arad Arges Bacau Bihor Bistrita, Botosani
Braila, Buzau Caras-Severin, Calarasi, Covasna, Dâmboviţa , Galati Giurgiu, Gorj,
Harghita Hunedoara Ialomita, Iasi , Maramures, Mehedinti, Mures, Neamt, Olt, Prahova, Satu-Mare, Salaj, Sibiu, Tulcea, Valcea, Vaslui, Vrancea.
- the II cluster consists of the following counties: Brasov, Cluj, Constanta, Ilfov, Timis.
200
Medar, L.I.; Chirtoc, I.E.
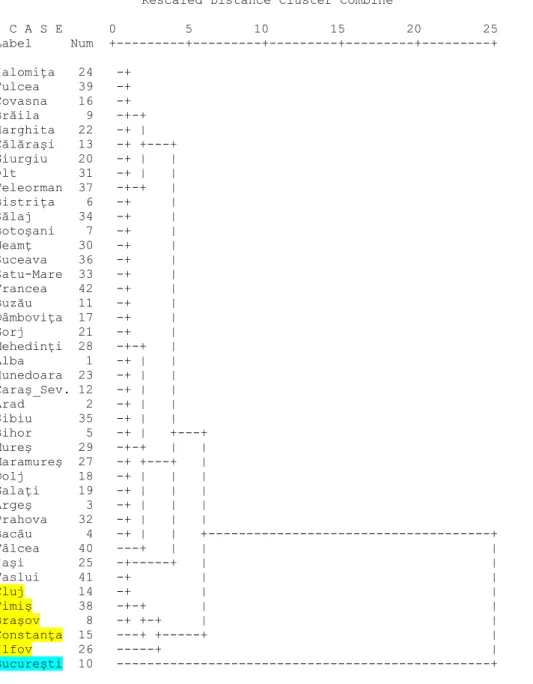
From Figure 3 we can see clusters presented above and how their training. Bucharest is found that, through the light indicators considered, differs from the structure considered, it fits in one of the homogeneous classes of only in the last step of the algorithm
Rescaled Distance Cluster Combine
C A S E 0 5 10 15 20 25 Label Num +---+---+---+---+---+ Ialomiţa 24 -+
Tulcea 39 -+ Covasna 16 -+ Brăila 9 -+-+ Harghita 22 -+ | Călăraşi 13 -+ +---+ Giurgiu 20 -+ | | Olt 31 -+ | | Teleorman 37 -+-+ | Bistriţa 6 -+ | Sălaj 34 -+ | Botoşani 7 -+ | Neamţ 30 -+ | Suceava 36 -+ | Satu-Mare 33 -+ | Vrancea 42 -+ | Buzău 11 -+ | Dâmboviţa 17 -+ | Gorj 21 -+ | Mehedinţi 28 -+-+ | Alba 1 -+ | | Hunedoara 23 -+ | | Caraş_Sev. 12 -+ | | Arad 2 -+ | | Sibiu 35 -+ | | Bihor 5 -+ | +---+ Mureş 29 -+-+ | | Maramureş 27 -+ +---+ | Dolj 18 -+ | | | Galaţi 19 -+ | | | Argeş 3 -+ | | | Prahova 32 -+ | | |
Bacău 4 -+ | | +---+ Vâlcea 40 ---+ | | | Iaşi 25 -+---+ | | Vaslui 41 -+ | | Cluj 14 -+ | | Timiş 38 -+-+ | | Braşov 8 -+ +-+ | | Constanţa 15 ---+ +---+ | Ilfov 26 ---+ | Bucureşti 10 ---+
Figure 3. Dendrogram using Ward method
Analyse of Labor Force Mobility Phenomenom on Romanian ... 201
socially developed, followed by counties in cluster 2. In cluster 1 are developing or under developed counties
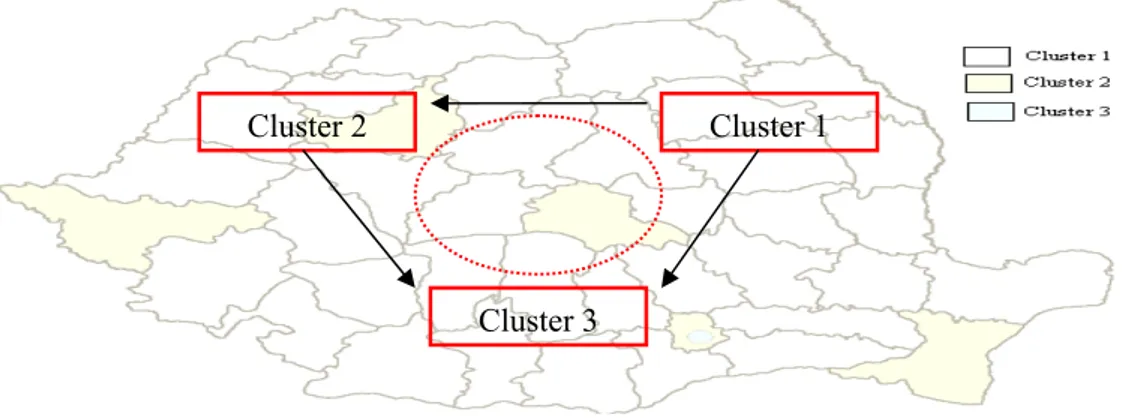
Figure 4. Cluster groups and trend of labor mobility in Romania
If we analyze labor mobility in Romania, according to the clusters shown in Figure 4 a possible variant of this phenomenon is the population displacement from cluster 1 to cluster 2 and counties that form the Municipality of Bucharest (cluster 3), while the population of cluster 2 travel tends to cluster 3.
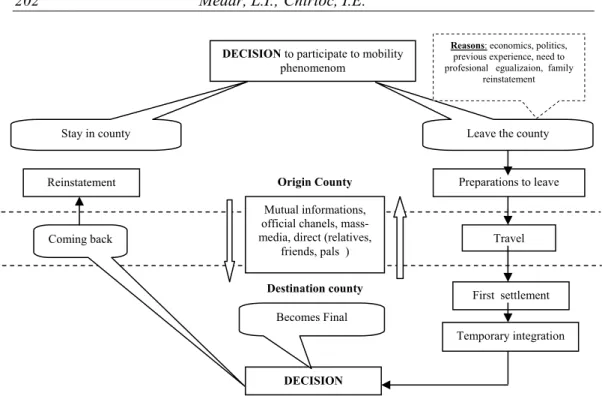
A person's decision to move to work in another area than home is determined by a number of factors that can go from economic issues, to personal and political issues. For most people participating in mobility phenomenon whatever its form the main motivation is the desire to improve their wealth or standard of living. Usually that type of people plan their departure and invest in getting information and knowledge they need for a successful market labor integration.
Also, a central role to the decision to participate in labor mobility plays the preparedness level of the individual. Experts have shown that there is a direct correlation between the level of training of labor resources and labor mobility. This may be due in part to the fact that more prepared people are more efficient in finding alternatives in the labor market, thereby reducing mobility costs. Also alternatives for these people are more numerous and varied. Economic incentives are also higher for employment with further/deeper training.
In the series of factors can be identified in the decision mobility (Figure 5) include: economic and political causes, establishing mobility networks, previous experience of mobility, the need for professional development through continuing education in a county that provides higher education opportunities the county of origin and family reunification.
Cluster 2
Cluster 3
202
Medar, L.I.; Chirtoc, I.E.
Figure 5. Decision and mobility reasons
Source: Blaga, E.; Moştenescu, R., Movement of labor force, Bucharest University Publishing House, 2008
Travel decision can be determined strictly by the difference resulting from the gains and costs involved in mobility. While earnings are generally easy to calculate, contain costs difficult to quantify with a high element of subjectivity. A person in front of such a decision should take into account the following elements: direct costs (eg transport costs and bringing their goods at destination), lost earnings (entries that you lose during the Looking landing area) and psychological costs (associated, for example, removing from the family and friends).
In order to calculate the first types of costs, individuals will take into account economic and social factors in both areas the departure and the destination. The difficulty often comes to selection to going (worker knows exactly what conditions await the new location), which can have a direct influence on the permanence of the phenomenon. Permanent mobility was prevalent in past centuries, distance-related barriers but tilting the balance towards a greater share of temporary streams. To get a realistic picture about on all these costs, the person who intends to travel in interest of work must have information as accurate and complete to the realities of the two countries. They are essential, because it is the most measurable.
An important point is made but the psychological costs, whose quantification is quite difficult to perform. Factors involved in this calculation could be age (age as the older they are, the more opportunities to recover costs involved in mobility are lower because the remaining time available, also flexibility is not the same, nor of a
DECISION to participate to mobility phenomenom
Stay in county Leave the county
Preparations to leave
Travel
Origin County
Destination county
First settlement
Temporary integration
DECISION
Becomes Final Coming back
Reinstatement
Mutual informations, official chanels, mass-media, direct (relatives,
friends, pals )
Reasons: economics, politics, previous experience, need to profesional egualizaion, family
Analyse of Labor Force Mobility Phenomenom on Romanian ... 203
professional or psychologically point of view), family (decision to leave family is often an issue of considerable weight). Should not be neglected other more specific reasons that generate flows, such as those that end with political asylum applications, for example. Beyond the primary motivation, political, and feature length changed mobility, moving from predominantly permanent form, to a mainly temporary one. Labor movement internally takes place based on market economy, the law of supply and demand is fundamental.
Overall mobility is a dynamic and complex phenomenon that can play an important role in the economic development of destination areas and reducing poverty in migrant origin areas.
4. CONCLUSIONS
Mobility phenomenon has existed since the beginning of mankind. Phenomenon has not stopped in time, but has changed and acquired new forms. Mobility is an increasingly important component of now day society, same time adjusting tool imbalances in labor markets. In society, mobility may be a phenomenon of rebalancing the number and age structure between regions and localities, competition and regulation mechanism. The balance between population and resource changes by the emergence of a surplus population, representing a "emigration zone" or the occurrence of surplus resources, representing a "immigration zone".
Internal mobility of labor (regional mobility) plays a role in redistributing labor supply. Internal mobility of workers and their families between localities and regions with different labor market conditions is an important component of regional population growth and labor market flexibility. This phenomenon is an adaptive response of labor supply to changes in demand territorial location. Mobility is one of the ways in which regions can adjust to economic change and a way that ensures growth. Mobility flows can act as an "automatic stabilizer" for the region, giving people the opportunity to improve their standard of living by moving to areas with conditions of employment and better living.
The spatial balance of supply and labor demand often involves relocation, being involved the other family members (some inactive), in this case, the labor mobility being with implications not only by economical nature, but also by social and demographic nature.
Is not to be neglected the role of migrants in increasing urbanization ratio of a region, and economic growth, the increase mobility is the main cause of population growth to each city and urban population in general.
204
Medar, L.I.; Chirtoc, I.E.
REFERENCES:
[1]. Blaga, E.; Moştenescu, R. (2008) Labor force migration, University of Bucharest Publishing House
[2]. Dumitrescu, D. (2008) Romania development regions – social economic differences – , Cetarea de Scaun/Fortress Publishing House, Târgovişte, 2008
[3]. Dinescu, M.C. Integration in european union: consequnces on force labor migration,
http://www.uvvg.ro/studia/economice/index.php?categoryid=14&p2_articleid=157
[Accessed april 2012]
[4]. Everitt, B.S. (2001) Cluster analzsis, Oxford University Press US
[5]. Gábor, N.; Erzsébet, N.; Zoltán, A.D.; Csaba, L.; Pál, G. (2009) Developmental directions of the clusters in Hungary,Annals of the University of Petroşani, Economics, 9(4), pp 87-98
[6]. Sas, I.S.; Ţiplea, L. Multidatabase query optimization, http://www.uvvg.ro/studia/ economice/index.php?categoryid=16&p2_articleid=196 [Accessed april 2012]
[7]. BNR (2009) Foreign direct investments in Romania in 2009 [Accessed april 2012]