www.ocean-sci.net/3/411/2007/
© Author(s) 2007. This work is licensed under a Creative Commons License.
Ocean Science
Atmospheric forcing of salinity in the overflow of Denmark Strait
J. Holfort1,*and T. Albrecht2
1Institut f¨ur Meereskunde der Universit¨at Hamburg, Hamburg, Germany 2Deutsche Marine, Zerst¨orerflottille, Wilhelmshaven, Germany
*present adress: BSH, Rostock, Germany
Received: 10 July 2006 – Published in Ocean Sci. Discuss.: 16 October 2006
Revised: 20 August 2007 – Accepted: 17 September 2007 – Published: 24 September 2007
Abstract. The temporal evolution of the characteristics of
Denmark Strait Overflow Water (DSOW) is reconstructed using hydrographic data and compared with possible atmo-spheric forcing mechanisms. It is concluded that the main factor influencing the DSOW characteristics at a time scale of one to several years is the difference in mean sea level pres-sure across Denmark Strait or, in other words, the wind along Denmark Strait. At these time scales upstream changes in the characteristics of the different water masses involved in the formation of DSOW are only of minor importance. The main process responsible for the observed salinity changes in the DSOW is mixing in Denmark Strait. Triggered by the wind, different water masses contribute with changing amounts to the formation of DSOW, leading to the observed changes in the salinity of DSOW.
1 Introduction
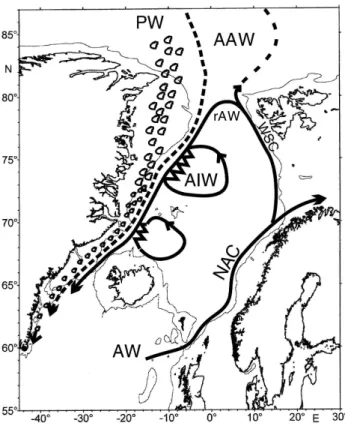
The densest and therefore deepest northern component of the global thermohaline circulation is the Denmark Strait Over-flow Water (DSOW). Different water masses, formed outside or within the Greenland-Iceland-Norwegian (GIN) seas, are carried southward towards Denmark Strait within the East Greenland Current (EGC). These water masses contribute to the formation of DSOW, which is found south of Denmark Strait flowing along the continental slope southwards into the deep North Atlantic. Fig. 1 shows a sketch of the circulation and water masses involved in the formation of DSOW and Rudels et al. (2002) give an overview of the different water masses and processes involved north of Denmark Strait. The overflow itself has been extensively studied; Saunders (2001) gives a short overview for the WOCE (World Ocean Circu-lation Experiment) and pre-WOCE era, many studies were Correspondence to:J. Holfort
conducted during the VEINS (Variability of exchanges in the Nordic Seas) and ASOF (Arctic-Subarctic Ocean Fluxes) programs.
The North Atlantic Oscillation (NAO) is the most promi-nent and recurrent pattern of atmospheric variability in the North Atlantic (Hurrel et al., 2003) and it is thought that the deep and intermediate water formation is strongly influenced by the NAO (Dickson et al., 1996). Over the last four decades the whole deep North Atlantic Ocean showed a rapid freshen-ing (Dickson et al., 2002) which can be linked to the increase from a low NAO-index in the 1960’s to high NAO-index in the 1990’s. But there is more variability than NAO. Seen from an oceanic perspective patterns of smaller geographic extent, but located in the right regions like straits, oceanic fronts etc., can have larger impact on oceanic parameters like DSOW salinity than large scale atmospheric variability pat-terns. The purpose of this paper is to find out, what is the atmospheric forcing of DSOW salinity.
2 Data
Fig. 1. Sketch of the water masses of the East Greenland Current, which contribute to the formation of DSOW (AW = Atlantic Water, NAC = North Atlantic Current, WSC = West Spitzbergen Current, rAW = return Atlantic Water, AAW = Arctic Atlantic Water, PW = Polar Water, AIW = Arctic Intermediate Water).
mooring array, as the measurement error of the Aanderaa cur-rent meters in conductivity are too large.
Atmospheric data used are monthly means from the NCEP reanalysis (taken from ftp.cdc.noaa.gov in July 2006) and daily data from ECMWF ERA-40 (obtained from the ECMWF data server in May 2004), which were averaged to monthly means.
3 Variability of DSOW characteristics
Within a region near the southern tip of Greenland (Fig. 2) there is a good data coverage due to WOCE (section A1e), VEINS, ASOF (Sect. 6) and other historic data. The data are biased toward summer data, but as the very short term fluctuations at the source are low pass filtered due to mixing along the approximate 1000 km long path from the Denmark Strait to the chosen region, the single measurements in time are representative of a longer time period.
Data from selected summer cruises in this region were used to construct mean potential temperature-salinity dia-grams. The potential temperature (2) was referenced to
2000 dbar. All temperature and salinity values of one cruise
50W 45W 40W 35W 30W 25W 20W
55N 60N 65N 70N
Fig. 2.Position of the hydrographic stations. Red and yellow mark-ers are stations in the main elliptical region, the yellow stations (north of 64.5◦N) were not used due to to large scatter. Blue mark-ers are stations in a more restricted area along VEINS Sect. 6.
within aσ2(density of the water if brought adiabatically to
2000 dbar) interval (±0.02) kg m−3around certainσ2values
were averaged, the resulting2-S diagram is shown in Fig. 3.
The temporal signal is very similar within the density range of the DSOW, but at high densities data become sparse and at lower densities the DSOW signal is mixed with the signal of the entrained water. Therefore in the following only values from the isopycnalσ2=37.12 kg m−3 are presented, but the
main results are quite independent of the choice of isopyc-nal.
Salinity atσ2=37.12 kg m−3 was calculated for each
hy-drographic profile in this region near the southern tip of Greenland. All data within a certain time interval was then averaged to get a time series of mean DSOW salinity. Due to the limited amount of data this time series could only be constructed with a coarse temporal resolution and even so is still gappy.
To arrive to a better temporal resolution, data from a larger region was used. This elliptical region extends along the spreading path of the DSOW along the Green-land continental shelf (Fig. 2). Waters with densities around
σ2>37.12 kg m−3 can also be found in other water masses
34.80 34.85 34.9 34.95 0.5
1 1.5 2 2.5 3 3.5 4
salinity
pot. temperature (2000dbar)
37.25 37.20 37.15 37.10 37.05 36.95 36.85
WOCE A1E; Veins Section 6
1991
1992 1993 1994
1995
1996
1997
1998
1999 2000 2001 2002
Fig. 3. Diagram of mean potential temperature and salinity at VEINS Sect. 6 for individual sections in different years. The means were calculated in 0.02 kg m−3σ2-density intervals. The used
sec-tions come from the cruises Meteor 18 in 1991, Valdivia 129 in 1992, Meteor 30 in 1994, Valdivia 152 in 1995, Valdivia 161 in 1996, Meteor 39 in 1997 (Schott et al., 1998), Meteor 45/4 in 1999 (Schott et al., 2000), Poseidon 263 in 2000, Meteor 50/3 in 2001 (Schott et al., 2002) and Poseidon 290 in 2002 (Holfort, 2002).
Denmark Strait (Rudels et al., 2002). This leads to large vari-ations in the salinity on isopycnals north of 64.5◦N (Fig. 4).
Therefore we exclude the northernmost part in following cal-culations. Within the remaining geographical extent, the southward flowing DSOW mixes with surrounding waters and becomes saltier (Fig. 4). A linear fit through all the data (for pressures larger than 1500 dbar and irrespective of time) shows that the mean increase in salinity is about 0.003 per degree latitude. This mean southward gradient was used to correct for mixing effects and to reference all salinities to a latitude of 60◦N. The DSOW also needs time to flow
southwards; the water found at 64.5◦N at one time will be
found somewhat later further south. We referenced all time to a latitude of 60◦N by using a spreading rate of 280 days
per 5◦of latitude. This corresponds to spreading velocity of
2.3 cm/s north-south, and taking into account the longitudinal displacement of about 3.4 cm/s along the DSOW path. This time correction also leads to a better temporal resolution, as a summer cruise to the whole region leads to temporal cover-age of several months. Increasing the spreading speed to 120 days per 5◦of latitude gives poorer temporal resolution, but
does not change considerably the smoothed temporal evolu-tion of the salinity. The mean current speed of the DSOW at 63◦N is about 20 to 30 cm/s (Dickson et al., 1998) and
as signal propagation in general is smaller than mean cur-rent speed, the used propagation speed is of the right order of magnitude.
57N 59N 61N 63N 65N 67N
34.5 34.6 34.7 34.8 34.9 35
S=34.880 + −0.0033*(lat− 60.0); Cor=−0.40
latitude
salinity
at density σ2=37.12
Fig. 4. Salinity atσ2=37.12 kgm−3as a function of latitude. Data
north of 64.5◦N (circles) were not used due to the large range of
salinities. Very shallow data were also excluded. The line is a fit through all data south of 64.5◦N giving a mean salinity increase
towards the south of 0.0033 per degree of latitude.
1990 1992 1994 1996 1998 2000 2002 2004 2006 34.82
34.83 34.84 34.85 34.86 34.87 34.88 34.89 34.9 34.91 34.92
salinity
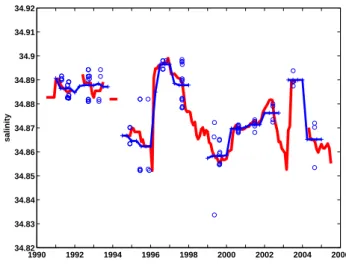
Fig. 5. Salinity of the DSOW atσ2=37.12 kg m−3as a function
of time. Blue circles are values from individual profiles near the southern tip of Greenland (see Fig. 2), the connected blue crosses are the mean time evolution calculated from these profiles. The red line is the mean time evolution as calculated from profiles in a larger region.
−1 −0.8 −0.6 −0.4 −0.2 0 0.2 0.4 0.6 0.8 1 −0.2 −0.1 0 −0.2 0.1 −0.3 0.2 −0.1 0 −0.4 0.3 −0.5 0.1 0.1 0 0 0.4 0.2 −0.6 0 0.3 0.1 0.5 0.3 0 0.3 0.4 −0.4 −0.1 0.2 −0.1 −0.1 0.1 0.1 0.2 −0.4 0 0.4 0.1 0 0.6 0.5 −0.1 0.2 −0.1 −0.5 0.1 0.1 0.2 0 0.2 −0.1 0 −0.2 −0.5 0.2 −0.3 0.3 0.1 −0.7 0.1 0.2 −0.2 −0.7 0.1 0.5 0.3 0.4 0 0.4 0.2 0.2 −0.3 0.2 0.2 0 0.2 0.2 0.2 0.1 longitude latitude
lag correlation at lag −3 months
−80 −60 −40 −20 0 20
30 35 40 45 50 55 60 65 70 75 80 85
(a)
−1 −0.8 −0.6 −0.4 −0.2 0 0.2 0.4 0.6 0.8 1 −0.3 −0.2 −0.1 0 0.1 0.2 0.3 0.4 −0.3 0.2 0 0.1 0 0.2 0.3 0 0.2 0.1 −0.1 −0.1 0.5 0.1 0.4 0.1 −0.2 0.2 −0.1 −0.1 0.3 0.2 0.4 0.4 −0.1 −0.2 0.1 0 −0.1 0.2 −0.2 −0.1 0.1 0.3 0.3 −0.1 0 −0.1 0.2 0 0.1 0.4 −0.1 0.1 0.1 −0.2 −0.3 0.2 0.2 0.1 0.2 0 −0.1 0 0.5 −0.4 0.5 −0.3 −0.2 0.3 0 0.2 0 −0.1 0 0 −0.2 −0.1 0.3 0.1 0.5 0.3 −0.2 −0.3 0 0.4 0.2 0.6 −0.1 0 0 −0.1 −0.4 −0.1 0.1 −0.4 longitude latitudelag correlation at lag −2 months
−80 −60 −40 −20 0 20
30 35 40 45 50 55 60 65 70 75 80 85
(b)
−1 −0.8 −0.6 −0.4 −0.2 0 0.2 0.4 0.6 0.8 1 −0.6 −0.5 −0.4 −0.3 −0.2 0 0.1 0.2 0.3 −0.1 0 0.4 0.1 0.1 0.1 0.2 0.5 0 −0.4 0 −0.1 0.1 0.3 −0.5 0.3 −0.3 0.1 −0.1 −0.2 0.6 −0.3 0.2 0 −0.2 −0.2 0.2 0.4 0.3 −0.1 0.3 0.4 0.3 0.2 0.4 −0.1 −0.2 −0.6 0 0.2 0.5 0.5 0.2 −0.1 0.2 0.6 −0.5 −0.3 0.3 0 0.1 0.2 0.3 0.3 −0.4 0.3 0.3 0.1 0.2 longitude latitudelag correlation at lag −1 months
−80 −60 −40 −20 0 20
30 35 40 45 50 55 60 65 70 75 80 85
(c)
−1 −0.8 −0.6 −0.4 −0.2 0 0.2 0.4 0.6 0.8 1 −0.5 −0.4 −0.3 −0.2 −0.1 0 −0.5 0.1 0.2 −0.4 −0.5 −0.4 −0.5 −0.3 −0.6 0.3 −0.6 −0.5 0.3 −0.5 −0.4 −0.3 longitude latitudelag correlation at lag −2 months
−80 −60 −40 −20 0 20
30 35 40 45 50 55 60 65 70 75 80 85
(d)
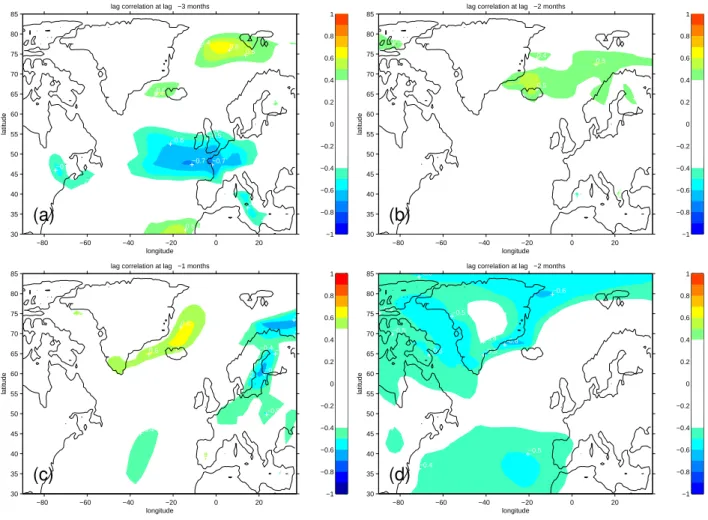
Fig. 6.Correlation of monthly atmospheric data (smoothed using a 3 months running mean) with the DSOW salinity:(a)with the meridional NCEP wind at a time lag of−3 months,(b)with the meridional ERA40 wind at a time lag of−2 months,(c)with the zonal NCEP wind at a time lag of−1 month and(d)with the difference of the NCEP mean sea level pressure and the mSLP above Iceland (1mSLP) at a time lag
of−2 months.
The salinity was high in the beginning of the 1990’ies, with values of about 34.885. The salinity then dropped to very low values around 34.85 in 1995. Then there is a sharp rise to a maximum of 34.895 in 1996. The salinity then de-creases gradually to a minimum salinity of 34.86 in 1999 and then starts to increase and but then drops again to low values in 2003. This drop in 2003 is seen only in the data from the large region. In 2004 salinity again reaches high val-ues around 34.89 and then decreases again to valval-ues around 34.86 afterwards. Most of these larger changes can also be seen in the2-S diagram of Fig. 3.
4 Atmospheric forcing
Changes in the characteristics of the DSOW can result from changes in each component and process leading to the forma-tion of DSOW as depicted by Rudels et al. (2002). Ultimately many of these changes are forced by the atmosphere. To
identify how the atmosphere induces changes in the composi-tion of the DSOW we made time lag correlacomposi-tions of our time series of DSOW salinity with several atmospheric parameters (mean sea level pressure (mSLP), wind, temperature, etc.) from the NCEP and ERA40 reanalysis. Some composite pa-rameters like the difference of mSLP and mSLP over Iceland (1mSLP) were also used. For the time lag calculations the
DSOW reference latitude was 64.5◦N, as further south the
influence of the atmosphere on the deep DSOW is probably small. As we are interested in atmospheric changes that in-duce oceanic changes, we restricted the analysis to time lags where the atmospheric signals precedes the oceanic one. As our oceanic time series is smoothed, and also the oceanic mixing in and shortly after Denmark Strait acts as low pass filter, we smoothed the atmospheric data with a 3 month run-ning mean.
1990 1992 1994 1996 1998 2000 2002 2004 2006 34.82
34.83 34.84 34.85 34.86 34.87 34.88 34.89 34.9 34.91 34.92
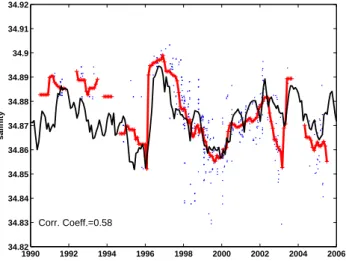
Corr. Coeff.=0.58
salinity
Fig. 7. The time series of DSOW salinity (connected red stars, from the larger region) and the scaled difference of the mean sea level pressure (NCEP) between 67.5◦N 30◦W and Iceland (black).
The blue points are salinities (referenced to 60◦N) of individual profiles (larger region).
near the East Greenland coast (in other words, the mSLP dif-ference across Denmark Strait). The time lag of about 1–3 months results in a propagating signal speed of order sev-eral cm/s, similar to the propagation speed used previously to correct the hydrographic measurements for the DSOW time series. High correlations were also found elsewhere and/or in other parameters. This is not unexpected, but these cor-relations were deemed not meaningful. When correlating a short and gappy time series with many different parameters at many places with different time lags the possibility of find-ing higher correlations just by pure chance is quite high. This is probably the case when a unrealistic large speed is needed for the propagation of the signal from the region of high cor-relation to the DSOW region. Another possibility is indirect coupling, if A is the cause for B and C, the correlation coef-ficient between B and C can be large, without B causing C or vice versa.
Scaling the atmospheric time series with a constant offset and factor to the DSOW salinity range and applying a time offset the good correlation with the time series of the DSOW salinity can be seen directly (Fig. 7). Using this kind of lin-ear regression with the pressure difference across Denmark Strait explains about 40% of the total variance of the DSOW salinity time series from 1990 onward.
5 Discussion
A weaker southward wind along Denmark Strait leads to an increase in the DSOW salinity. The associated time lag is about as long as the time the DSOW needs to travel from Denmark Strait to 64.5◦N. Therefore the actual process
set-1950 1955 1960 1965 1970 1975 1980 1985 1990 1995 2000 2006 34.82
34.84 34.86 34.88 34.9 34.92 34.94 34.96 34.98
salinity
Fig. 8. As Fig. 7 but including also data from 1950 onward.
ting the salinity in Denmark Strait has to occur relatively fast. One possible process is that with weaker southward winds less northern, low saline water flows towards Denmark Strait and more higher saline water of southern origin is present at Denmark Strait. This shift in the proportions of water masses involved in the formation of DSOW leads to a more saline DSOW. A second possible process is that weaker southward wind leads to a more horizontal boundary between low saline Polar Water (PW) and higher saline Return Atlantic Water (rAW), both coming from the north. This leads to a higher percentage of rAW compared with PW in the DSOW for-mation, increasing the resulting salinity. Both processes can act at the same time: not only there is less low salinity wa-ter flowing south, but it is also found higher up in the wawa-ter column.
There are probably more ways in which the changing wind can influence the complex dynamics in Denmark Strait (ed-dies, hydraulic control etc.) and lead to the observed link with the DSOW salinity. But with the data available to us it was even not possible to assess the importance of the two, rel-atively simple processes presented above. Numerical mod-els could help, but larger scale modmod-els cannot represent ad-equately the small scale processes in Denmark Strait and small scale models cannot be run for a long enough time. Although we ultimately cannot say exactly which dynamic process leads to the observed behavior, it is clear that it is the local atmospheric forcing in and just north of Denmark Strait that determines the DSOW salinity on time scales from months to several years. Following the DSOW recipe of Rudels et al. (2002), it is the last stirring in and just north of Denmark Strait which sets the DSOW characteristics by changing the amounts of the different water masses involved in the DSOW formation.
Extending the analysis to times before 1990, we see (Fig. 8) that the mean wind did not change much, but salinity was much higher in the 1960. It seems as if the salinity signals in the period 1965–1970 can also be explained with the chang-ing wind along Denmark Strait, but with the mean salinity being 0.065 higher in this period than in 1990–2004. So the processes that determine the shorter time changes are proba-bly the same in this previous period as in the 1990–2004 pe-riod, but some other, longer term process changed the mean salinity between 1965 and 1990. The general decrease in salinity over the last 40 years has been noted before (Dick-son et al., 2002).
One possible candidate for the longer term changes are advective processes, as proposed by Dickson et al. (1999). A signal in the Atlantic Water flowing northward along the Norwegian coast leads to a signal in the rAW and this signal is propagated along Greenland within the EGC and finally into the DSOW. For the shorter term changes we also looked for such advective signals, with the salinity in different water masses determined in a similar way to the DSOW salinity, but could not find any. Taking into account all the mixing and entrainment processes between Fram Strait and Denmark Strait (Rudels et al., 2002), which work like a low pass filter, it is not very probable that shorter term fluctuations survive this journey. Due to the low pass filtering effect of oceanic mixing a large salinity jump in Fram Strait will only lead to a more gradual change in Denmark Strait. But a longer term gradual increase in salinity could pass this system almost un-hindered. So the advective path along the EGC is a possible candidate to explain the longer term changes in the DSOW salinity, although also other processes (e.g. advection from the south, changes in ice export) are possible.
6 Conclusions
For time scales up to a few years the salinity of the DSOW is determined by thestrength of the wind along Denmark Strait. This leads to a certain predictability of the DSOW character-istics from atmospheric data of about several months. Acknowledgements. We wish to thank all people involved in data acquisition, specially the crew from FS Valdivia, FS Meteor and FS Poseidon as well as N. Verch.
Edited by: K. J. Heywood
References
Conkright, M. E., Levitus, S., Boyer, T. P., O’Brien, T., Stephens, C., Johnson, D., Stathoplos, L., Baranova, O., Antonov, J., Gelfeld, R., Burney, J., Rochester, J., and Forgy, C.: WORLD OCEAN DATABASE 1998, 1998.
Dickson, R. R., Lazier, J., Meincke, J., Rhines, P., and Swift, J.: Long-term coordinated changes in the convective activity of the North Atlantic, Prog. Oceanogr., 38, 241–295, 1996.
Dickson, R. R., Medler, K., and Read, J.: Current meter data re-port for Workpackage 1.4 Denmark Strait Overflow., available at www.ices.dk/ocean/project/veins, 1998.
Dickson, R. R., Meincke, J., Vassie, I., Jungclaus, J., and Østerhus, S.: Possible predictability in overflow from the Denmark Strait, Nature, 397, 243–246, 1999.
Dickson, R. R., Yashayaev, I., Meincke, J., Turrell, B., Dye, S., and Holfort, J.: Rapid freshening of the deep North Atlantic Ocean over the past four decades, Nature, 416, 832–836, 2002. Holfort, J.: FS Poseidon cruise 290 from St.Johns, Canada to
Reykjavik, Island, June 6 to June 24, 2002, http://www.ifm. uni-hamburg.de/∼wwwro/cruises/Pos290/cruisereport.html, 2002.
Hurrel, J. W., Kushnir, Y., Ottersen, G., and Visbek, M.: An overview of the North Atlantic Oscillation, in: The North At-lantic Oscillation: climatic significance and environmental im-pact, edited by: Hurrel, J. W., Kushnir, Y., Ottersen, G., and Visbek, M., American Geophysical Union, 1–36, 2003. Rudels, B., E. F., Meincke, J., Budeus, G., and Eriksson, P.: The
Eastgreenland current and its contribution to the Denmark Strait Overflow., J. Mar. Sci., 59, 1133–1154, 2002.
Saunders, P.: The dense northern Overflows, in: Ocean circulation and climate, observing and modelling the global ocean., edited by: Siedler, G., Church, J., and Gould, J., Academic Press, p. 712, 2001.
Schott, F., Koltermann, K. P., Stramma, L., Sy, A., Zahn, R., and Zenk, W.: North Atlantic, cruise No. 39, 18 April–14 September 1997, available at www.marum.de/Meteor-Berichte.html, 1998. Schott, F., Meincke, J., Meinecke, G., Neuer, S., and Zenk, W.:
North Atlantic 1999, Cruise No. 45, 18 May–4 November 1999, available at www.marum.de/Meteor-Berichte.html, 2000. Schott, F., Fischer, J., Holfort, J., and Zenk, W.: North Atlantic,
Cruise No. 50, 7 May–12 August 2001, available at www.marum. de/Meteor-Berichte.html, 2002.