ACPD
14, 17749–17816, 2014Modeling dust as mineral components
R. A. Scanza et al.
Title Page
Abstract Introduction
Conclusions References
Tables Figures
◭ ◮
◭ ◮
Back Close
Full Screen / Esc
Printer-friendly Version Interactive Discussion
Discussion
P
a
per
|
Discus
sion
P
a
per
|
Discussion
P
a
per
|
Discussion
P
a
per
|
Atmos. Chem. Phys. Discuss., 14, 17749–17816, 2014 www.atmos-chem-phys-discuss.net/14/17749/2014/ doi:10.5194/acpd-14-17749-2014
© Author(s) 2014. CC Attribution 3.0 License.
This discussion paper is/has been under review for the journal Atmospheric Chemistry and Physics (ACP). Please refer to the corresponding final paper in ACP if available.
Modeling dust as component minerals in
the Community Atmosphere Model:
development of framework and impact on
radiative forcing
R. A. Scanza1, N. Mahowald1, S. Ghan2, C. S. Zender3, J. F. Kok1,4, X. Liu2,5, and Y. Zhang1,6
1
Department of Earth and Atmospheric Sciences, Cornell University, Ithaca, New York, USA 2
Atmospheric Sciences and Global Change Division, Pacific Northwest National Laboratory, Richland, Washington, USA
3
Department of Earth System Science, University of California, Irvine, USA 4
Department of Atmospheric and Oceanic Sciences, University of California, Los Angeles, USA
5
Department of Atmospheric Science, University of Wyoming, Laramie, Wyoming, USA 6
ACPD
14, 17749–17816, 2014Modeling dust as mineral components
R. A. Scanza et al.
Title Page
Abstract Introduction
Conclusions References
Tables Figures
◭ ◮
◭ ◮
Back Close
Full Screen / Esc
Printer-friendly Version Interactive Discussion
Discussion
P
a
per
|
Discus
sion
P
a
per
|
Discussion
P
a
per
|
Discussion
P
a
per
|
Received: 21 February 2014 – Accepted: 18 May 2014 – Published: 2 July 2014
Correspondence to: R. A. Scanza ([email protected])
ACPD
14, 17749–17816, 2014Modeling dust as mineral components
R. A. Scanza et al.
Title Page
Abstract Introduction
Conclusions References
Tables Figures
◭ ◮
◭ ◮
Back Close
Full Screen / Esc
Printer-friendly Version Interactive Discussion
Discussion
P
a
per
|
Discus
sion
P
a
per
|
Discussion
P
a
per
|
Discussion
P
a
per
|
Abstract
The mineralogy of desert dust is important due to its effect on radiation, clouds and biogeochemical cycling of trace nutrients. This study presents the simulation of dust radiative forcing as a function of both mineral composition and size at the global scale using mineral soil maps for estimating emissions. Externally mixed mineral aerosols
5
in the bulk aerosol module in the Community Atmosphere Model version 4 (CAM4) and internally mixed mineral aerosols in the modal aerosol module in the Community Atmosphere Model version 5.1 (CAM5) embedded in the Community Earth System Model version 1.0.5 (CESM) are speciated into common mineral components in place of total dust. The simulations with mineralogy are compared to available observations
10
of mineral atmospheric distribution and deposition along with observations of clear-sky radiative forcing efficiency. Based on these simulations, we estimate the all-sky direct radiative forcing at the top of the atmosphere as+0.05 W m−2for both CAM4 and CAM5 simulations with mineralogy and compare this both with simulations of dust in release versions of CAM4 and CAM5 (+0.08 and +0.17 W m−2) and of dust with optimized
15
optical properties, wet scavenging and particle size distribution in CAM4 and CAM5,
−0.05 and −0.17 W m−2, respectively. The ability to correctly include the mineralogy of dust in climate models is hindered by its spatial and temporal variability as well as insufficient global in-situ observations, incomplete and uncertain source mineralogies and the uncertainties associated with data retrieved from remote sensing methods.
20
1 Introduction
Dust aerosols are soil particles suspended in the atmosphere, and they impact the cli-mate system by influencing the radiation budget, cloud processes (Miller and Tegen, 1998; Mahowald and Kiehl, 2003; Karydis et al., 2011; DeMott et al., 2003; Levin et al., 2005), and various biogeochemical cycles (Swap et al., 1992; Martin et al., 1991;
Jick-25
ACPD
14, 17749–17816, 2014Modeling dust as mineral components
R. A. Scanza et al.
Title Page
Abstract Introduction
Conclusions References
Tables Figures
◭ ◮
◭ ◮
Back Close
Full Screen / Esc
Printer-friendly Version Interactive Discussion
Discussion
P
a
per
|
Discus
sion
P
a
per
|
Discussion
P
a
per
|
Discussion
P
a
per
|
and absorption of solar and infrared radiation by mineral aerosols (Miller and Tegen, 1998; Sokolik and Toon, 1999). Both magnitude and sign of radiative forcing of dust are considered to be one of the most uncertain aspects in determining the net radiative forcing from natural and anthropogenic aerosols (IPCC, 2007).
Previous and ongoing modeling efforts address the importance of determining the
5
mineral composition of dust and its impact on the radiation budget (Sokolik and Toon, 1999; Claquin et al., 1999; Balkanski et al., 2007). A main factor in accurately determin-ing the sign of dust radiative forcdetermin-ing is the inclusion of the mineralogical components that absorb solar radiation. For instance, iron oxides have large imaginary portions of their complex refractive indices (http://www.atm.ox.ac.uk/project/RI/hematite.html,
10
cited as A. H. M. J. Triaud, personal communication, 2005). Since the imaginary part of refractive indices corresponds to absorption, iron oxide refractive indices control the amplitude of dust absorption in the solar and visible wavelengths (Sokolik and Toon, 1999; Claquin et al., 1999; Moosmüller et al., 2012). Efforts to separate the compo-nents of absorbing dust single out the iron oxides, e.g., hematite and goethite.
15
Recent modeling studies that consider the speciation of dust into its mineral com-ponents include work by Balkanski et al., 2007; Sokolik and Toon, 1999, and Nickovic et al., 2012. Balkanski et al., 2007 reports good agreement with satellite and AERONET data (Holben et al., 1998, 2001) when a 1.5 % internally mixed volume weighted per-cent of hematite is modeled, and reports global mean top of atmosphere (TOA) and
20
surface radiative forcings between−0.47 to −0.24 W m−2 and −0.81 to −1.13 W m−2 respectively. Sokolik and Toon (1999) investigate the optical properties of a mixture of individual minerals and of mixtures where hematite is aggregated with other miner-als. They find a net negative radiative forcing for externally mixed minerals and a net positive forcing when either hematite concentrations are unrealistically high or when
25
ACPD
14, 17749–17816, 2014Modeling dust as mineral components
R. A. Scanza et al.
Title Page
Abstract Introduction
Conclusions References
Tables Figures
◭ ◮
◭ ◮
Back Close
Full Screen / Esc
Printer-friendly Version Interactive Discussion
Discussion
P
a
per
|
Discus
sion
P
a
per
|
Discussion
P
a
per
|
Discussion
P
a
per
|
This study addresses the direct radiative forcing (DRF) of natural mineral aerosols in the Community Earth System Model. The global model simulations attempt to match the sign and magnitude of regional observations of DRF using two different atmosphere models. Dust in the Community Atmosphere Model 4, hereafter CAM4, was speciated into eight minerals, illite, kaolinite, montmorillonite, hematite, quartz, calcite, gypsum
5
and feldspar, (Claquin et al., 1999) where the minerals along with other aerosols are treated as external mixtures (Mahowald et al., 2006). The Community Atmosphere Model 5, CAM5, treats aerosols as internal mixtures within two of three modes (Liu et al., 2012). Dust in CAM5 was speciated into four minerals, the major clays (illite, kaolinite and montmorillonite) and hematite, along with an additional tracer to carry the
10
rest of the dust.
The main objective of this work was to build the framework to model dust as its individual mineral components and to test the accuracy of emission, advection and deposition of the mineral tracers by comparing with observations from literature. An additional objective was to determine the radiative effect of speciating dust into
min-15
erals on the Earth System. Furthermore, the use of two different atmosphere models allows us to test the sensitivity of mineral speciation within different frameworks. The framework for carrying extra tracers performs reasonably well and is currently being used to investigate elemental distributions (Zhang et al., 2014) and also ice nucleation in mixed-phase clouds as a function of different mineral species (Liu et al., 2013).
20
The sections are organized as follows: Sect. 2 describes methods including a de-scription of the CESM and CAM4 and CAM5 methods for dust entrainment, transport and deposition as well as the radiation schemes used to compute global estimates of DRF. Section 3 describes the resulting mineral distributions and compares them with observations, compares modeled optical depths and single scattering albedo to the
25
ACPD
14, 17749–17816, 2014Modeling dust as mineral components
R. A. Scanza et al.
Title Page
Abstract Introduction
Conclusions References
Tables Figures
◭ ◮
◭ ◮
Back Close
Full Screen / Esc
Printer-friendly Version Interactive Discussion
Discussion
P
a
per
|
Discus
sion
P
a
per
|
Discussion
P
a
per
|
Discussion
P
a
per
|
to quantify the uncertainties associated with the radiative forcing from minerals. The second sensitivity study involves simulating mineralogy with hematite solely in the soil clay map to address recent studies that find hematite primarily in fine particle sizes and to investigate whether or not this improves our estimates of radiative forcing. The last section discusses the strengths of this framework and outlines where additional work
5
is needed. Future improvements to these models will be described along with planned future simulations of trace nutrient biogeochemical cycling with this framework.
2 Methods
The Community Earth System Model version 1.0.5 (CESM 1.0.5), which is coordinated by the National Center for Atmospheric Research (NCAR) is a coupled Earth System
10
Model used to simulate past, present and future climate (Hurrell et al., 2013). This study uses CESM1.0.5 with modifications to CAM4 and CAM5.1 to simulate dust as distinct mineral tracers and to model radiation online to investigate the DRF of mineralogy.
2.1 Desert dust model
The CAM4 model configuration used for bulk aerosols contains active atmosphere, land
15
and sea ice components, as well as a data ocean and slab glacier forced by NASA’s GEOS-5 meteorology (FSDBAM) (Suarez et al., 2008; Hurrell et al., 2013; Lamarque et al., 2012). Model resolution is on a 2.5◦×1.9◦horizontal grid with 56 vertical levels. The model was run for eight years, 2004–2011, with the simulations from 2006 through 2011 used for analysis. The default configuration was altered so that radiative
feed-20
backs onto climate were active and the radiation code was modified to compute radia-tion online, bypassing the need for Parallel Offline Radiative Transfer (PORT) (Conley et al., 2013). Because we use reanalysis winds, radiation does not feed back onto the meteorology. The dust model is part of a bulk aerosol model scheme with fixed bin width and sub-bin distribution following the Dust Entrainment and Deposition Model (DEAD)
ACPD
14, 17749–17816, 2014Modeling dust as mineral components
R. A. Scanza et al.
Title Page Abstract Introduction Conclusions References Tables Figures ◭ ◮ ◭ ◮ Back Close
Full Screen / Esc
Printer-friendly Version Interactive Discussion Discussion P a per | Discus sion P a per | Discussion P a per | Discussion P a per |
(Zender et al., 2003). The location and emission potential of dust source regions have been optimized from the default configuration and are described in (Mahowald et al., 2006; Albani et al., 2014).
Measurements and theory show that dust aerosols (0.1–50 µm) are primarily emitted through saltation, the bouncing motion of sand-sized (∼100–200 µm) particles (Gillette
5
et al., 1974; Shao et al., 1993; Kok et al., 2012). In order for saltation to be initiated, the wind stress on the surface needs to be sufficient to lift sand particles, which for bare soils, occurs above wind friction speeds of approximately 0.2 m s−1 (Bagnold, 1941; Kok et al., 2012). Dust entrainment in the Community Land Model (CLM), the land com-ponent of the CESM, is initiated after the wind speed exceeds the threshold wind speed
10
calculated by the model. The threshold wind speed for dust entrainment increases with soil moisture: CLM uses the semi-empirical relation of Fecan et al. (1999) with addi-tional optimization from the tradiaddi-tional dependence of the square of clay mass fraction (Fecan et al., 1999; Zender et al., 2003). Regions of dust emission are parameterized as being associated with topographical depressions where sediment from
hydrologi-15
cal systems accumulates (Ginoux et al., 2001; Yoshioka et al., 2007; Mahowald et al., 2006; Zender et al., 2003). While measurements of dust particle size distribution range from about 0.1–50 µm, the CESM only accounts for the climatologically most relevant portion (0.1–10 µm) (Schulz et al., 1998; Zender et al., 2003). Particle size distributions are computed from the mass fraction of an analytic trimodal lognormal probability
den-20
sity function representing three source modes to four discrete sink or transport bins by Eq. (1) (Zender et al., 2003)
Mi,j =
1 2 erf
lnDmax,j/Dv,j
√
2 ln σg,i
−erf
lnDmin,j/Dv,j
√
2 ln σg,i
, (1)
where erf is the error function (Seinfeld and Pandis, 1998),Dmax andDmincorrespond
25
ACPD
14, 17749–17816, 2014Modeling dust as mineral components
R. A. Scanza et al.
Title Page
Abstract Introduction
Conclusions References
Tables Figures
◭ ◮
◭ ◮
Back Close
Full Screen / Esc
Printer-friendly Version Interactive Discussion
Discussion
P
a
per
|
Discus
sion
P
a
per
|
Discussion
P
a
per
|
Discussion
P
a
per
|
standard deviation, σg=2 (Reid et al., 2003; Mahowald et al., 2006; Zender et al.,
2003). Particle size distributions were parameterized (default mass fractions are 3.8, 11.1, 17.2 and 67.8 % for size bins 1–4) following the brittle fragmentation theory of dust emission (Kok, 2011), with prescribed mass fractions in each bin of 1.1, 8.7, 27.7 and 62.5 % respectively. The parameterized size distribution resulted in better agreement
5
with AERONET size distribution measurements (Albani et al., 2014). Dry deposition includes gravitational settling and turbulent deposition and wet deposition includes in-cloud nucleation scavenging and below-in-cloud scavenging (Rasch et al., 2000; Zender et al., 2003; Mahowald et al., 2006). The scavenging coefficients and particle solubility parameterizations were modified from (0.1, 0.1 for bins 3 and 4) to (0.3, 0.3 for bins
10
3 and 4), and the prescribed solubility was changed from 0.15 to 0.3 (Albani et al., 2014). The suppression of dust emission by vegetation (Lancaster and Baas, 1998; Okin, 2008) was parameterized by assuming that the fraction of the grid cell consisting of bare soil capable of emitting dust aerosols decreases linearly with the leaf area index up to a threshold of 0.3 m2m−2(Mahowald et al., 2006).
15
The CAM5 model configuration used for modal aerosols is stand-alone atmosphere with land and sea ice components, as well as a data ocean and slab glacier forced by NASA’s GEOS-5 meteorology (Suarez et al., 2008; Lamarque et al., 2012; Hurrell et al., 2014) and CAM5 physics (FC5) (Liu et al., 2012). Model resolution is on a 2.5◦×1.9◦ horizontal grid with 56 vertical levels. The model was run for eight years using
anthro-20
pogenic emissions from the year 2000, and years 2006–2011 are used for analysis. Radiative feedbacks were active and allowed to feed back onto climate but not mete-orology. Dust entrainment processes are identical as described above for CAM4. The particle size distribution differs from the bulk aerosol method with lognormal functions describing the distribution via a modal aerosol model (MAM) (Liu et al., 2012). Mass
25
ACPD
14, 17749–17816, 2014Modeling dust as mineral components
R. A. Scanza et al.
Title Page
Abstract Introduction
Conclusions References
Tables Figures
◭ ◮
◭ ◮
Back Close
Full Screen / Esc
Printer-friendly Version Interactive Discussion
Discussion
P
a
per
|
Discus
sion
P
a
per
|
Discussion
P
a
per
|
Discussion
P
a
per
|
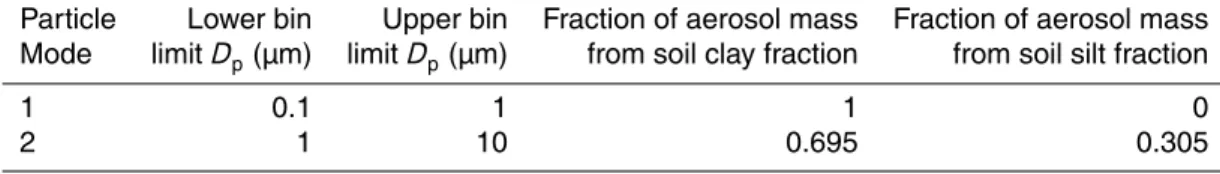
at 0.1–1.0 µm and 1.0–10.0 µm, respectively. The particle size distribution for dust en-trainment was modified (default mass percents are 3.2 and 96.8 % for modes 1 and 3, respectively) following brittle fragmentation theory for vertical dust flux (Kok, 2011) with prescribed emission mass percents of 1.1 and 98.9 % for modes 1 and 3. Advection and deposition processes are described in Liu et al. (2012), where aerosols are
repre-5
sented as both interstitial particles suspended in the atmosphere and as cloud-borne particles.
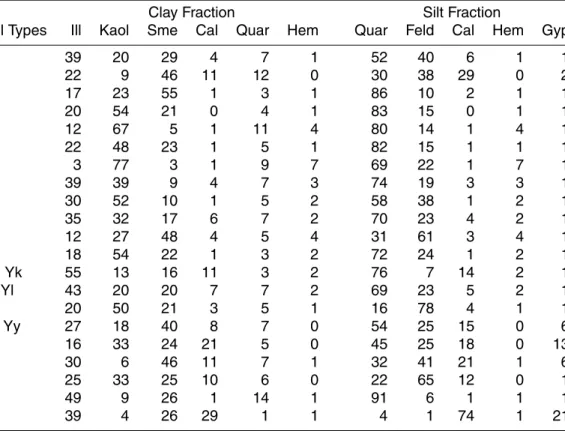
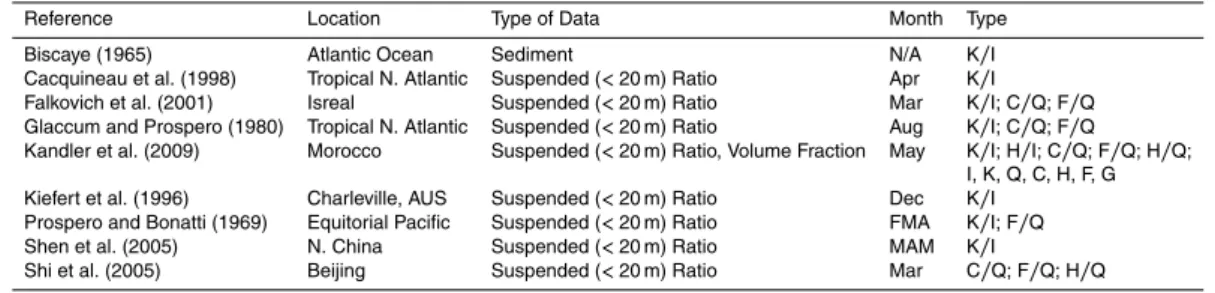
Source maps of minerals follow the mean mineralogical table (MMT) from (Claquin et al., 1999), with two modifications. From the MMT, soil types whose mineral compo-nents are found not to add up to 100 % were gypsic xerosols and yermosols, gleyic
10
and orthic solontchaks and salt flats (Table 1). In addition to renormalizing the soil types, hematite was added to the clay fraction (0–2 µm) with the same proportion as prescribed in the silt fraction (2–50 µm) by subtracting the required fraction from illite (Balkanski et al., 2007).
Mineralogy was mapped on FAO/UNESCO WGB84 at 5′×5′arc min with soil legend
15
from FAO/UNESCO Soil Map of the World (1976; File Identifier: f7ccd330-bdce-11db-a0f6-000d939bc5d8) (Batjes, 1997). The corresponding mineral maps were regridded to model resolution (2.5◦×1.9◦) (Fig. 1). A nearest neighbor algorithm was applied to estimate mineralogy of land mass not specified by the soils in Claquin’s MMT to allow non-zero dust emissions in these regions. As described in more detail in the following
20
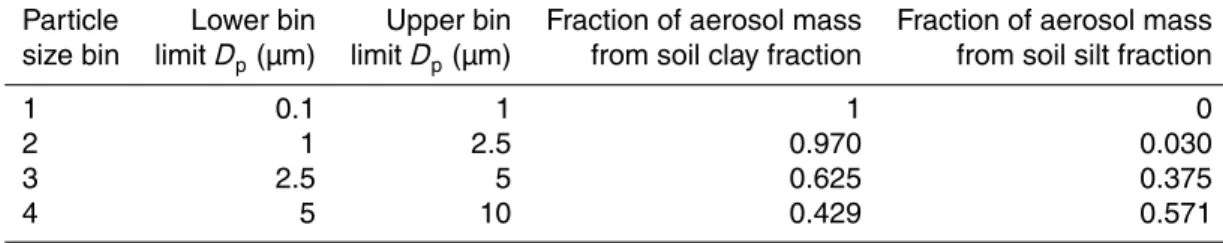
section, the clay-sized soils (0–2 µm) and silt-sized soils (2–50 µm) are distributed in the four CAM4 bins and two CAM5 modes following brittle fragmentation theory (Kok, 2011) (Table 2).
2.2 Conversion of soil mineralogy to aerosol mineralogy
We model the conversion of soil mineralogy to dust aerosol mineralogy for a given
25
transport particle size bin by following the brittle fragmentation theory of dust emission (Kok, 2011). This theory predicts that the production of dust aerosols with size Dd
ACPD
14, 17749–17816, 2014Modeling dust as mineral components
R. A. Scanza et al.
Title Page
Abstract Introduction
Conclusions References
Tables Figures
◭ ◮
◭ ◮
Back Close
Full Screen / Esc
Printer-friendly Version Interactive Discussion
Discussion
P
a
per
|
Discus
sion
P
a
per
|
Discussion
P
a
per
|
Discussion
P
a
per
|
Eq. (2),
dV
dDd ∝
Dd
Z
0
Ps(Ds) dDs (2)
where V is the normalized volume of dust aerosols with size Dd and Ps (Ds) is the
particle size distribution of fully disaggregated soil particles. For a mineralogy data set
5
with clay (0–2 µm diameter) and silt (2–50 µm diameter) soil fractions, we use Eq. (2) to convert from soil mineralogy to dust aerosol mineralogy. More specifically, for a given aerosol with size Dd the mass fraction originating from the soil clay and silt particle
fractions are given by Eqs. (3a) and (3b) respectively,
fclay(Dd)= Dclay
Z
0
Ps(Ds) dDs/ Dd
Z
0
Ps(Ds)dDs, (3a)
10
fsilt(Dd)= Dd
Z
Dclay
Ps(Ds) dDs/ Dd
Z
0
Ps(Ds)dDs (3b)
whereDclay=2 µm,fclay+fsilt=1, andDd> Dclay. WhenDd< Dclay,fclay=1 andfsilt=0.
The integrals in (Eqs. 3a and 3b) are evaluated by assuming that the size distribution of fully-disaggregated soil particles follows a log-normal distribution (Kolmogorov, 1941)
15
according to Eq. (4),
Ps(Ds)=
1
Ds √
2πln(σs)
exp
(
−ln 2
(Ds/Ds
2ln2(σs)
)
(4)
whereDsis the median diameter by volume andσsis the geometric standard deviation.
Measurements of the particle size distribution of arid soil indicate thatDs≈3.4 µm and
ACPD
14, 17749–17816, 2014Modeling dust as mineral components
R. A. Scanza et al.
Title Page Abstract Introduction Conclusions References Tables Figures ◭ ◮ ◭ ◮ Back Close
Full Screen / Esc
Printer-friendly Version Interactive Discussion Discussion P a per | Discus sion P a per | Discussion P a per | Discussion P a per |
σs≈3.0 for fully-disaggregated soil particles with diameters smaller than 20 µm (Kok,
2011). Combining Eqs. (3) and (4) yields,
fclay(Dd)=
1+erf
ln(Dclay/Ds)
√
2 ln(σs)
1+erf
ln(Dd/Ds)
√
2 ln(σs)
, (5a)
fsilt(Dd)=
erf
ln(Dd/Ds)
√
2 ln(σs)
−erf
ln(Dclay/Ds)
√
2 ln(σs)
1+erf
ln(Dd/Ds) √
2 ln(σs)
(5b)
5
To obtain the fraction of dust aerosol mass originating from the soil’s clay and silt frac-tions for a given particle size bin, Eq. (5a) and (5b) are integrated over the bin’s size boundaries and weighted by the sub-bin distribution following,
fclay, bin= D+
Z
D−
fclay(Dd) dV dDd
dDd/
D+
Z
D−
dV
dDd
dDd (6a)
fsilt, bin= D+
Z
D−
fsilt(Dd)
dV
dDd
dDd/ D+
Z
D−
dV
dDd
dDd (6b)
10
whereD−andD+are the lower and upper bin size limits and dV/dDdis the sub-bin dust
size distribution by volume. As previously stated, the sub-bin size distribution in CAM follows a log-normal distribution with mass median diameter of 3.5 µm and geometric standard deviation of 2.0 (Zender et al., 2003; Reid et al., 2003). We use Eqs. (4)–(6) to
15
ACPD
14, 17749–17816, 2014Modeling dust as mineral components
R. A. Scanza et al.
Title Page
Abstract Introduction
Conclusions References
Tables Figures
◭ ◮
◭ ◮
Back Close
Full Screen / Esc
Printer-friendly Version Interactive Discussion
Discussion
P
a
per
|
Discus
sion
P
a
per
|
Discussion
P
a
per
|
Discussion
P
a
per
|
2.3 Modeling of radiation
Radiation in CAM4 is parameterized using the delta-eddington approximation (Joseph et al., 1976; Coakley Jr et al., 1983) to determine the reflectivity and transmissivity for each of 19 shortwave spectral intervals at each vertical layer in the atmosphere. The vertical layers at a given spectral interval are combined to account for scattering
be-5
tween layers, allowing for the computation of upward and downward fluxes between each layer once per model hour. The optical properties for each aerosol species in-cluding extinction and single scattering albedo in solar short wavelengths (SW) are calculated offline from species refractive indices with a Mie solver (Wiscombe, 1980) by integrating the extinction and scattering efficiencies over the size distribution of
10
aerosol surface area. The mineral species whose SW optical properties have been derived from their respective refractive indices are illite, kaolinite, montmorillonite and hematite (Table 3) with the remaining mineral species, quartz, gypsum, feldspar and calcite being represented by a “rest of dust” blend with optics calculated with Maxwell-Garnett (Niklasson et al., 1981) mixing of 48 % quartz, 25 % illite, 25 %
montmoril-15
lonite and 2 % calcite by volume (C. Zender, personal communication, 2013). The den-sity of each mineral is explicitly included (ρillite=2750 kg m−
3
,ρkaolinite=2600 kg m− 3
,
ρmontmorillonite=2350 kg m− 3
, ρquartz=2660 kg m− 3
, ρcalcite=2710 kg m− 3
, ρhematite=
5260 kg m−3, ρfeldspar=2560 kg m− 3
,ρgypsum=2300 kg m− 3
), while the density of the “rest of dust” blend is 2500 kg m−3. Hygroscopicity for all minerals as well as the dust
20
blend is prescribed at 0.068. While different mineral species have unique water uptake abilities and thus different hygroscopicities, we assume the effect on the optical proper-ties is small compared to other factors influencing our estimate of radiative forcing, and examining the CCN/IN capabilities of minerals was beyond the scope of this study. Not all the mineral species were modeled optically because the number of mineral species
25
ACPD
14, 17749–17816, 2014Modeling dust as mineral components
R. A. Scanza et al.
Title Page
Abstract Introduction
Conclusions References
Tables Figures
◭ ◮
◭ ◮
Back Close
Full Screen / Esc
Printer-friendly Version Interactive Discussion
Discussion
P
a
per
|
Discus
sion
P
a
per
|
Discussion
P
a
per
|
Discussion
P
a
per
|
In place of LW optical properties for the minerals, CAM3 optics were used (Mahowald et al., 2006), which were computed assuming Maxwell-Garnett mixing of 47.6 % quartz, 25 % illite, 25 % montmorillonite, 2 % calcite and 0.4 % hematite by volume, with den-sity =2500 kg m−3 and hygroscopicity prescribed at 0.14. The error associated with this assumption is difficult to assess but may be quite large since the different minerals
5
have very different optical properties in the longwave.
Radiation in CAM5.1 is parameterized with Rapid Radiative Transfer Model for GCM (RRTMG) (Liu et al., 2012; Iacono et al., 2008) with 14 and 16 spectral bands in SW and LW respectively. Mineral optical properties are parameterized by wet refractive index and wet surface mode radius, with the wet refractive index estimated using the
10
volume mixing rule for all components including water, and the wet radius estimated from the dry radius, relative humidity, and volume mean hygroscopicity using Kohler theory (Ghan and Zaveri, 2007). Since this parameterization only utilizes refractive indices, the LW absorption parameters were generated. Flux calculations are done once per model hour for shortwave and longwave flux during model day (cos(θ0)>0).
15
The direct radiative forcing from dust for all simulations is determined by calculating the radiative forcing twice at each time step, one time through with all aerosol species and an additional time through with everything but dust or minerals. Both atmosphere models neglect scattering at infrared wavelengths (LW) and only account for absorption in LW for mineral aerosols, which may underestimate radiative forcing at the top of the
20
atmosphere and surface by up to 50 and 15 %, respectively (Dufresne et al., 2002). CAM5 was modified to include five mineral tracers for each of the two modes, four minerals and an additional tracer to carry the rest of dust. As previously mentioned, neglecting the radiative properties of the additional minerals in CAM4 facilitated a parison between CAM4 and CAM5. The fewer tracers in CAM5 were simply for
com-25
ACPD
14, 17749–17816, 2014Modeling dust as mineral components
R. A. Scanza et al.
Title Page
Abstract Introduction
Conclusions References
Tables Figures
◭ ◮
◭ ◮
Back Close
Full Screen / Esc
Printer-friendly Version Interactive Discussion
Discussion
P
a
per
|
Discus
sion
P
a
per
|
Discussion
P
a
per
|
Discussion
P
a
per
|
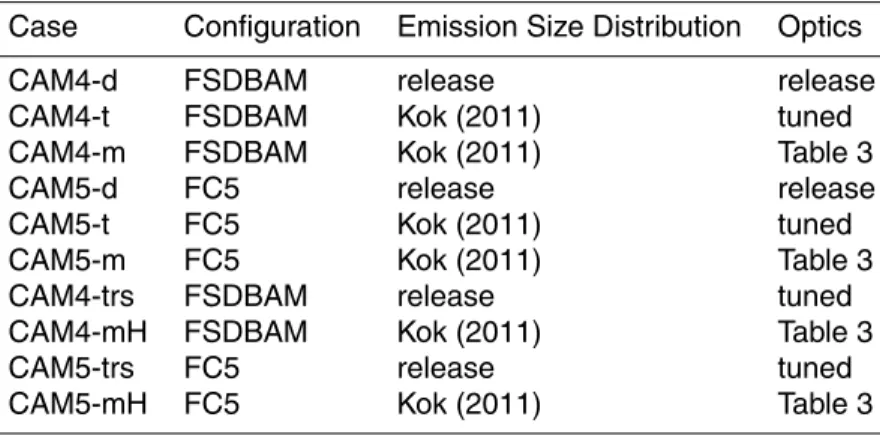
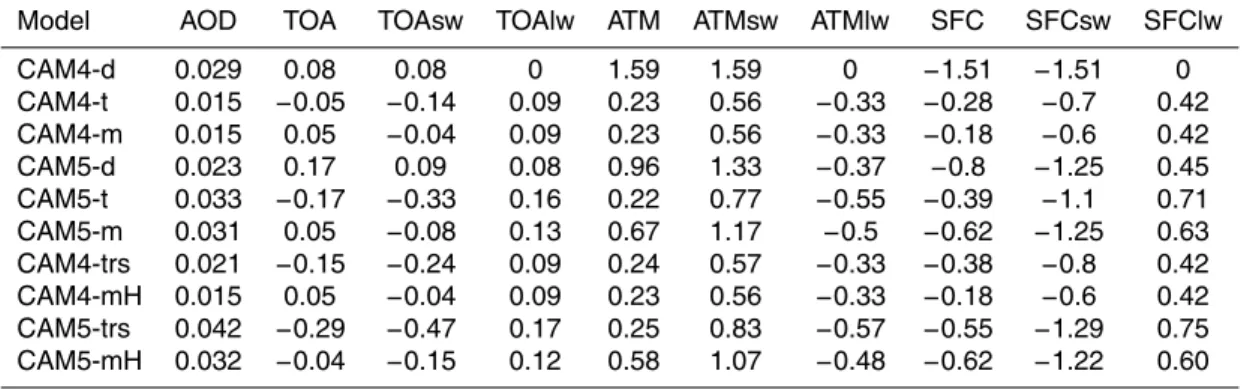
2.4 Description of simulations
The cases simulated for both CAM4 and CAM5 are listed in Table 4. CAM4-d and CAM5-d simulations use dust from release versions of CAM4 and CAM5 in the CESM. CAM4-t and CAM5-t simulations consist of a variety of optimizations from the default versions to better simulate observed dust emission, transport, depositional fluxes and
5
optical properties. The tuning consists of optimized soil erodibility maps for each model (Mahowald et al., 2006; Albani et al., 2014), emission particle size distribution follow-ing brittle fragmentation theory (Kok, 2011), increased solubility for dust, increased cloud scavenging coefficients (Albani et al., 2014) and improved optical properties. The improved optical properties in CAM4 include SW extinction and scattering coeffi
-10
cients derived from the refractive indices from Maxwell-Garnett mixing of 47.6 % quartz, 0.4 % hematite, 25 % illite, 25 % montmorillonite and 2 % calcite by volume, with den-sity=2500 kg m−3and hygroscopicity=0.068, and CAM3 LW absorption coefficients (Mahowald et al., 2006) computed from refractive indices with Maxwell-Garnett mix-ing of 47.6 % quartz, 25 % illite, 25 % montmorillonite, 2 % calcite and 0.4 % hematite
15
by volume, with density=2500 kg m−3 and hygroscopicity prescribed at 0.14. The in-clusion of the CAM3 LW absorption coefficients is a marked improvement in physical processes from release dust (CAM4-d), which has zero LW optics (Yoshioka et al., 2007). The optimized optical properties in CAM5 include extinction, scattering and ab-sorption parameterizations derived from the wet particle mode radius and refractive
20
indices from Maxwell-Garnett mixing of 47.6 % quartz, 0.4 % hematite, 25 % illite, 25 % montmorillonite and 2 % calcite by volume, with density=2500 kg m−3and hygroscop-icity=0.068. CAM4-m and CAM5-m simulations employ the same tuning parameteri-zations as the tuned cases except the optical properties (extinction and scattering for CAM4, extinction, scattering and absorption for CAM5) are derived from the mineral
25
ACPD
14, 17749–17816, 2014Modeling dust as mineral components
R. A. Scanza et al.
Title Page
Abstract Introduction
Conclusions References
Tables Figures
◭ ◮
◭ ◮
Back Close
Full Screen / Esc
Printer-friendly Version Interactive Discussion
Discussion
P
a
per
|
Discus
sion
P
a
per
|
Discussion
P
a
per
|
Discussion
P
a
per
|
model for RF calculations. The studies involve characterizing the sensitivity of dust RF to the size distribution at emission (CAM4-trs, CAM5-trs) and to the soil size distribution of hematite (CAM4-mH, CAM5-mH). For the first sensitivity study, the tuning parame-terizations for dust in both CAM4 and CAM5 are kept constant except the new size distribution was replaced with the size distribution in the release version of the model
5
with mass fractions of 0.0385, 0.111, 0.172 and 0.678 for bins 1–4 (CAM4-trs) and mass fractions 0.032 and 0.968 for modes 1 and 3 (CAM5-trs). Note that hematite in the models is treated in both fine and coarse modes as the particle size distribution of hematite may differ from the (Claquin et al., 1999) MMT case where hematite was prescribed solely in the coarse mode (CAM4-m, CAM5-m). While it was acknowledged
10
that the available data on hematite was very limited, recent observations suggest that hematite is predominantly in the smaller, clay-sized range. (Cwiertny et al., 2008) finds much higher relative iron concentrations in particles<0.75 µm diameter. Higher iron concentrations indicate iron rich oxides/hydroxides as opposed to iron substitutions in silicate clay lattices, which are typically quite small (Journet et al., 2008). The second
15
study is designed to test the sensitivity of the soil size distribution of hematite and retains all parameterizations for the mineralogy runs with the exception of removing hematite from the silt sized soil maps and scaling up the remaining silt sized minerals (CAM4-mH and CAM5-mH). All the simulations use GEOS-5 reanalysis meteorology and were run from 2004–2011 with the last six years (2006–2011) used for analysis.
20
2.5 Comparison to observations
The following sections describe the comparison of mineralogy to in situ field measure-ments as well as ocean core sediment data (Table 5). Distinguishing natural mineral aerosol is complicated by atmospheric mixing with anthropogenic aerosols and other natural aerosols, as well as the distance between the dust source and the location
25
ACPD
14, 17749–17816, 2014Modeling dust as mineral components
R. A. Scanza et al.
Title Page Abstract Introduction Conclusions References Tables Figures ◭ ◮ ◭ ◮ Back Close
Full Screen / Esc
Printer-friendly Version Interactive Discussion Discussion P a per | Discus sion P a per | Discussion P a per | Discussion P a per |
dust sample collection; this can impact measuring concentrations of smaller or highly aspherical particles (Reid et al., 2003), the non-uniformity of which further complicates the model verification process. As a way to compare observed mineralogy where par-ticle size distribution is not explicitly reported, the mass ratio of minerals with similar diameters are compared to the mass ratios of observed mineralogy (Claquin et al.,
5
1999).
The mixing ratio of minerals near the surface in CAM4 and CAM5 is compared to the only available observation (Kandler et al., 2009) of relative mineral volume abundance as a function of mean particle diameter (Fig. 4). Kandler et al. (2009) reports mineral fractions with particle diameters that do not match the modeled particle diameter for
10
Bin 1 in CAM4 and Modes 1 and 3 in CAM5. To compare the observed mineral frac-tions to the model, after converting observed volume fracfrac-tions to mass fracfrac-tions, the average mass abundance for CAM4 bin1 was related to particle diameters 0.16, 0.35 and 0.71 µm (Eqs. 7 and 8).
γρ=
RD1,+ 0.1
dV
dDdγ1dDd+
RD2,+ D2,−
dV
dDdγ2dDd+
R1
D3,− dV
dDdγ3dDd
R1
0.1 dV dDddDd
(7)
15
where
dV
dDd =c1
v
1+erf
lnDd/Ds
√
2 ln(σs)
exp " − D d λ 3# (8)
The upper and lower diameters are the middle of the particle diameters reported in
20
Kandler et al. (2009);D1,+=D2,−=(D1×D2) 0.5
=0.24 µm,D2,+=D3,−=(D2×D3) 0.5
=
0.5 µm. V is the normalized volume of dust aerosols with size Dd, cv=12.62 µm is
a normalization constant,ρis the density of a given mineral, andγ1–3are the observed
ACPD
14, 17749–17816, 2014Modeling dust as mineral components
R. A. Scanza et al.
Title Page Abstract Introduction Conclusions References Tables Figures ◭ ◮ ◭ ◮ Back Close
Full Screen / Esc
Printer-friendly Version Interactive Discussion Discussion P a per | Discus sion P a per | Discussion P a per | Discussion P a per |
size distribution at emission following brittle fragmentation theory (Kok, 2011). The size distribution at emission and the distribution observed for particles of diameters<1.0 µm are expected to be similar given the proximity of the measurements to the emission source as well as the negligible impact of gravitational settling. Particle diameters 1.6, 3.5 and 7.1 µm correspond well with bins 2–4, respectively. For CAM5, the
accumu-5
lation mode was matched with the correlation for bin 1 and the coarse mode average mass fraction of mineral species was estimated from Eqs. (9) and (10).
γρ=
RD1,+ 1
dV
dDdγ1dDd+
RD2,+ D2,−
dV
dDdγ2dDd+
R10 D3,−
dV
dDdγ3dDd
R10 1
dV dDddDd
(9)
where
10
dV
dDd =
0.5+0.5erf
lnDd/Dpg
√
2 ln σg
, (10)
is the size distribution at emission. The upper and lower diameters are the middle of the particle diameters reported in Kandler et al. (2009); D1,+=D2,−=(D1×D2)
0.5 =
(1.6×3.5)0.5=2.4 µm,D2,+=D3,−=(D2×D3) 0.5
=(3.5×7.1)0.5=5.0 µm.
15
Comparing the modeled distribution of minerals with observations that do not specify the particle size distribution is not very effective since there is a correlation between mineralogy for a given particle size distribution (Claquin et al., 1999). For this reason, the ratio of similarly-sized minerals is compared. The following mineral ratios were chosen because they matched the similar size criterion and had at least five locations
20
ACPD
14, 17749–17816, 2014Modeling dust as mineral components
R. A. Scanza et al.
Title Page
Abstract Introduction
Conclusions References
Tables Figures
◭ ◮
◭ ◮
Back Close
Full Screen / Esc
Printer-friendly Version Interactive Discussion
Discussion
P
a
per
|
Discus
sion
P
a
per
|
Discussion
P
a
per
|
Discussion
P
a
per
|
3 Results
3.1 Desert dust mineralogical distribution
The spatial distribution of minerals in CAM4 and CAM5 are different (Figs. 2 and 3) and while the distributions of minerals in soils are identical for both models (Fig. 1), there are different physical parameterizations for aerosol advection and deposition
be-5
tween CAM4 and CAM5. In order to discuss the significance of the spatial distribution of mineralogy and to give credibility to the simulations, the modeled distributions are evaluated with available observational data (Table 5).
Because of the size segregation of minerals in the soil materials (Claquin et al., 1999), it is ideal to compare the modeled mineralogy by size distribution. However,
10
there is limited size segregated data (Table 5; Fig. 4). For four of the seven miner-als considered from Kandler et al. (2009) – illite (Fig. 4a), kaolinite (Fig. 4b), quartz (Fig. 4c) and feldspar (Fig. 4f) – the simulations for both CAM4 and CAM5 simulate dynamic range in mineral mass fraction with particle size, while the mass fractions ob-served are relatively constant with size. This is because in the simulations we assumed
15
that the clay-sized minerals dominate the smaller size bins while the silt-sized minerals dominate the larger size bins. While the magnitude of gravitational settling for any given mineral is larger in the coarser bins, the relative mass for finer bins (1 and 2) is dom-inated by clay minerals and the relative mass for coarser bins (3 and 4) is domdom-inated by silt-sized minerals. The proximity of the observation to the source of emission is
an-20
other possible explanation for why the relative fractions sampled are constant with size, since transport and deposition have not significantly altered the mineral distributions at emission.
There is one instance of the dynamic variability of mass with size where the CAM4 simulation did not predict this variability for gypsum (Fig. 4g). In general, gypsum
con-25
ACPD
14, 17749–17816, 2014Modeling dust as mineral components
R. A. Scanza et al.
Title Page
Abstract Introduction
Conclusions References
Tables Figures
◭ ◮
◭ ◮
Back Close
Full Screen / Esc
Printer-friendly Version Interactive Discussion
Discussion
P
a
per
|
Discus
sion
P
a
per
|
Discussion
P
a
per
|
Discussion
P
a
per
|
part of the transported minerals observed during their field study. Given the discrep-ancies on how to measure gypsum concentrations along with atmospheric processing of gypsum (Glaccum and Prospero, 1980) that was not simulated in this study, the at-tempt to correlate gypsum observations with simulated gypsum concentrations is likely not very meaningful. Calcite (Fig. 4d) and hematite (Fig. 4e) are correlated with
obser-5
vations at this location, with hematite being most important for simulating the DRF in the shortwave, which is one of the primary goals of this study.
Next we compare the ratio of minerals available in the observations (Table 5). When comparing means between models and observations, we see a low bias in both models however CAM5 more closely matches the mean of observations. In general,
10
both CAM4 and CAM5 do not capture the dynamic range seen in the observations (Figs. 5–8) when comparing monthly mean model output to the month the observa-tions were made. For the comparison of kaolinite to illite, the mean observational ratio is 0.72±0.91 compared to the mean ratios for CAM4 and CAM5 of 0.55±0.18 and 0.63±0.28 respectively. K/I in CAM5 indicates some structure and range in possible
15
values; however the sites of observation are all in the Northern Hemisphere, except for one site in Australia, limiting comparisons where CAM5 predicts greater range (Fig. 5). The daily averaged mineral ratios for all days simulated indicates temporal variabil-ity on the same order of magnitude as the variabilvariabil-ity in the observations, suggesting that temporal variability can be playing a significant role in the observed ratios. The
20
silt-size mineral ratios are only compared for CAM4 since quartz is not explicitly mod-eled in CAM5 (Fig. 6). The mean in the observations for the ratios calcite to quartz and feldspar to quartz are 0.56±0.26 and 0.42±0.22 respectively and the means for CAM4 C/Q and F/Q are 0.32±0.08 and 0.32±0.09 respectively. Similarly to K/I, Figs. 7 and 8 indicate the inability of the model to capture the dynamic range of observed ratios when
25
ACPD
14, 17749–17816, 2014Modeling dust as mineral components
R. A. Scanza et al.
Title Page
Abstract Introduction
Conclusions References
Tables Figures
◭ ◮
◭ ◮
Back Close
Full Screen / Esc
Printer-friendly Version Interactive Discussion
Discussion
P
a
per
|
Discus
sion
P
a
per
|
Discussion
P
a
per
|
Discussion
P
a
per
|
compare the model simulations monthly means to the month the observations were made. Therefore, while the simulated monthly mineral ratios do not appear to have the dynamic variability from observations, this is likely at least partially an artifact of the smoothing effect from monthly averages. We see an increase in variability, partic-ularly for CAM5 when examining the daily averaged mineral ratios for each day from
5
2006–2011 (Fig. 5).
Modeled mineral ratio K/I is compared to ocean core sediment mineralogy for CAM4 (Fig. 7) and CAM5 (Fig. 8) (Biscaye, 1965). The mean ratio in the data is 1.14±3.7 and the mean ratio at the observation coordinates is the same for both CAM4 (0.62±0.17) and CAM5 (0.62±0.19) indicating an underestimate of mean and variability of this ratio
10
in both models. The correlations for both models are quite poor overall, and the range in values for CAM5 is similar to CAM4, with 95 % of data points falling between 0.4 and 1, compared to CAM4 with a range of 0.4 to 0.95. Note some resemblance of the spatial pattern of Biscaye’s data (Figs. 7b and 8b) with CAM5 (Fig. 8a) around N. Africa and eastern S. America. The latitude band correlations for CAM4 and CAM5 are poor
15
although CAM5 appears to have more variability along the equator. While these figures do not capture the range in the data, the comparison is inherently difficult given ocean circulation of dust from deposition on the surface to sedimentation on the ocean floor that the simulated deposition distributions cannot be expected to capture (Han et al., 2008; Siegel and Deuser, 1997). This along with physical and chemical processing
20
during atmospheric transport and sedimentation further hinder the comparison. Summarizing the above comparisons, the mineralogical distributions simulated by the model do not have the dynamic range that the few available observations indicate. However, multiple factors are responsible, from differing time scales of observations to the atmospheric processing of dust that is not yet included in these models. When
25
ACPD
14, 17749–17816, 2014Modeling dust as mineral components
R. A. Scanza et al.
Title Page
Abstract Introduction
Conclusions References
Tables Figures
◭ ◮
◭ ◮
Back Close
Full Screen / Esc
Printer-friendly Version Interactive Discussion
Discussion
P
a
per
|
Discus
sion
P
a
per
|
Discussion
P
a
per
|
Discussion
P
a
per
|
type, which is an oversimplification. As this study was a first attempt at modeling global mineralogy and was primarily dedicated to building the framework required to carry multiple mineral tracers as well as synching them with the radiation codes, a module to simulate physical and chemical fractionation and processing of minerals during emis-sion and transport was not available for this study. Therefore, these simulations cannot
5
be expected to capture all the observed mineral characteristics of dust deposited away from the source. For example, observations suggest that calcite concentrations in air-borne dust are a function of the wind velocity that occurred during saltation, with the relative amount decreasing with increasing velocity (Caquineau et al., 1998; Gomes et al., 1990; Sabre et al., 1997), a process that is not included here. In addition, acidic
10
processing of calcite to gypsum would also result in less calcite abundance in collected dust and an overall increase in the abundance of clay. In the future, improvements to the simulation of the distribution of mineralogy, especially to better capture the dynamic range, are necessary.
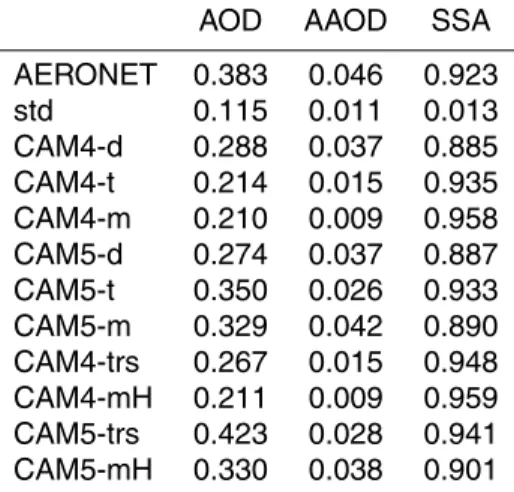
3.2 Aerosol optical depth and single scattering albedo 15
Annually averaged aerosol optical depth (AOD), absorbing aerosol optical depth (AAOD) and single scattering albedo (SSA) (Holben et al., 1998, 2001; Dubovik and King, 2000; Dubovik et al., 2000) are simulated for each model at 533nm and compared to annually averaged AERONET retrievals. AERONET sites were chosen in regions where the modeled AODdust>AODtotal×0.5 (at 533 nm) to restrict the comparison to
20
dust. The total AOD depends on the concentration of suspended aerosols and the degree to which they attenuate radiation. For both CAM4 and CAM5, the simulations with mineralogy have smaller values compared to the simulations with tuned dust at nearly every point (Fig. 9a and b); however both tuned and speciated cases agree with measurements of AOD much better than AAOD. This is due to the shortwave
extinc-25
ACPD
14, 17749–17816, 2014Modeling dust as mineral components
R. A. Scanza et al.
Title Page
Abstract Introduction
Conclusions References
Tables Figures
◭ ◮
◭ ◮
Back Close
Full Screen / Esc
Printer-friendly Version Interactive Discussion
Discussion
P
a
per
|
Discus
sion
P
a
per
|
Discussion
P
a
per
|
Discussion
P
a
per
|
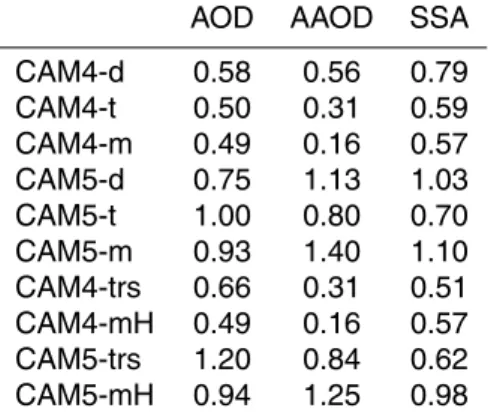
with mineralogy perform worse than those with tuned dust (Table 6) when comparing mean and range for AOD. The comparison for AAOD is poor for the tuned and min-eralogy simulations with CAM4 however CAM5-m matches observations reasonably well with a predicted range larger than observed (Table 6b). CAM4-t and CAM5-t are more accurate at capturing the mean observed SSA across many sites while
CAM4-5
m performs worse than CAM5-m (Fig. 9e and f). CAM4-m SSA is biased high and has decreased range of variability and less correlation than CAM4-t (Table 6). CAM5 overall is dustier with 8.2 % of gridcells meeting AODdust>0.5×AODtotal, and 27.5 %
of these have column hematite percents greater than 1.5 %. In contrast, CAM4-m has 56 % fewer “dusty” gridcells with only 17.6 % of these containing total column hematite
10
percents above 1.5 %. While CAM5-t does well in matching AERONET SSA. CAM5-m predicts lower SSA and a greater range than observed (Fig. 9f).
Adding mineralogy to CAM4 does not seem to improve the simulation of AERONET AOD, AAOD, and SSA, whereas it does marginally in CAM5. Adding mineralogy to CAM5 adds to the quality of the simulation at the AERONET sites because of the
15
higher amounts of dust, as well as more hematite (Figs. 10 and 11). Black carbon is a more efficient absorber than hematite (SSA=0.17 vs. 0.6, for black carbon and hematite, respectively). Black carbon is twice as abundant in CAM4-m as in CAM5-m in dust-doCAM5-minated regions and it doCAM5-minates the SSA signal (Figs. 10 and 11). The lower black carbon concentrations may be due to the internal mixture assumption for
20
BC in CAM5 (Wang et al., 2013). Recognize that while the aerosol forcing datasets and meteorology were the same for both simulations, the simulations of CAM4 and CAM5 have many differences, including physical parameterizations for aerosol transport and deposition along with different radiation schemes. Overall, inclusion of mineralogy did not improve comparisons at AERONET stations for AOD, AAOD and SSA.
ACPD
14, 17749–17816, 2014Modeling dust as mineral components
R. A. Scanza et al.
Title Page
Abstract Introduction
Conclusions References
Tables Figures
◭ ◮
◭ ◮
Back Close
Full Screen / Esc
Printer-friendly Version Interactive Discussion
Discussion
P
a
per
|
Discus
sion
P
a
per
|
Discussion
P
a
per
|
Discussion
P
a
per
|
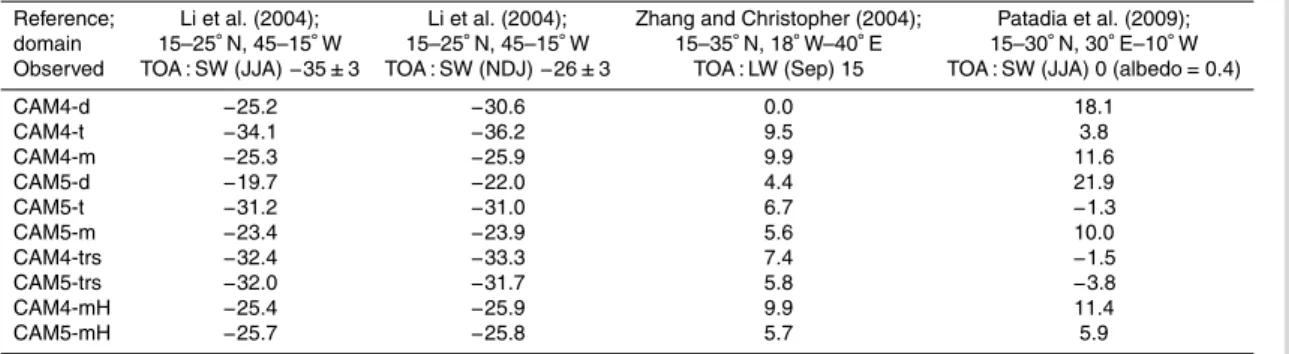
3.3 Radiative forcing
3.3.1 Clear-sky radiative forcing
The TOA radiative forcing efficiency (W m−2τ−1) of dust is compared to clear-sky satel-lite based observations over N. Atlantic (Li et al., 2004) and the Sahara (Zhang and Christopher, 2003; Patadia et al., 2009) for both simulations with tuned dust and
min-5
eralogy in CAM4 and CAM5 (Table 7). Out of the three shortwave observations con-sidered, CAM4-t matches two of the observations better than CAM4-m. The clear-sky forcing efficiency observed by Li et al., 2004 during June, July and August (JJA) over the N. Atlantic is captured by CAM4-t, while CAM4-m simulated a smaller forcing. The extinction coefficient of tuned dust is larger than that of individual minerals; the
refrac-10
tive indices of tuned dust were calculated based on Maxwell-Garnet internal mixture of non-absorbing clays and quartz and absorbing hematite. The real portion (scattering) and the imaginary portion (absorbing) of the refractive index at 533 nm are larger for tuned dust than for each of the minerals except for hematite. Hematite has much larger imaginary and real portions however the density of hematite is twice as large as the
15
densities for tuned dust and for each of the minerals. Since the mass extinction effi -ciency is a factor of 1/density, hematite has a smaller mass extinction efficiency than all other minerals. The reason that CAM4-m has a smaller forcing efficiency is that for similar dust and mineral loads, the amount of radiation scattered back to space is dom-inated by the greater extinction efficiency of tuned dust, e.g tuned dust results in 13 %
20
more extinction per unit mass than mineralogy. For the “low” dust season, November, December and January (NDJ), the same phenomena is found: with similar dust and mineral loads, tuned dust results in a more negative forcing efficiency at TOA for the CAM4-t case. However in this case, CAM4-m more closely matches the observation; however, the significance of this is not clear as clear-sky measurements during winter
25
ACPD
14, 17749–17816, 2014Modeling dust as mineral components
R. A. Scanza et al.
Title Page
Abstract Introduction
Conclusions References
Tables Figures
◭ ◮
◭ ◮
Back Close
Full Screen / Esc
Printer-friendly Version Interactive Discussion
Discussion
P
a
per
|
Discus
sion
P
a
per
|
Discussion
P
a
per
|
Discussion
P
a
per
|
is significantly more absorbing with higher column concentration of hematite, despite similar loadings and optical depths (Fig. 16). Over the same domain but for the low dust season, the mineralogy simulation more closely matches the observation, most likely from the more absorbing mineralogy compared to the tuned dust. While both mineralogy simulations (CAM4-m and CAM5-m) fall within the range of the observation
5
for NDJ season, the dust loading differs between these, 0.38 and 0.26 Tg respectively with optical depths 0.054 and 0.046. The extinction per mass is higher for CAM5-m however since CAM5-m is also more absorbing than CAM4-m, the resulting RFE’s are similar.
The clear-sky forcing efficiency over North Africa is approximately 0 in the
observa-10
tions for a surface albedo of 0.4 during “high” dust season (JJA) (Patadia et al., 2009). Both CAM4 and CAM5 simulations with tuned dust match the observations better than the simulations with mineralogy. Over N. Africa, there are competing mechanisms for the TOA forcing efficiency in both reality and modeling. Tuned dust in CAM4 is more absorbing than CAM4-m however it is also more efficient at scattering incoming SW
15
radiation. In addition to scattering more incoming radiation (cooling at TOA), it will also absorb more SW radiation reflected from the surface (warming at TOA). CAM4-m is not as efficient at scattering incoming solar radiation and results in less cooling at the sur-face. Since TOA forcing is the sum of forcing at the surface and in the atmosphere, the smaller cooling from CAM4-m and similar atmospheric heating for both CAM4-t and
20
CAM4-m results in an increased positive forcing at TOA for CAM4-m. In CAM5, the simulation with mineralogy has relatively high concentrations of hematite in this region (Figs. 3d and 11a) hence low SSA (Fig. S3), and absorbs both incoming solar radiation and reflected SW radiation; for similar loads and optical depths, CAM5-m simulates in-creased surface cooling and four times as much heating in the atmosphere, explaining
25
the net positive SW forcing at TOA.
ACPD
14, 17749–17816, 2014Modeling dust as mineral components
R. A. Scanza et al.
Title Page
Abstract Introduction
Conclusions References
Tables Figures
◭ ◮
◭ ◮
Back Close
Full Screen / Esc
Printer-friendly Version Interactive Discussion
Discussion
P
a
per
|
Discus
sion
P
a
per
|
Discussion
P
a
per
|
Discussion
P
a
per
|
prescribed for both tuned dust and mineralogy. CAM5-m does worse than CAM5-t for this observation. For CAM5-m, the clay minerals and hematite were the only minerals included, and the silt-sized minerals such as quartz and calcite were not explicitly mod-eled. Quartz dominates absorption in the IR spectrum with additional significant contri-butions from both the silt-sized and clay minerals (Sokolik and Toon, 1999). CAM5-m
5
is not capturing the quartz signal or the other silt-sized mineral signals, and thus it simulates less surface heating and a smaller LW TOA forcing. The simulations of dust and mineralogy in CAM4 and CAM5 only account for absorption in the LW and exclude scattering which has been shown to underestimate the LW forcing by up to 50 % at TOA and 15 % at the surface (Dufresne et al., 2002) and serves to explain why both
10
models underestimate the observed forcing.
3.3.2 All-sky radiative forcing
All-sky radiative forcing is a delicate balance between heating and cooling of SW and LW radiation (Table 8, Figs. 12–14). The differen.ce between tuned dust and mineral-ogy for the all-sky TOA radiative forcing spatial distribution for CAM4 (Fig. 14a and c)
15
indicates intensified heating over desert and less cooling everywhere else. This is con-sistent with the more absorbing nature of tuned dust whose optical properties represent an internal mixture of minerals compared with mineralogy with combined optics of the external mixing of illite, kaolinite, montmorillonite, feldspar and hematite, along with an internal mixture of calcite, montmorillonite, quartz and illite; the result for CAM4-t being
20
increased surface cooling with nearly identical atmospheric forcings and an overall, al-beit small, net cooling compared to the small overall net warming from CAM4-m. On the other hand, the spatial pattern for CAM5-m indicates an intensification of heating over source regions, largely due to the SW atmospheric heating from hematite’s absorption of both incoming and reflected SW radiation (Figs. 14d and 3d, Table 8b). Over bright
25
ACPD
14, 17749–17816, 2014Modeling dust as mineral components
R. A. Scanza et al.
Title Page
Abstract Introduction
Conclusions References
Tables Figures
◭ ◮
◭ ◮
Back Close
Full Screen / Esc
Printer-friendly Version Interactive Discussion
Discussion
P
a
per
|
Discus
sion
P
a
per
|
Discussion
P
a
per
|
Discussion
P
a
per
|
larger absorption of incoming solar radiation of CAM5-m does not change the SW forc-ing at TOA, the absorption of reflected SW does affect this, and over desert, it is clear that both these processes result in a positive atmospheric forcing twice as large as the cooling at the surface (Table 8b). Net surface forcing for CAM4-t, CAM4-m and CAM5-t have similar spatial patterns as TOA forcing, however, CAM5-m indicates much greater
5
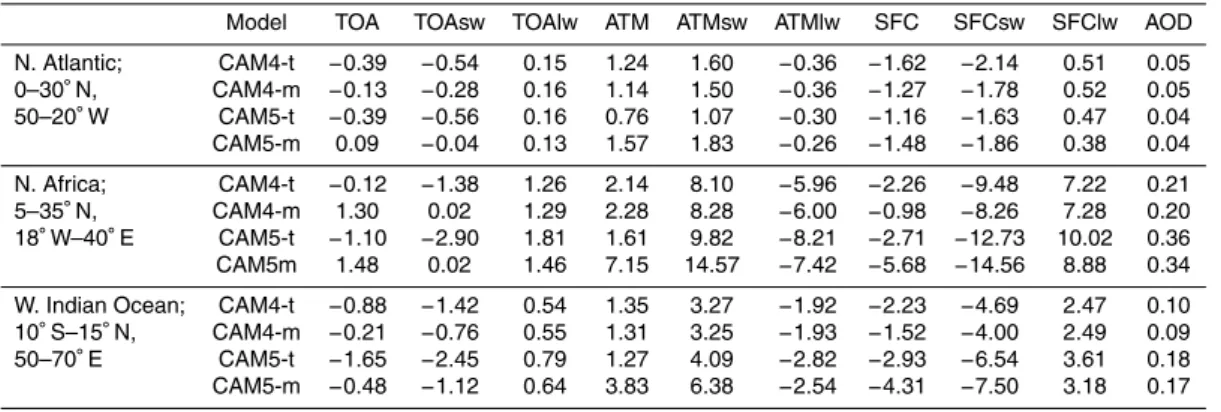
surface cooling everywhere (Fig. 12). The spatial pattern of net atmospheric forcing for CAM4-t and CAM4-m are nearly identical (Fig. 13a and c), arising from the very similar SSA maps (Fig. 16a and c); for CAM5-m, the atmospheric heating due to both absorp-tion of incoming and reflected SW is clearly seen compared to CAM5-t (Fig. 13b and d). In the three major regions contributing to RF from dust, N. Atlantic, N. Africa, W. Indian
10
Ocean (Yoshioka et al., 2007), the changes between mineralogy and tuned dust are dominated by SW forcing (Table 8b).
To summarize, there are two different mechanisms for increased positive TOA forcing for both models with mineralogy. For CAM4, while the SSA is higher for the case with explicit mineralogy, the overall extinction efficiency is higher for tuned dust, largely due
15
to the fact that the optical properties for tuned dust are simulated as an internal mixture of illite, kaolinite, calcite, quartz and hematite. For CAM5, both dust and mineralogy is internally mixed with other aerosol species, however the SSA for mineralogy is much lower due to the high concentrations of hematite over key regions contributing to the global RF from dust. While it is not clear that mineralogy improves global dust RF, and
20
in several observations appears to do worse, all four simulations fall within the range of previous RF modeling estimates (Yoshioka et al., 2007; Woodward, 2001; Miller et al., 2004, 2006).
A comparison to radiative forcing efficiency from another study that included miner-alogy (Balkanski et al., 2007) is not straightforward since that study inferred that the
25
ACPD
14, 17749–17816, 2014Modeling dust as mineral components
R. A. Scanza et al.
Title Page
Abstract Introduction
Conclusions References
Tables Figures
◭ ◮
◭ ◮
Back Close
Full Screen / Esc
Printer-friendly Version Interactive Discussion
Discussion
P
a
per
|
Discus
sion
P
a
per
|
Discussion
P
a
per
|
Discussion
P
a
per
|
report TOA forcing efficiency which is too cooling compared to the clear-sky RFE re-ported by Li et al. (2004), while the simulated surface RFE matched observations. From this, the atmospheric heating efficiency was underestimated. The results for clear-sky TOA forcing efficiency are less cooling in both CAM4-m and CAM5-m however the sur-face RFE in both cases is very similar to the observed −65±3 W m−2τ−1, −63 and
5
−64 W m−2τ−1
respectively. Additionally, both cases with mineralogy come close to the estimated atmosphere heating efficiency of 30±4 W m−2τ−1
, with values of 38 and 41 W m−2τ−1for CAM4-m and CAM5-m respectively.
3.4 Sensitivity to size
Changing the assumed optical properties derived from optimized refractive indices
10
are most important in determining all-sky DRF t, CAM5-t), with size (CAM4-trs) and mineralogy (CAM4-m) following with comparable importance in CAM4 and with mineralogy (CAM5-m) and then size in CAM5 (CAM5-trs) (Table 9). Compar-ing to clear-sky RFE observations, the order of importance is less clear for CAM4 with tuned optics, scavenging and release size distribution (CAM4-trs) doing worse
15
(−32.0 W m−2τ−1
) than CAM4-t (−33.9 W m−2τ−1
) over N. Atlantic JJA and better (−32.7 W m−2τ−1
) during NDJ than CAM4-t (−35.9 W m−2τ−1
) (Table 7). Comparing to observations from Patadia et al. (2009), both CAM4 and CAM5 with tuned dust plus release size-distribution (CAM4-trs and CAM5-trs) overcompensates the cooling effi -ciency while both simulations with mineralogy (CAM4-m and CAM5-m) predict heating
20
(Table 7). In general, the higher concentrations of small particles in the simulations using release sizes result in increased reflectivity and increased cooling at TOA. For clear-sky observations, it appears that size is more important than mineralogy, and of comparable importance to optics.
Comparing to AERONET retrievals, root mean square errors (RMSE) are calculated
25
ACPD
14, 17749–17816, 2014Modeling dust as mineral components
R. A. Scanza et al.
Title Page
Abstract Introduction
Conclusions References
Tables Figures
◭ ◮
◭ ◮
Back Close
Full Screen / Esc
Printer-friendly Version Interactive Discussion
Discussion
P
a
per
|
Discus
sion
P
a
per
|
Discussion
P
a
per
|
Discussion
P
a
per
|
simulations are similar and higher than for the tuned plus release size case (CAM4-trs) (0.197, 0.152, 0.200 for CAM4-t, CAM4-trs and CAM4-m, respectively). For AAOD and SSA however, RMSE for mineralogy is the highest followed by identical errors for the tuned and tuned release size simulations, and by tuned plus release size then tuned for AAOD (0.032, 0.032, 0.038 for CAM4-t, CAM4-trs, and CAM4-m) and SSA
5
(0.020, 0.029, 0.039 for CAM4-t, CAM4-trs, and CAM4m), respectively. This indicates that when comparing to AOD for CAM4, the release particle size distribution provides the best match to observations with mineralogy and tuned dust approximately equal in ability. However for AAOD and SSA, mineralogy has the poorest match to observations while the tuned cases with optimized size distribution and with release size
distribu-10
tion are either equal in ability (AAOD) or the release size distribution performs worse (SSA). For CAM5, RMSE for AOD is lower for each case than CAM4. The CAM5 sim-ulation with tuned dust better matches observations followed by mineralogy and then tuned plus release size distribution (0.112, 0.124, 0.118 for CAM5-t, CAM5-trs and CAM5-m respectively). Similarly, for AAOD, the RMSE for the CAM5 simulations are
15
all lower than for CAM4. Again, the CAM5 simulation with mineralogy best matches observations followed by tuned plus release dust and then tuned (0.023, 0.022, 0.015 for CAM5-t, CAM5-trs and CAM5-m, respectively). And for RMSE for SSA, the simula-tion with mineralogy most poorly matches observasimula-tions while the simulasimula-tion with tuned dust best matches (0.017, 0.023, 0.036 for CAM5-t, CAM5-trs, and CAM5-m,
respec-20
tively). Thus CAM5 better captures the variability in AERONET than CAM4 however, the simulations with tuned dust and release size distribution help the comparison for CAM4 and hinder it for CAM5. With the exception of AAOD in CAM5, the tuned runs overall are most accurate with mineralogy and tuned plus release size distribution fol-lowing depending on the measurement in question (Fig. 15). Despite this, the size
25