Exhaled Breath Analysis for Lung Cancer
Detection Using Ion Mobility Spectrometry
Hiroshi Handa1, Ayano Usuba1, Sasidhar Maddula2, Jo¨rg Ingo Baumbach3, Masamichi Mineshita1, Teruomi Miyazawa1*
1.Division of Respiratory and Infectious Diseases, Department of Internal Medicine, St. Marianna University School of Medicine, Kawasaki-shi, Kanagawa, Japan,2.B&S Analytik, BioMedicalCenter, Dortmund, Germany,3.Reutlingen University, Faculty Applied Chemistry, Reutlingen, Germany
Abstract
Background:Conventional methods for lung cancer detection including computed tomography (CT) and bronchoscopy are expensive and invasive. Thus, there is still a need for an optimal lung cancer detection technique.
Methods:The exhaled breath of 50 patients with lung cancer histologically proven by bronchoscopic biopsy samples (32 adenocarcinomas, 10 squamous cell carcinomas, 8 small cell carcinomas), were analyzed using ion mobility spectrometry (IMS) and compared with 39 healthy volunteers. As a secondary assessment, we compared adenocarcinoma patients with and without epidermal growth factor receptor (EGFR) mutation.
Results: A decision tree algorithm could separate patients with lung cancer including adenocarcinoma, squamous cell carcinoma and small cell carcinoma. One hundred-fifteen separated volatile organic compound (VOC) peaks were analyzed. Peak-2 noted as n-Dodecane using the IMS database was able to separate values with a sensitivity of 70.0% and a specificity of 89.7%. Incorporating a decision tree algorithm starting with n-Dodecane, a sensitivity of 76% and specificity of 100% was achieved. Comparing VOC peaks between
adenocarcinoma and healthy subjects, n-Dodecane was able to separate values with a sensitivity of 81.3% and a specificity of 89.7%. Fourteen patients positive for EGFR mutation displayed a significantly higher n-Dodecane than for the 14 patients negative for EGFR (p,0.01), with a sensitivity of 85.7% and a specificity of 78.6%.
Conclusion:In this prospective study, VOC peak patterns using a decision tree algorithm were useful in the detection of lung cancer. Moreover, n-Dodecane analysis from adenocarcinoma patients might be useful to discriminate the EGFR mutation.
OPEN ACCESS
Citation:Handa H, Usuba A, Maddula S, Baumbach JI, Mineshita M, et al. (2014) Exhaled Breath Analysis for Lung Cancer Detection Using Ion Mobility Spectrometry. PLoS ONE 9(12): e114555. doi:10.1371/journal.pone.0114555
Editor:Francisco Rena´n Aguayo, University of Chile, Chile
Received:July 11, 2014
Accepted:November 11, 2014
Published:December 9, 2014
Copyright:ß2014 Handa et al. This is an open-access article distributed under the terms of the
Creative Commons Attribution License, which permits unrestricted use, distribution, and repro-duction in any medium, provided the original author and source are credited.
Data Availability:The authors confirm that all data underlying the findings are fully available without restriction. All relevant data are within the paper.
Funding:This study was supported by the Japan Society for Promotion of Science and by Grants-in-Aid for Scientific Research (20410061, 24800068). Dr. Baumbach was supported by Deutsche Forschungsgemeinschaft (DFG, Germany) within the Collaborative Research Center
(Sonderforschungsbereich) SFB 876 ‘‘Providing Information by Resource-Constrained Analysis’’, project TB1 ‘‘Resource-Constrained Analysis of Spectrometry Data’’. The funders had no role in study design, data collection and analysis, decision to publish, or preparation of the manuscript.
Introduction
Recently the National Lung Screening Trial team reported that screening with low dose computed tomography (CT) reduced the mortality of lung cancer by about 20%. Low dose CT is an important screening test; however, it is expensive and there are risks associated with radiation exposure. On the other hand, breath analysis is easy-to-use and radiation-free. Gas chromatography and mass-spectrometry (GC/MS) [1–2] and chemical sensor matrices: quartz microbalance [3], surface acoustic wave [4], carbon-polymer array [5], colorimetric sensor [6], single-walled carbon nanotube [7] and gold nanoparticles [8], can detect volatile organic compounds (VOCs) in lung cancer from human breath. In addition, canine scent has focused on the diagnosis of lung cancer [9–10].
Ion mobility spectrometry (IMS) with multi-capillary column (MCC), a breath analysis device, can detect specific VOCs in patients with lung cancer [11]. IMS/ MCC can detect a very low concentration of VOCs (normally in the ppbv- to pptv-range, pg/L to ng/L-range) in less than 8 minutes total analysis time and is superior to GC/MS as it can be applied at the bed-site and direct sampling can be taken without preparation [11–21]. In Europe, 550 MBq b-radiation sources are acceptable; however, for the Japanese market, regulations restrict63Nib-radiation sources to under 100 MBq. Therefore in this study, a 95 MBq ß-ionization source was used. The initial aim of this study is to confirm the reproducibility of IMS/ MCC results (using BioScout: B&S Analytik, Dortmund, Germany) for a Japanese population.
Chemotherapy of lung cancer patients depends upon performance status, histological features, tumor staging, and molecular characteristics. Previously, 2 drugs combination chemotherapy including platinum has been performed as a first-line treatment for patients with advanced non-small cell lung cancer (NSCLC) considered as a single disease despite of its histologic and molecular heterogeneity. However, recently, the discovery of molecular abnormalities such as epidermal growth factor receptor (EGFR) mutation, and new agents such as EGFR tyrosine kinase inhibitor changed treatment of NSCLC. These led NSCLC treatment to the personalized therapy. Differences of histologic type and genetic alterations are the most important factors in decision of current lung cancer treatment. The second aim of this study is to confirm whether VOC patterns are able to detect histologically confirmed lung cancers, and driver mutations such as EGFR mutation.
Methods
registered with the University Hospital Medical Information Network Clinical Trial Registry (UMIN-CTR) (UMIN000006696, 000008328).
The exhaled breath of 50 patients (31 men, 19 women), with lung cancer confirmed histologically by bronchoscopic biopsy specimen was compared with 39 healthy volunteers (25 men, 14 women). Smoking histories of subjects were measured using pack-years.
Ion mobility spectrometry (IMS)
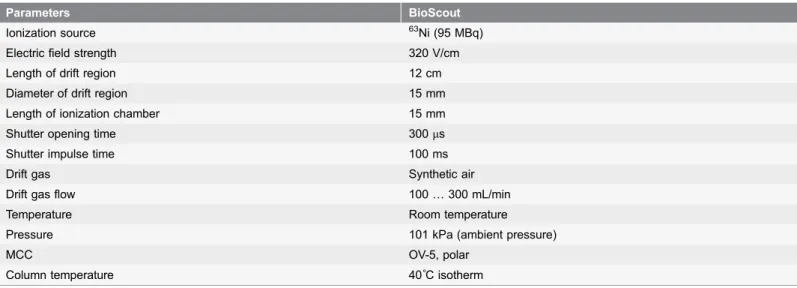
IMS (BioScout, B&S Analytik, Dortmund, Germany) combined with a multi-capillary column (MCC, type OV-5, Multichrom Ltd, Novosibirsk, Russia) and coupled to a spirometer (Ganhorn Medizin Electronic, Niederlauer, Germany), as a CO2-controlled sample inlet unit was utilized.Table 1shows the characteristics of ion mobility spectrometer.
The major parameters of breath analysis have been previously summarized [11–
21] and will be discussed here in brief. IMS refers to the detection of ions formed from analysis at ambient pressure within a drift tube. The term ion mobility spectrometry refers to the method characterizing analysis in gases by their gas phase ion mobility. Normally, the drift time of ion swarms, formed using suitable ionization sources then passing through electrical shutters, are measured. Ion mobility for analysis can provide a means for detecting and identifying vapors. The drift velocity is related to the electric field strength by the mobility. Therefore, the mobility is proportional to the inverse drift time, which will be measured at a fixed drift length. IMS combines both high sensitivity and relatively low technical expenditure with a high-speed data acquisition. The time to acquire a single spectrum is in the range of 10 ms to 100 ms. Thus, IMS is an instrument suitable for process control, but due to the occurrence of ion-molecule reactions and relatively poor resolution of the species formed, it is generally not for
identification of unknown compounds. Compared with mass spectrometry, the mean free path of the ions is much smaller as the dimensions of the instrument. An ion formed has a high number of collisions with carrier gas molecules on the drift way towards the Faraday-plate. However, because of the high vacuum conditions in mass spectrometry, an ion formed there will normally have no collision with other molecules during the drift. In the small time gap between the collisions the ion will gain energy from the external electric field and lose the energy by the next collision process. Consequently, a rather constant drift velocity will be reached. Therefore, an ion swarm drifting under such conditions
experiences a separation process that is based on different drift velocities of ions with different masses or geometrical structures. Collection of these ions on a Faraday-plate delivers a time dependent signal corresponding to the mobility of the arriving ions. Such an ion mobility spectrum contains information on the nature of the different compounds present in the sample gas.
information density like mass spectrometry. Other techniques are smaller and more economical on power like surface acoustic wave sensors. IMS shows its specificity depending on ion size, chemistry and nature of the sample. It can be very high, through a combination of drift time and ionization properties. When it is always possible, hyphenated GC-IMS are preferred. By itself IMS is superior to MS and GC with respect to utilities, gas consumption, no vacuum is required and relatively low power requirements.
For spectrometry, a 95 MBq63Ni ß-radiation source was applied for the ionization of carrier gas (synthetic air). Generally, the total number of ions formed is slightly lower using 95 MBq compared to 550 MBq. As a result, the total number of ions with the reactant ion peak in synthetic air will decrease the linear range marginally. For application cases like breath analysis mostly working on detection limits of analysis, the occurrence of analysis plays a more important role than the linear range. As shown later in this paper, the discrimination power and the detectability of the analyses in exhaled breath are not affected by the difference in the activity of the ionization source.
The spectrometer was connected to a polar MCC that functioned as a pre-separation unit. For MCC, the analyses of exhaled breath were sent through 1000 parallel capillaries, each with an inner diameter of 40 mm and a film thickness of 200 nm. The total diameter of the separation column was 3 mm.
The exhaled breath of subjects was taken directly through the spirometer using a standard mouthpiece containing an ultrasonic sensor without registering the 500 mL of dead volume on expiration. The contents of a 10 mL sample loop were added to the inlet of the MCC and transported to IMS, which was directly connected to the ionization region after pre-separation. The MCC and drift tube were held at 40
˚
C. The carrier and drift gas used was synthetic air (Nippon Megacare, Tokyo, Japan).Table 1.Characteristics of ion mobility spectrometer (BioScout).
Parameters BioScout
Ionization source 63Ni (95 MBq)
Electric field strength 320 V/cm
Length of drift region 12 cm
Diameter of drift region 15 mm
Length of ionization chamber 15 mm
Shutter opening time 300ms
Shutter impulse time 100 ms
Drift gas Synthetic air
Drift gas flow 100 … 300 mL/min
Temperature Room temperature
Pressure 101 kPa (ambient pressure)
MCC OV-5, polar
Column temperature 40˚C isotherm
Statistical analysis
The peaks were characterized using Visual Now 2.2 software (B&S Analytik, Dortmund Germany) [14],[22–25]. All peaks found were characterized by their position with drift time (corresponding 1/K0-value) and retention time, and their concentration related to the peak height (table 1). Details of the data analysis procedure were realized based on the methods described in detail previously [15],[22–26] and summarized here [27–31].
For the different groups and each of the peaks, Box-and-Whisker plots were generated. The rank sum was provided by Wilcoxon-Mann-Whitney test using Bonferroni correction. Visual Now 2.2 was used to rank the peaks with the highest difference between groups.
The relation between the peaks found in BioScout and the analysis was realized by comparison using the Visual Now Version 110801 database (B&S Analytik, Dortmund, Germany), obtained by measurements described previously [11], [32–
34]. In the present paper, peaks were correlated with the nearest analysis from the reference database and compared to the actual position of the peak.
Results
All lung cancers were histologically proven by bronchoscopic biopsy samples. In 28 patients, transbronchial biopsy in peripheral pulmonary lesions using both endobronchial ultrasonography with guide-sheath and virtual bronchoscopic navigation was confirmed. In 22 patients, centrally located tracheobronchial lesions could be directly confirmed. The types of lung cancer were: 32
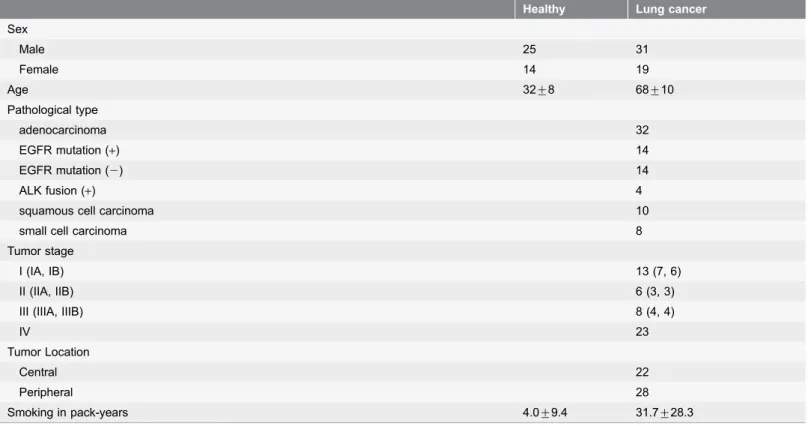
adenocarcinomas, 10 squamous cell carcinomas and 8 small cell carcinomas. Of 32 patients with adenocarcinoma, 14 were found to be positive for the EGFR mutation, 14 were negative for the EGFR mutation and 4 patients were positive for anaplastic lymphoma kinase (ALK) fusion. Lung cancer TNM staging showed: stage 1513 patients, stage 256 patients, stage 358 patients and stage 4523 patients. Seven of 39 healthy volunteers and 33 of 50 patients with lung cancer had smoking histories (table 2).
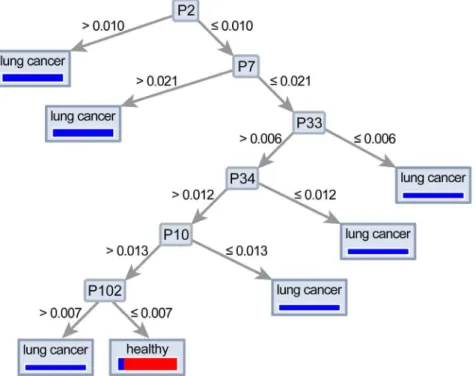
A total of 115 different peaks were compared with respect to the separation power in patients with lung cancer and healthy volunteers (Fig. 1). Ten VOC peaks were identified with significance higher than 95% (p,0.01) in patients with lung cancer. Of these, peak-2, which has the strongest VOC peak, is noted as the n-Dodecane using the IMS database and was able to separate values with a sensitivity of 70.0% and a specificity of 89.7%. The 9 other VOC peaks were also identified using the database (table 3). In addition, using a decision tree algorithm with n-Dodecane as starting point, a sensitivity of 76%, specificity of 100%, PPV of 100% and NPV of 76.4% were recorded (Fig. 2).
Table 2.Characteristics of patients.
Healthy Lung cancer
Sex
Male 25 31
Female 14 19
Age 32¡8 68¡10
Pathological type
adenocarcinoma 32
EGFR mutation (+) 14
EGFR mutation (2) 14
ALK fusion (+) 4
squamous cell carcinoma 10
small cell carcinoma 8
Tumor stage
I (IA, IB) 13 (7, 6)
II (IIA, IIB) 6 (3, 3)
III (IIIA, IIIB) 8 (4, 4)
IV 23
Tumor Location
Central 22
Peripheral 28
Smoking in pack-years 4.0¡9.4 31.7¡28.3
doi:10.1371/journal.pone.0114555.t002
Fig. 1. IMS chromatogram in a healthy volunteer.One hundred-fifteen VOC peaks were detected with ion mobility spectrometry in patients with lung cancer and healthy volunteers.
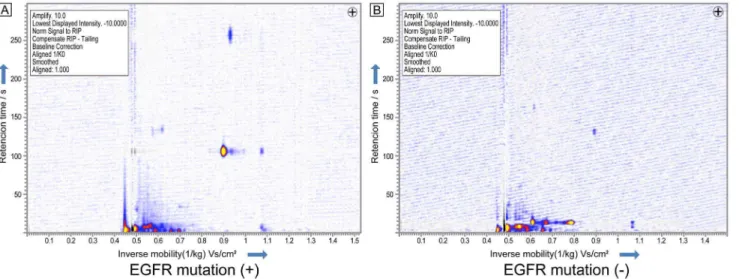
mutation displayed a significantly higher n-Dodecane VOC peak than for 14 lung adenocarcinoma patients negative for the EGFR mutation without 4 patients positive for ALK fusion (p,0.01), with a sensitivity of 85.7% and a specificity of 78.6% (Figs. 4 and 5).
Comparing VOC peaks between squamous cell carcinoma and the healthy group, 11 VOC peaks were found to have significance higher than 95% and peak-69 was able to separate the best value with a sensitivity of 97.4 and a specificity of
Table 3.Detection of VOC peaks using Visual Now database.
Peak Description 1/K0 RT P value
2 n-Dodecane 0.891 128.9 ,0.001
6 3-Methy1-15Butanol 0.737 11.0 ,0.001
11 2-Metylbutylacetat or 2-Hexanol 0.631 12.4 ,0.001
22 Cyclohexanon 0.564 11.6 ,0.01
23 Iso-propylamin 0.587 3.0 ,0.01
37 n-Nonal or Cyclohexanon 0.716 10.4 ,0.001
76 Ethylbenzol 0.564 9.8 ,0.01
86 Hexanal 0.633 7.0 ,0.01
109 Heptanal 0.671 13.6 ,0.01
110 3-Methyl-1-butanol 0.608 14.0 ,0.01
Lung cancer vs. healthy subjects.
doi:10.1371/journal.pone.0114555.t003
Fig. 2. Decision tree algorithm to discriminate between healthy and lung cancer patients.
Fig. 3. Box-and-whisker plots of peak-2 between healthy and lung adenocarcinoma patients.Peak 2 was significantly higher in patients with lung cancer (p,0.001). The box represents the 25th and 75th percentiles, the whiskers represent the range, and the lined box represents the median, whereas circles represent the mean. Lung adenocarcinoma patients revealed a significantly higher n-Dodecane VOC peak than healthy volunteers and the n-Dodecane VOC peak could separate values with a sensitivity of 81.3% and a specificity of 89.7%.
doi:10.1371/journal.pone.0114555.g003
Fig. 4. Box-and-whisker plots showing the IMS signal intensity of peak-2 in adenocarcinoma patients positive and negative for EGFR.Fourteen patients with EGFR mutation displayed a significantly higher n-Dodecane peak with a sensitivity of 85.7% and a specificity of 78.6% (p,0.01) than in 14 adenocarcinoma patients without the EGFR mutation.
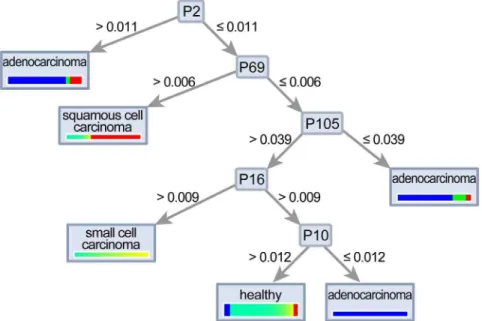
60.0% (p,0.001). Comparing VOC peaks between small cell carcinoma and healthy subjects, peak-6 was found to be significantly higher than 95% (p,0.01) with a sensitivity of 97.4% and a specificity of 50.0%. In addition, a decision tree algorithm could separate histological types of lung cancer and healthy volunteers (Fig. 6).
Discussion
In this prospective study, VOC peak patterns using a decision tree algorithm were useful in the detection of lung cancer. We found that some VOC peaks displayed significant differences between patients with adenocarcinoma, squamous cell carcinoma, small cell carcinoma and healthy volunteers. In addition, some VOC peaks positive for the EGFR mutation displayed significant increases, especially the n-Dodecane peak, which was the most valuable biomarker. VOC analysis using IMS is expected to be an important detection test for lung cancer. To our knowledge, this is the first study to show that n-Dodecane analysis from
adenocarcinoma patients might be useful to discriminate for the EGFR mutation. VOC analysis of lung cancer using GC/MS has been used extensively since 1985. In GC/MS, some VOC models were used to analyze significance, with a sensitivity and specificity of 54 to 100% and 67 to 100%, respectively [35]. Westhoff et al. was the first to report VOC analysis for lung cancer using IMS. He reported that 23 VOC peaks from exhaled breath could separate lung cancer and a healthy control, unaffected by smoking history [11]. However, spectrometry technologies using breath sampling were affected by ambient conditions, oral odor and nutrition. Direct airway sampling under bronchoscopy was negligible for oral odor and some VOC peaks displayed significant differences between the lung tumor site and the normal site. Moreover, some VOC peaks, 2-Butanol,
Fig. 5. IMS chromatogram in patients with lung adenocarcinoma positive for EGFR mutation (A) and negative for EGFR mutation (B).
2-Methylfuran and n-Nonanal, proved useful to separate adenocarcinoma and squamous cell carcinoma [36–37]. For lung adenocarcinoma, n-Dodecane was found to be an important VOC peak for both breath analysis and bronchoscopic sampling and was reported to be associated to patients with lung cancer [36–37].
It is known that East Asian NSCLC patients have higher instances of EGFR mutation [38–40]. Driver mutations, including EGFR, have focused on lung cancer and other malignant tumors [41–43]. The EGFR mutation has a higher instance than other driver mutations in lung cancer and is sensitive to the EGFR tyrosine kinase inhibitor. The results of this study show that lung adenocarcinoma positive for the EGFR mutation tends to increase the intensity of some VOC peaks using IMS. EGFR may have a specific metabolism that may produce various VOCs. The detection of EGFR mutation needs surgical specimen, bronchoscopic or CT-guided needle biopsy tissue, bronchial lavage fluid and pleural effusion with tumor cell. A previous study reported exhaled breath condensate could evaluate EGFR mutation. However it was still difficult to detect EGFR mutations in exhaled breath condensate because cellular components presented in exhaled breath condensate are not representative of the tumor [44–45]. The analysis of VOC patterns including a decision tree algorithm may be useful to detect EGFR mutation emitted from lung cancer cell lines in the future.
This study had some limitations. First, the sample size was small and larger sample studies are required. Although more patient breath samples are needed to overcome potential problems with statistical investigations, in previous literature sample sizes for breath analysis had been smaller when compared to the present study [36–37]. Beside the major question to have more breath samples of patients
Fig. 6. A decision tree algorithm could separate small cell carcinoma, squamous cell carcinoma and adenocarcinoma.
than peaks to overcome potential problems with statistical investigations in general, here 89 samples were investigated and 115 peaks were found. Second, VOCs in patients with lung cancer may be affected by smoking history. It should be noted, if the differences were not related to tobacco smoking in lung cancer patients, which was considered in detail by Westhoff et al. [11] showing, that in both groups including a higher number of smokers and non-smokers the differentiation using ion mobility spectrometry was successful. For the molecules investigated by IMS in this study, the differences were independent of smoking status and significant for both groups. In the study of Westhoff et al. [11]. there was no database available to identify the analysis. Recently, Darwiche et al. [36] showed by comparison of measurements taking samples of air from the same patient at the cancer site and non-cancer site during bronchoscopy, differences found were related to the place the sample was taken, directly over cancer cells or on the other lung site. Third, in accordance with Japanese regulations, restrictions of63Nib-radiation sources of under 100 MBq have been set for this Japanese pilot study, which is lower than European restrictions. However, the current study results show that IMS with a 95 MBq b-radiation source could discriminate between healthy volunteers and patients with lung cancer successfully. Therefore, creating a database for the Asian population in relation to VOC peaks and substances may be required. In future studies, multi-center trials using IMS are needed to analyze lung cancer.
Acknowledgments
The authors would like to thank Mr. Jason Tonge for manuscript preparation.
Author Contributions
Conceived and designed the experiments: TM HH. Performed the experiments: AU. Analyzed the data: SM JB. Contributed reagents/materials/analysis tools: MM. Wrote the paper: HH TM JB.
References
1. Gordon SM, Szidon JP, Krotoszynski K, Gibbons RD, O’Neill HJ(1985) Volatile organic compounds in exhaled air from patients with lung cancer. Clin Chem 31: 1278–1282.
2. Phillips M, Cataneo RN, Cummin AR, Gagliardi AJ, Gleeson K, et al.(2003) Detection of lung cancer with volatile markers in the breath. Chest 123: 2115–23.
3. Di Natale C, Macagnano A, Martinelli E, Paolesse R, D’Arcangelo G, et al. (2003) Lung cancer identification by the analysis of breath by means of an array of non-selective gas sensors. Biosens Bioelectron 18: 1209–1218.
4. Chen X, Cao M, Li Y, Hu W, Wang P, et al.(2005) A study of an electronic nose for detection of lung cancer based on a virtual SAW gas sensors array and imaging recognition method. Meas Sci Technol 16: 1535–1546.
6. Mazzone PJ, Hammel J, Dweik RA, Na J, Czich C, et al.(2007) Lung cancer diagnosis by the analysis of exhaled breath with a colorimetric sensor array. Thorax 62: 565–568.
7. Peng G, Trock E, Haick H(2008) Detecting simulated patterns of lung cancer biomarkers by random network of singlewalled carbon nanotubes coated with nonpolymeric organic materials. Nano Lett 8: 3631–3635.
8. Peng G, Tisch U, Adams O, Hakim M, Shehada N, et al.(2009) Diagnosing lung cancer in exhaled breath using gold nanoparticles. Nat Nanotechnol 4: 669–673.
9. McCulloch M, Jezierski T, Broffman M, Hubbard A, Turner K, et al.(2006) Diagnostic accuracy of canine scent detection in early- and late-stage lung and breast cancers. Integr Cancer Ther 5: 30–9.
10. Ehmann R, Boedeker E, Friedrich U, Sagert J, Dippon J, et al.(2012) Canine scent detection in the diagnosis of lung cancer: revisiting a puzzling phenomenon. Eur Respir J 39: 669–76.
11. Westhoff M, Litterst P, Freitag L, Urfer W, Bader S, et al.(2009) Ion mobility spectrometry for the detection of volatile organic compounds in exhaled breath of patients with lung cancer: results of a pilot study. Thorax 64: 744–748.
12. Junger M, Bo¨deker, Baumbach JI (2010) Peak assignment in multi-capillary column -ion mobility spectrometry using comparative studies with gas chromatography-mass spectrometry for exhalred breath analysis. Anal Bioanal Chem 396: 471–482.
13. Bunkowski A, Boedeker B, Bader S, Westhoff M, Litterst P, et al.(2009) MCC/IMS signals in human breath related to sarcoidosis-results of a feasibility study using an automated peak finding procedure. J Breath Res 3: 046001.
14. Westhoff M, Litterst P, Freitag L, Baumbach JI(2007). Ion mobility spectrometry in the diagnosis of Sarcoidosis: Results of a feasibility study. J Physiol Pharmacol 58: 739–751.
15. Westhoff M, Litterst P, Maddula S, Bo¨deker B, Rahmann S, et al.(2010) Differentiation of chronic obstructive pulmonary disease (COPD) including lung cancer from healthy control group by breath analysis using ion mobility spectrometry. Int J Ion Mobil Spectrom 13: 131–139.
16. Baumbach JI(2006) Process analysis using ion mobility spectrometry. Anal Bioanal Chem 384: 1059– 1070.
17. Bunkowski A, Maddula S, Davies AN, Westhoff M, Litterst P, et al.(2010) One-year time series of investigations of analytes within human breath using ion mobility spectrometry. Int J Ion Mobil Spectrom13: 141–148.
18. Bo¨deker B, Davies AN, Maddula S, Baumbach JI (2010) Biomarker validation-room air variation during human breath investigations. Int J Ion Mobil Spectrom.13: 177–184.
19. Maddula S, Blank L, Schmid A, Baumbach JI(2009) Detection of volatile metabolites ofEscherichia coli by multi capillary column coupled ion mobility spectrometry. Anal Bioanal Chem 394: 791–800.
20. Fink T, Baumbach JI, Kreuer S(2014) Ion mobility spectrometry in breath research J Breath Res 8: 027104.
21. Kreuer S, Hauschild A, Fink T, Baumbach JI, Maddula S, et al.(2014) Two different approaches for pharmacokinetic modeling of exhaled drug concentrations. Sci Rep 4: 5423.
22. Bo¨deker B, Baumbach JI(2009) Analytical Description of IMS-Signals. Int J Ion Mobil Spectrom 12: 103–108.
23. Bo¨deker B, Vautz W, Baumbach JI(2008) Peak Finding and Referencing in MCC/IMS-Data. Int J Ion Mobil Spectrom 11: 83–88.
24. Bo¨deker B, Vautz W, Baumbach JI(2008) Peak Comparison in MCC/IMS-Data-Searching for potential biomarkers in human breath data. Int J Ion Mobil Spectrom 11: 89–93.
25. Bo¨deker B, Vautz W, Baumbach JI(2008) Visualisation of MCC/IMS-Data. Int J Ion Mobil Spectrom 11: 77–81.
26. Bader S, Urfer W, Baumbach JI (2007) Reduction of ion mobility spectrometry data by clustering characteristic peak structures. J Chemom 20: 128–135.
28. Schneider T, Hauschild AC, Baumbach JI, Baumbach J(2013) An integrative clinical database and diagnostics platform for biomarker identification and analysis in ion mobility spectra of human exhaled air. J Integr Bioinform 10: 218.
29. Hauschild AC, Kopczynski D, D’Addario M, Baumbach JI, Rahmann S, et al.(2013) Peak Detection Method Evaluation for Ion Mobility Spectrometry by Using Machine Learning Approaches. Metabolites 3: 277–293.
30. Hauschild AC, Schneider T, Pauling J, Rupp K, Jang M, et al.(2012) Computational Methods for Metabolomic Data Analysis of Ion Mobility Spectrometry Data-Reviewing the State of the Art. Metabolites 2: 733–755.
31. Hauschild AC, Baumbach JI, Baumbach JI (2012) Integrated statistical learning of metabolic ion mobility spectrometry profiles for pulmonary disease identification. Genet Mol Res 11: 2733–2744.
32. Westhoff M, Litterst P, Maddula S, Bo¨deker B, Baumbach JI et al. (2011) Statistical and bioinformatical methods to differentiate chronic obstructive pulmonary disease (COPD) including lung cancer from healthy control by breath analysis using ion mobility spectrometr. Int J Ion Mobil Spectrom 11: 139–149.
33. Baumbach JI, Maddula S, Sommerwerck U, Besa V, Kurth I, et al.(2011) Significant different volatile biomarker during bronchoscopic ion mobility spectrometry investigation of patients suffering lung carcinoma. Int J Ion Mobil Spectrom 14: 159–166.
34. Maddula S, Rupp K, Baumbach JI(2012) Recommendation for an upgrade to the standard format in order to cross-link the GC/MSD and the MCC/IMS data. Int J Ion Mobil Spectrom 15: 79–81.
35. Mazzone PJ (2010) Exhaled volatile organic compounds as biomarkers for respiratory diseases. European respiratory monograph 49: 130–139.
36. Darwiche K, Baumbach I.J, Sommerwerck U, Teschler H, Freitag L (2011) Bronchoscopically Obtained Volatile Biomarkers in Lung Cancer. Lung 189: 445–52.
37. Baumbach IJ, Maddula S, Sommerwerck U, Besa V, Kurth I, et al.(2011) Significant different volatile biomarker during bronchoscopic ion mobility spectrometry investigation of patients suffering lung carcinoma. Int J Ion Mobil Spectrom 14: 159–166.
38. Broe¨t P, Dalmasso C, Tan EH, Alifano M, Zhang S, et al.(2011) Genomic profiles specific to patient ethnicity in lung adenocarcinoma. Clin Cancer Res 17: 3542–3550.
39. Saijo N, Fukuoka M, Thongprasert S, Ichinose Y, Mitsudomi T, et al.(2010) Lung cancer working group report. Jpn J Clin Oncol 4: i7–12.
40. Mitsudomi T, Yatabe Y(2007) Mutations of the epidermal growth factor receptor gene and related genes as determinants of epidermal growth factor receptor tyrosine kinase inhibitors sensitivity in lung cancer. Cancer Sci 98: 1817–1824.
41. Pao W, Hutchinson KE(2012) Chipping away at the lung cancer genome. Nat Med 18: 349–351.
42. Pao W, Girard N(2011) New driver mutations in non-small-cell lung cancer. Lancet Oncol 12: 175–180.
43. Nana-Sinkam SP, Powell CA(2013) Molecular biology of lung cancer: Diagnosis and management of lung cancer, 3rd ed: American College of Chest Physicians evidence-based clinical practice guidelines. Chest 143: e30S–39S.
44. Paradiso A, Tommasi S, Pinto R, Carpagnano GE, Foschino-Barbaro MP(2008) Exhaled breath condensate is not suitable to detect EGFR somatic mutations. Eur Respir J 32: 1126–1127.