ISSN 1549-3644
© 2009 Science Publications
Corresponding Author: Zuhaimy Ismail, Department of Mathematics, Faculty of Science, University Technology Malaysia, 81310 UTM Skudai, Johor, Malaysia Tel: +60197133940 Fax: +6075566162
Intervention Model for Analyzing the Impact of Terrorism to
Tourism Industry
1
Z. Ismail,
2Suhartono,
3A. Yahaya and
1R. Efendi
1
Department of Mathematics, Faculty of Science,
University Technology Malaysia, 81310 Skudai, Johor, Malaysia
2
Department of Statistics, Institute Technology of Sepuluh Nopember, Indonesia
3
Department of Foundation Education, Faculty of Education,
University Technology Malaysia, 81310 Skudai, Johor, Malaysia
Abstract: Problem statement: It is common in time series data with extreme change in its mean caused by an intervention which comes from external and/or internal factors. This extreme change in mean is known as regime change or structural change. Problems of external factor intervention such as the effect of the Arab oil embargo to consumption level of electricity in United States. The issue of interest here is on the impact of terrorist Bali’s bomb to tourism industry in Indonesia. Approach: A theoretical and empirical studies on the intervention model, particularly pulse function of intervention is carried out focusing on the differential statistics that can be used to determine the order of intervention model. A case study of the first Bali bomb that occurred on October 12th, 2002 is an intervention of external factor that has affected the occupancy level of five star hotels in Bali. Results: The results of this theoretical study were applied to construct a model procedure of intervention model. The empirical study showed that intervention model is used to describe and explain the quantity and the length of the first Bali bomb effect towards the occupancy level of five star hotels in Bali. It shows a decreasing trend in tourist arrival in Bali, Indonesia. Conclusion: This study was focused on the derivation of some effect shapes, i.e., temporary, gradually or permanent on the arrival of tourist into Bali. A new model building procedure with three main iterative steps for determining an intervention model was used for data with extreme change in mean. The results from this theoretical study will give an opportunity for further research related to time series model that contains regime change, caused by intervention of pulse function and/or step function.
Key words: Intervention model, pulse function, extreme values, time series and tourism
INTRODUCTION
A homogeneous non stationary time series can be reduced to a stationary time series by taking a proper degree of differencing and the Autoregressive Integrated Moving Average (ARIMA) model is one such model useful in describing various non stationary time series. ARIMA is a popular time series model and has many applications[1].
Extreme change in mean of a time series data is known as regime change or structural change[2]. This condition is usually caused by an intervention which comes from external and/or internal factors. The example of external factor intervention can be found in Montgomery and Weatherby[3] who analyzed the effect of Arabic oil embargo on the consumption level of electricity in United States and Enders et al.[4] studied
This study is explores the results of theoretical and empirical studies on intervention model, particularly the pulse function intervention. Firstly, the results of theoretical study are presented, namely the statistics derivation that is used to identify the order of intervention model. Then, based on this theoretical result, the new model building procedure is proposed. Finally, this procedure is applied to real data of monthly hotel room occupancy level in Bali, Indonesia from January 1994 until September 2005. In this case, the event of the first Bali’s bomb on October 12, 2002 is used as an external factor intervention. The impact of this intervention on the hotel room occupancy level will be evaluated by using intervention model. This event is the external factor influencing the tourist arrival into Bali and can be modeled using the proposed intervention model.
MATERIALS AND METHODS
Model: Intervention model is a model in time series which is used to explore the impact on the series from external factors which gives an estimate to the observed variables. Suppose that Yt is a time series process with an ARIMA (p,d,q)(P,D,Q)S model, then the model as in[3,6] is as follows :
s d S D S
p(B) P(B )(1 B) (1 B ) Yt q(B) Q(B )at
φ Φ − − = θ Θ (1)
or
S
q Q
t S d S D t
p P
(B) (B )
Y a
(B) (B )(1 B) (1 B )
θ Θ
=
φ Φ − − (2)
With:
2 p
p 1 2 p
S S 2S PS
p 1 2 P
q S
q 1 2 2 q Q
S 2S QS
1 2 Q
(B )
(1 B B B )
(B) (1 B B B )
(B ) (1 B B B )
(B) (1 B B B )Θ
= − Θ − Θ − − Θ
φ = − φ − φ − − φ Φ = − Φ − Φ − − Φ θ = − θ − θ − − θ
… …
…
…
B is backward operator with:
k t t k
B Y =Y−
If it is defined as:
S
q Q
t S d S D t
p P
(B) (B )
n a
(B) (B )(1 B) (1 B )
θ Θ
=
φ Φ − −
Then Eq. 2 can be written as Yt = nt. From Eq. 2, for d = 0 and D = 0, it may be interpreted as a
difference on Yt and at as the shock or a noise. If it is assumed all the effect of intervention in a time series, so the time series process can be written as:
t t t
Y =f (X )+n (3)
Which:
Yt = A response variable at time t Xt = An intervention variable and
nt = A noise model from the ARIMA (p, d, q)(P,D,Q)S model
In general, there are two types of functions in the intervention variable. The first function is the step function and the second is the pulse function. The step function in the intervention variable lies in a given set of time. It is normally established for a long period of time such as the number of emergency call recorded[10]. The intervention type of step function started from a given time until it expires. Mathematically, the intervention type of step function is written as:
t
0, t T X
1, t T
< =
≥
(4)
with T is time of intervention first occur.
The pulse function is the intervention type on a certain period of time, such as the Telecom two billion sales promotions and WTC’s bomb occurred which occurred in 2003. Mathematically, the intervention type of pulse function is usually written as:
t
0, t T X
1, t T
≠ =
=
(5)
with T is time of intervention first occur.
In this study, the theoretical and empirical studies are focused only on the intervention type of pulse function. While theoretical from intervention type of step function explain in[3,5].
Intervention model of null order pulse function: Let the Intervention Type Null Order Pulse Function be:
t t t
Y = ω X +n (6)
With:
Yt = Response variable at t ω = Intervention effect at Y
Xt = Intervention variable which defined in Eq. 5 nt = “Noise” model (follow to ARIMA in previous
In Eq. 6, the effect of X on Y is assumed to have an intervention element. The estimated value of ω can be used to estimate the difference between interventions processes occurred and no intervention occurred. In general, the effect of X on Y varies categorized as temporary, gradual, permanent or after delay in certain time. In the next section, the intervention model of the first order pulse function is discussed.
Intervention model of first order pulse function: The assumption of the effect intervention occurred if only if there is an intervention as indicated in Eq. 6 (and no impact on next times) which often cannot be handled out. An alternative approach which accommodates another sort of effect is gradual from an intervention occurred. Intervention model which described above is denoted as first order intervention model. With assume that model like the Eq. 3, which is written as follow:
*
t t t
Y =Y −n (7)
Further, an additional parameter is needed to define f (Xt) as follow:
*
t t t
Y f (X ) X
1 B
ω
≡ =
− δ (8)
such that:
–1 < δ <1orδ <1
After simplifying, the Eq. 8 can be written as:
* *
t t 1 t
Y = δY− + ωX (9)
Since * *
t 1 t 2 t 1
Y− = δY− + ωX− and δ <1, we can substitute it into Eq. 9 and the equation becomes:
* j
t t j
j 0
Y X
∞
− =
= ω δ
∑
(10)If Eq. 10 is applied, that is weather observations which has intervention, Xt≠T = 0, or not, Xt=T = 1, generally for k (k = 0, 1, 2 …) period after intervention, the equation below can be obtained:
* 2
T k T k T k 1 T k 2
k k 1
T k k T k (k 1) k
k
Y (X X X
X X )
(0 0 0 0 1 0 0 )
+ + + − + −
+
+ − + − +
= ω + δ + δ +
+ δ + δ +
= ω + + + + + δ + + + = ωδ
…
…
… …
(11)
(a)
(b)
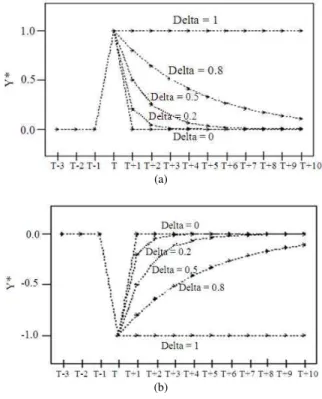
Fig. 1: Intervention response with single pulse occurred in t = T
Equation 10 means that the effect from pulse vanished gradually corresponding to geometry sequence which determined by δ value. Figure 1 shows
* t
Y value for model with value ω = 1, Fig. 1a and b for value ω = -1 and single pulse occurred in t = T for some variety δ (delta) value for δ <1 and δ ≠ 0, δ to determine the effect of X to Y which the shock close to asymptote limit. It can be simply written as follow:
* k 0
T k k
Y lim =
+ → ∞= →∞ωδ (12)
Based on Fig. 1, it can be seen that δ <1 and δ ≠ 0,
* t
Y value will approach asymptote 0 value. In this case, as δ approaches to 0, then the effect of X to Y will lose faster. On the other hand, as δ approaches to 1, the effect of X will lose longer. For specific case, that is δ = 1, we can get the permanent effect of X to Y which is shown in Fig. 1. In general, this pulse function of intervention model can be written like the transfer function model that is[10]:
* s b
t t t
r
(B)
Y f (X ) B X
(B)
ω
≡ =
With:
2 s
s(B) ( 0 1B 2B sB )
ω = ω − ω − ω − − ω⋯
2 r
r(B) (1 1B 2B rB )
δ = − δ − δ − − δ⋯
b = Time delay starting from the intervention effect of X to Y
Figure 2 shows several examples of simulation data from an intervention model with theoretical framework from the intervention response occurred, *
t
Y , with single pulse is occurred at T = 51.
Procedures for intervention model: The intervention response which is written as *
t
Y in essence are values errors, that is differences between original data and ARIMA model forecast which is given from the previous data before the intervention occurred. It have a different case with determined of ARIMA order model which based on the Autocorrelation Function variety (ACF) and the autocorrelation partial function (PACF), or the determination order of b, s and r in transfer function through on identification of the Cross Correlation Function forms (CCF).
(a)
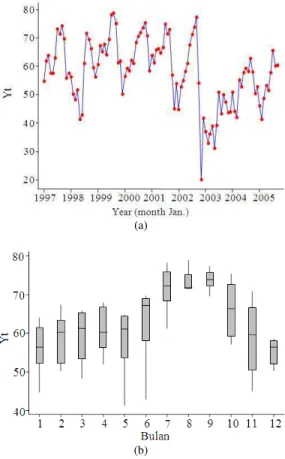
(b)
Fig. 2: Hotel occupancy level performances in Bali
The procedure may be described as follows: The time series data Yt are divided into Data I- data time series period before the intervention occurred, Y1t and Data II-data time series period after the intervention occurred, Y2t:
Phase 1: The forming of ARIMA model for data time series period before intervention, Y1t.
Phase 2: The Computational of the intervention response values or found residual Yt for entire time series data. Identify order of b, s, r from the intervention model based on plot form *
t
Y .
Phase 3: The parameter estimated of intervention model and hypothesis test parameter model validity. Diagnose check model suitability through residual assumption test that is white noise test and Normal distribution.
Application of intervention model: In this study, we consider a real data of five star hotels occupancy in Bali from January 1997 until September 2005. Figure 3a shows the pattern of hotel occupancy which is relatively stable since 1997 period until an extreme decrease in occupancy immediately after the first Bali bomb. The special Box-plot diagram before intervention occurred is given in Fig. 3.
Figure 3 and 4 both show the same pattern when the intervention was for first and second Bali bomb respectively.
Transforming data for ARIMA model before intervention: Using the ACF and PACF identification from stationery data through on non seasonal and seasonal differencing, we obtained two estimates for ARIMA model which is the ARIMA(0,1,0)(0,1,1)12 and ARIMA(0,1,1)(0,1,1)12 respectively. The result of parametric estimate and the diagnose check shows that ARIMA(0,1,1)(0,1,1)12 model which appropriate with Y1t, because it has a smaller means square error or MSE. MINITAB output of the parametric estimation and the diagnose check for it can be seen in Table 1. Table 1: MINITAB output of the parametric estimation and the
diagnose check an ARIMA (0, 1, 1) (0, 1, 1)12 model on Y1t
data
Final estimates of parameters
---
Type Coef SE Coef T P
MA1 0.3283 0.1267 2.590 0.012
SMA12 0.7894 0.1651 4.780 0.000
Differencing: 1 regular, 1 seasonal of order 12
Number of observations: Original series 69, after differencing 56 Residuals: SS = 1663.84 (backforecasts excluded) MS = 30.81 DF = 54
Modified box-pierce (Ljung-box) chi-square statistic:
Lag 12.000 24.000 36.000 48.000
Chi-square 8.900 14.400 26.6 00 50.100
DF 10.000 22.000 34 .000 46.000
Fig. 3: Plot of actual value, forecasted and residual of data
Fig. 4: The intervention response type
RESULTS
As explained above the forming of intervention model. Firstly, we will do the computational to obtain the predictable value for all data, whether for data before (data I, Y1t) or after (data II, Y2t) intervention through ARIMA model which is obtained from last phase, that is ARIMA(0,1,1)(0,1,1)12. The result of forecast and residual as a description of complete intervention response can be seen in Fig. 4.
Figure 4a and b show that the intervention of the first Bali’s bomb has directly affected to reduction in the hotel occupancy levels. Fixing b = 0 as an order of estimation from intervention model which means that the effect directly occurred on same time with intervention occur corresponding to event in November 2002. It only returns to normal after seven month after the intervention. In this case we set s = 2 and r = 1 and found that the gradual decreasing approaches to non-zero value started between 7-10 months after intervention. This condition also occurs when the estimated vales of b, s and r order are set at b = 7 or 10, with s = 0 and r = 1.
Table 2: SAS output for parametric estimation in model I Conditional least squares estimation
---
Standard Approx
--- --- Par. Estimate Error t-value Pr>|t| Lag Var. Shift MA1,1 0.29922 0.11101 2.70 0.0086 1 Yt 0 MA2,1 0.52160 0.10350 5.04 <.0001 12 Yt 0 NUM1 -15.66649 5.49390 -2.85 0.0056 0 Pt 0 NUM1,1 26.93222 5.60680 4.80 <.0001 1 Pt 0 NUM1,2 -19.75962 5.71840 -3.46 0.0009 2 Pt 0 DEN1,1 0.99622 0.05397 18.46 <.0001 1 Pt 0 NUM2 -8.73648 5.10589 -1.71 0.0911 0 Pt 7 DEN1,1 0.75165 0.40471 1.86 0.0671 1 Pt 7
Completely, two estimate order intervention model which appropriate for these case is written as below: Model 1:
2 7
* 0 1 2 3
t t
1 2
B B B
Y X
1 B 1 B
ω − ω − ω ω
= +
− δ − δ
(14)
Model 2:
2 10
* 0 1 2 3
t t
1 2
B B B
Y X
1 B 1 B
ω − ω − ω ω
= +
− δ − δ
(15)
Estimations of parameters and diagnose check intervention model estimate suitability: Estimations of parameters phase in two estimates intervention model like Eq. 14 and 15 is done with implemented of ARIMA procedure or PROC ARIMA which is available on SAS statistic package. A complete output model 1 can be seen in Table 2. Mathematically, model I can be written as follow:
2 7
*
t t
15,67 26,93B 19,76B 8,74B
Y X
1 0,996B 1 0,752B
− − + −
= +
− −
(16)
One of the interesting results is estimate value from δ which relatively approaches to 1, that is 0,996. The testing used interval estimation with 95% confidence intervals shows that this parameter estimation value equals to 1 where indicated that effect is not back to original value permanently, or permanent intervention response is not 0.
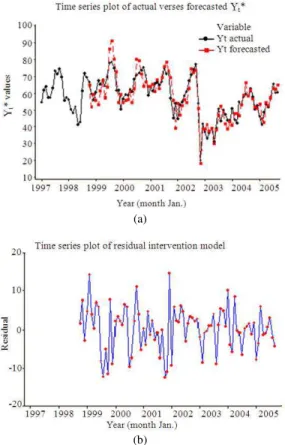
Figure 5 shows the predictable result and residual values from the hotel occupancy levels using the intervention model approach. The graph shows extreme changes in the data due to the first Bali bomb intervention.
(a)
(b)
Fig. 5: The Actual and forecast data plot from intervention model and residual plot values
DISCUSSION
Intervention model and reconstruction of intervention response type: The best of intervention model for the first Bali bomb for hotel occupancy in Bali can be written as:
2 7
*
t t
15,67 26,93B 19,76B 8,74B
Y X
1 0,996B 1 0,752B
− − + −
= +
− −
Interpretation from this model is done firstly completed predictable value of δ1 to become 1, like previous argument. Thus, intervention model is written as below:
2 7
*
t t
15,67 26,93B 19,76B 8,74B
Y X
1 B 1 0,752B
− − + −
= +
− −
(18)
Intervention model in the Eq. 15 shows that pulse function intervention of the first Bali bomb that occurred in October 12, 2002 directly effected hotel occupancy levels. This decreased effect continues on fluctuate which finally on gradual approaches to permanent effect until last observation, which is until
September 2005. The math algebras of intervention effect for T, T+1, T+2 periods, can be written as: Time period into T (October 2002):
2 7
*
T T
15,67 26,93B 19, 76B 8,74B
Y X
1 B 1 0,752B
− − + −
= +
− −
* *
T T 1 T T 1
T 2 T 7
Y Y 15,67X 26,93X
8,74(1 B)
19,76X X
1 0,752B
− −
− −
⇔ = − −
−
+ −
−
(19)
In generally, intervention effect in time period T+7+k is:
* *
T 7 k T 7 k 1 T k
T k 1 l 1
T k l)
* * k 1
T 7 k T 7 k 1
Y Y 8,74X
8,74(0,752 1)X
(8,74 0,752 )(0,752 1)X
Y Y [(8,74 0, 752 )(0, 248)]
+ + + + − +
+ − −
+ − − + + + + −
= −
− − −
− × − −
⇔ = + ×
…
…
(20)
Thus, in long-time period effect is:
* * k 1
T 7 k T 7 k 1
k k
lim Y→∞ + + =lim Y→∞ + + − +[(8,74 0,752× −)(0, 248)= −22,84
The quantity of intervention effect algebras in the Eq. 19 until 20 shows that two difference main periods of the first Bali bomb to occupancy level of five star hotels. The explanations of intervention effect in two main periods are:
Thus, in long-time period effect is:
* * k 1
T 7 k T 7 k 1
k k
lim Y lim Y [(8,74 0,752 )(0, 248)
22,84
−
+ + + + −
→∞ = →∞ + ×
= −
The quantity of intervention effect algebras in the Eq. 19 until 20 shows that two difference main periods of the first Bali bomb to occupancy level of five star hotels. The explanations of intervention effect in two main periods are:
For time period T, T+1,…,T+6 (October 2002 until April 2003): For the first period there are three types of effect which have been occurred on data:
• First effect is about 15, 67% decreased in October 2002 or exactly in same month that first Bali bomb tragedy occurred
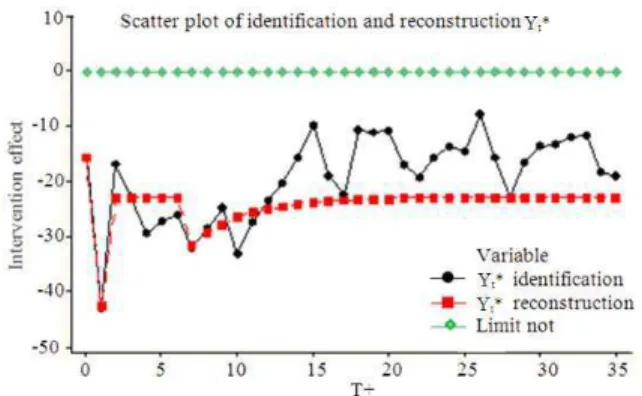
Fig. 6: The comparison between identification and reconstructs of intervention model
• Third effect is permanent which started from December 2002 period until April 2003, that is decreasing occurred about 22, 64% on occupancy level of five star hotels. This case mean that the second month after the first Bali bomb happen or in December 2002 period has an raising about 19, 76 if it is compared with last November
For time period into T+7, T+8,…,T+35 (May 2003 until September 2005): For the second period, there is additional decrement about 8.74% in May 2003, or seven month after the first Bali bomb intervention. So that, the total decreases in the seventh month is 31.58%. It then gradually increases to normal. From Fig. 6 it shows that two of intervention effects, whether the results of the identification stage and reconstruction, shows that intervention effect of the first Bali bomb is permanent until September 2005.
CONCLUSION
In this study, the time series of five stars hotel occupancy in Bali, Indonesia are used to determine the effect of the Bali’s bombing on tourism industry. The theoretical and empirical studies on the intervention model were carried out to determine the order of intervention model. This model includes the derivation of some effect shapes categorized as temporary, gradually or permanent effect. Our studies proposed a new model building procedure containing three main iterative steps for determining an intervention model. Using data of hotel occupancies, the proposed intervention model is as follows:
2 7
*
t t
15,67 26,93B 19,76B 8,74B
Y X
1 B 1 0,752B
− − + −
= +
− −
In general, the results from this theoretical study give an opportunity for further research related to time series model that contains regime change, caused by intervention of pulse function and/or step function. Further study may also include comparative study using their time series models.
ACKNOWLEDGEMENT
This research was supported by the Ministry of Science, Technology and Innovation, Malaysia (MOSTI) under IRPA Grant Vot No. 79086 and the Department of Mathematics, Faculty of Science, University Technology Malaysia. We would also like to thank the Statistics Department, Institute Technology of Sepuluh Nopember, Indonesia and Suhartono for his contribution in this project. These supports are gratefully acknowledged.
REFERENCES
1. Ismail, Z. and F. Jamaluddin, 2008. Time series regression model for forecasting malaysian electricity load demand. Asian J. Math. Stat., 1: 139-149 DOI: 10.3923/ajms.2008.139.149 2. Enders, W., 1995. Applied Econometric Time
Series. Wiley, New York, ISBN:
0471039411, pp: 433.
3. Montgomery, D.C. and G. Weatherby, 1980. Modeling and forecasting time series using transfer function and intervention methods. IIE Trans., 12: 289-307.
http://www.informaworld.com/smpp/ftinterface?co ntent=a780430908&rt=0&format=pdf
4. Enders, W., T. Sandler and J. Cauley, 1990. Assessing the impact of terrorist thwarting policies: An intervention time series approach. Defence
Peace Econ., 2: 1-18.
http://www.informaworld.com/smpp/ftinterface?co ntent=a783129014&rt=0&format=pdf
5. McSweeny, A.J., 1978. The effect of response cost on the behavior of a million persons: Charging for directory assistance in Cincinnati. J. Applied
Behav. Anal., 11: 47-51.
http://www.pubmedcentral.nih.gov/articlerender.fc gi?artid=1311267
6. Leonard, M., 2001. Promotional analysis and forecasting for demand planning: A practical time series approach. SAS Institute Inc., Cary, NC., USA.
7. Adriana, P., J.R. Dennis, B. Rodriguez, A.Y. Castro and V. Delgado et al., 2003. An interrupted time series analysis of parenteral antibiotic use in Colombia. J. Clin. Epidemiol., 56: 1013-1020. DOI: 10.1016/S0895-4356(03)00163-X
8. Michael, F.J. and T.J. Miller, 2004. Impact of a change in reporting systems in the maryland blue crab fishery. Fish. Res., 68: 37-43. http://cat.inist.fr/?aModele=afficheN&cpsidt=1583 8552
9. Goh, B.H., 2005. The dynamic effects of the Asian financial crisis on construction demand and tender price levels in Singapore. Build. Environ., 40: 267-276. DOI: 10.1016/j.buildenv.2004.07.012
10. Pitfield, D.E., 2007. The impact on traffic, market shares and concentration of airline alliances on selected European-US routes. J. Air Transport
Manage., 13: 192-202. DOI:
10.1016/j.jairtraman.2007.03.002