Vegetative growth and fruit set of olive (Olea europaea
L. cv. ‘Zard’) in response to some soil and plant
factors
Omid NOORI1*, Kazem ARZANI2, Aziz MOAMENI3 and Mehdi TAHERI4
1
Department of Agroecology, Shahid Beheshti University (GC), Tehran, Iran, [email protected]*correspondence
2
Department of Horticultural Science, Tarbiat Modares University (TMU), PO. Box 14115-336 Tehran, Iran.
3
Soil and Water Research Institute, Karaj, Iran.
4
Soil and Water Research Department, Agricultural andNatural Resources Research Center of Zanjan, PO. Box 45195-1474, Zanjan, Iran.
Abstract
This experiment was conducted to explore the reasons of difference between ‘Zard’ olive orchard with the poor vegetative growth rate and fruit set and orchard with suitable vegetative growth rate and fruit set in relation to some soil and plant factors during two seasons. Note that assumptions were based on the overall canopy greenness of the olive trees, so experimental orchards in which the planted trees showed optimum leaf greenness were considered good situations for optimum vegetative growth and
productivity. Remote sensing technologies based on normalized difference vegetation index (NDVI) were employed on olive orchards, and two orchards meeting the criteria of highest amount of greenness and lowest amount of greenness were selected. Length of current-year shoot (LCYS) and fruit set were considered indicators of tree vegetative growth and productivity, respectively. Results clearly indicated a significant difference between the two selected orchards in terms of canopy volume (CV), leaf nitrogen content (N), leaf potassium content (K), silt, sand, Sodium adsorption rate (SAR), available phosphorous (Pavi), total neutralizing value (TNV), electrical conductivity (EC),
chloride (Cl), and Fe variables. A stepwise regression method was used to evaluate the effects of soil and plant variables on fruit set and LCYS. According to the obtained results, the main reasons for differences between two orchards in fruit set and
vegetative growth was N and K deficiencies, soil salinity, and a high percentage of silt in the soil.
Keywords: Fruit Set, Nitrogen, Olea europaea L., Potassium, Remote Sensing, Salinity
Introduction
determine vegetation cover in olive groves using aerial images taken at diverse times of the year and using several vegetation indexes. Gomez-Casero et al. (2007) assessed nitrogen and potassium deficiencies in olive orchards through discriminant analysis of hyperspectral data.
The Normalized Difference Vegetation Index (NDVI) is an equation of contrasting reflectance between the red and near-infrared regions of a surface spectrum (Rouse et al., 1974). This equation is a readily usable quantity that can be related to the green vegetation cover or vegetation abundance and is expressed by: NDVI = (RNIR −
RRED)*(RNIR + RRED)-1, where RNIR is the near-infrared (NIR) reflectance and RRED is the red reflectance. NDVI is related to the photosynthetic activity of green vegetation. A high NDVI indicates a strong level of photosynthetic activity (Rouse et al., 1974).
Plant growth and fruit production are all expected to be influenced by levels of available nutrients and soil properties.
Flowering and fruit set are the main processes influencing the productivity of fruit trees and are especially important for the olive, in which there is a clearly accurate
relationship between vegetative and reproductive growth (Lavee, 2006). At full bloom, some 500,000 flowers are present on a mature olive tree. Commercial yield is achieved if 1% or 2% of those flowers remain as developing fruit (Martin et al., 2005).
Macronutrient mineral status influences the productive stages of olive growth, including flowering and fruit set, directly or indirectly, through its effects on other physiological processes (Fabbri and Benelli, 2000). Indeed, most studies have indicated a positive response of olive productivity to increased mineral status (Ben Rouina et al., 2002). It has been reported that olive leaves and stems represent storage organs for Nitrogen (N) and release it in response to the metabolic demands of developing reproductive and vegetative organs (Fernandez-Escobar et al., 2004). In addition, fruit set, yield, and shoot growth are negatively influenced by N deficiency (Freeman et al., 2005). In Italy, it was also reported that N fertilization increased fruit set in olive trees (Cimato et al., 1990). Nitrogen was found to increase the proportion of hermaphrodite flowers, and N concentration of less than 1 % in the leaves led to the formation of staminate flowers, thereby decreasing fruit set formation potential. Moreover, N deficiency reduces the number of flowers (Therios, 2006). A correlation between a reduction in leaf N and a reduced number of flowers per inflorescence was also reported by Chatzissavvidis et al. (2004).
Potassium (K) fertilization is essential for olive orchards, particularly because more than 60% of the plant’s K is located in the fruit and is removed annually with its harvest. An application of a large quantity of fertilizer containing K on soil was shown to be
responsible for major yield increases in olive orchards that had previously been seriously K deficient (Lopez Villalta, 1996).
It is generally well established that saline conditions limit the vegetative and reproductive development of olives mainly as a result of interference with the osmotic balance in the root system zone and detrimental effects caused by specific toxic accumulation of chloride and sodium ions in the leaves (Bongi and Loreto, 1989; Tattini, 1994).
can be as high as 6–8 dS/m in soil with a high calcium status. All data published on olives shows that plant growth, (i.e. shoot length, total leaf area, dry weight, root length, and rooting ability) is inhibited by moderate and high levels of salinity (Bartolini et al., 1991; Tattini et al., 1995; Marin et al., 1995; Chartzoulakis et al., 2002, 2005).
Furthermore, salinity reduces the number of perfect flowers per inflorescence and the viability and germinability of the pollen and fruit set in olive trees (Cresti et al., 1994).
The objective of this study was to explore the reasons of difference between the ‘Zard’ olive orchard with the poor vegetative growth rate and fruit set and the olive orchard with optimum vegetative growth and fruit set in relation to some soil and plant factors.
Materials and Methods
Experimental Site and Orchard Management
This research was carried out in two irrigated olive (Olea europaea L.) orchards of cv. ‘Zard’ (7 m×7 m, 204 tree ha-1, 14 years old) located in the Tarom region of Zanjan Province, Iran (between 48° 56′ and 50° 5′ E; and 36° 47′ and 37° 36′ N) during two seasons: 2010/2011 and 2011/2012. The long-term mean annual minimum and
maximum temperatures are 11.2 °C and 23.2 °C, respectively. Mean relative humidity is 62%, and mean annual rainfall is 258 mm for a 30 years period.
The cultural practices were the standard for commercial orchards in the region. ‘Zard’ trees were irrigated by dripping system.
Remote sensing processing
Note that assumptions were based on overall olive plant canopy greenness, so
experimental orchards in which the planted trees showed optimum leaf greenness were considered good situations for optimum growth and productivity. Remote sensing
technologies were employed on the olive orchards to determine which orchard had the highest amount of canopy greenness and which had the lowest amount of canopy
greenness. ALOS-AVINIR-2 image was used in this experiment. Six olive orchards (A-F) existing in a compacted parcel of olive orchards based on NDVI were graded. Image classification was carried out using ENVI software. Based on satellite image
classification, the two olive orchards with the highest and lowest amounts of leaf greenness were selected for study. The first one was characterized by optimal
vegetative growth and higher productivity than the second orchard which had a lower vegetative growth rate resulting in low fruit production.
Field measurements and sampling
Data was taken from 5 sites in the first orchard and 8 sites in the second orchard. A total of 117 sampling points were identified in 13 sites. A 98 m×98 m grid pattern was
established, and each intersection point (node) represented a sampling point. The position of each node was geo-referenced usinga commercial GPS (Garmin Oregon 300, 2 m resolution).
considered tree productivity potential. Canopy volume (CV) was also measured and considered an important factor.
Measurements of current-year shoot length were taken on four samples per tree and reported in cm. The trunk diameter, d (cm), was recorded at 10 cm above soil surface and converted to TCSA using the following equation: Trunk cross-section in cm2 = 3.1416* (d*2-1)2.
The mean canopy diameter D (m) = (D1 + D2)*2-1, with D1 and D2 being diameters taken
intra-row and inter–row, were determined using the following equation (Khabou et al., 2009): Canopy volume in m3 = 0.5236* H*(D)2.
Flowers on four individual shoots per tree were counted during the flowering period and the shoots were tagged. These shoots, containing hermaphrodite and staminate flowers, were used to measure fruit set on 20 May 2011 and 2012. Results are presented as the percentage of flowers resulting in viable fruit.
Leaf and soil analysis
To determine the physical and chemical properties of the soil, 117 soil samples on March 2010, 2011 and 2012 were collected from 13 parts (9 samples in each part). Leaves (117 samples) were sampled on 2 May 2010, 2011 and 2012. Fifty to 100 of the matured leaves from the previous year’s growth were collected from the middle portion of nonbearing shoots. Sampled leaves were rinsed for 15 s in deionized water, the samples were then dried in oven at 60 °C, and ground in a stainless steel coffee mill to a particle size of less than 0.5 mm. Total concentrations of N and K in the leaves were determined using HNO3-HClO4 acid mixture digestion (AOAC, 1990). Soil samples were
taken at 0 to 60 cm depth of the soil profile in mid-July 2011. Four 500 g soil cores were taken within a 2 m radius of each grid point, and one more was taken core right at the intersection point. These 5 samples were mixed thoroughly to provide a bulked sample and to ensure its representativeness. Soil samples were air-dried overnight and passed through a 2 mm sieve. Soil texture by the Hydrometer Bikes method, pH by the saturate of mod and pH meter, and soil organic matter using the Smith-Weldon method as described by Nelson and Sommers (1982) were determined. The Olsen method was used to determine available phosphorous concentration (P, ppm). Available K was
determined using a flame photometer after extraction by ammonium acetate (Pauwels et al., 1992). Soil EC (Electrical Conductivity) was measured in the soil extract of saturated soil. Lime content was determined as the total neutralizing value (TNV) by titration with NaOH. The TNV is the percentage of the limestone capable of neutralizing an acid and is expressed as calcium carbonate equivalent (CCE).
Statistical analysis
Data was analyzed statistically by SAS 9.1 (SAS INSTITUTE, 1992). The means of 117 raw data in 13 parts were used for statistical analyses. The mean of measured variables in the two selected orchards were compared using student’s t-test. The correlation matrix was calculated for all variables. In order to survey the effects of soil and plant variables on fruit set and LCYS, reduce the number of independent variables, and omit variables that have little effect on the dependent variable, the stepwise
Results
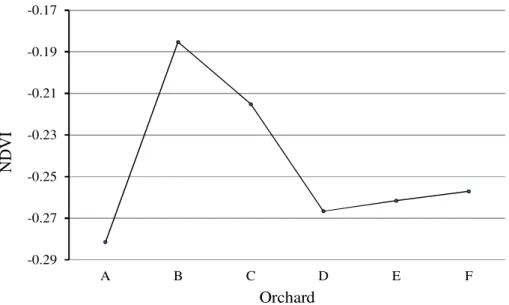
Results from the studied orchards showed that, NDVI was highest in orchard B and lowest in orchard A (-0.1853, -0.2815, respectively) (Figure 1). The first selected orchard (B) was characterized by optimal growth and had higher productivity than in orchard (A) which had a lower growth rate and low fruit production. Results of the t-test showed a highly significant difference between the two studied orchards in terms of fruit set, CV, LCYS, N, K, silt, sand, SAR, Pavi, Kavi, TNV, EC, Cl, and Fe variables. There were good,
significant correlations between fruit set and N, K, silt, sand, SAR, Pavi, TNV, EC, Cl, and
Fe variables. There were also good, significant correlations between LCYS and N, K, silt, sand, SAR, Pavi, EC, Cl, and Fe variables (data not shown). A highly positive
correlation between fruit set and LCYS with N (r= 0.852** and r= 0.823**, respectively) was observed. A highly positive correlation between fruit set and LCYS with K was also determined (r= 0.807** and r= 0.715**, respectively). A highly negative correlation
between fruit set and LCYS with silt was revealed (r= -0.939** and r= -0.902**). On the other hand, between LCYS with EC, a highly significant negative correlation was determined (r= -0.879**).
-0.29 -0.27 -0.25 -0.23 -0.21 -0.19 -0.17
A B C D E F
N
D
V
I
Orchard
Figure 1. The mean value of NDVI in studied olive orchards
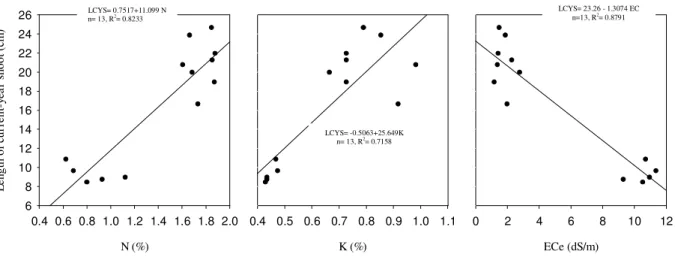
were considered independent variables. The fitted coefficient of the first model indicates that 94.6% of the fruit set variations are explained by the amount of N, silt, and K (Table 1). The fitted coefficient of the second model indicates that 88% of the LCYS variations are explained by the amounts of N, EC, and K (Table 2).
Table 1. Stepwise regression for fruit set as dependent variable and soil and plant variables as independent variable.
Step Independent Variable Standard Error F R2 Model
1 N (%) 0.443 63.58*** 0.852
2 Silt (%) 0.018 169*** 0.939
3 K (%) 1.098 17.22*** 0.946 Y= -2.02+2.243
(N)-0.229 (Silt)+4.557 (K) ***: p <0.001
Table 2. Stepwise regression for length of current-year shoot as dependent variable and soil and plant variables as independent variable.
Step Independent Variable Standard Error F R2 Model
1 N (%) 2.025 51.24*** 0.823
2 EC (dS m-1) 0.146 169*** 0.879
3 K (%) 5.018 5.08*** 0.883 Y= -1.844+7.645
(N)-1.307 (EC)+11.315 (K) ***: p <0.001
K (%)
0.4 0.5 0.6 0.7 0.8 0.9 1.0 1.1
Silt (%)
25 30 35 40 45 50
N (%)
0.4 0.6 0.8 1.0 1.2 1.4 1.6 1.8 2.0
F ru it S e t (% ) 0 1 2 3 4 5 6 7
Figure 2. Relationship between fruit set and N, K, Silt in the orchards
K (%)
0.4 0.5 0.6 0.7 0.8 0.9 1.0 1.1
ECe (dS/m)
0 2 4 6 8 10 12
N (%)
0.4 0.6 0.8 1.0 1.2 1.4 1.6 1.8 2.0
L e n g th o f cu rr e n t-y ea r sh o o t (c m ) 6 8 10 12 14 16 18 20 22 24 26
Figure 3. Relationship between length of current-year shoot (LCYS) and N, K, ECe in the
orchards
Discussion
Remote sensing clearly separated the orchards based on NDVI according to the criteria of overall olive tree canopy greenness (Ahadnejad Reveshty, 2005).
The lower fruit set levels found in low concentrations of N and K leaves were probably due to inadequate total quantities of nutrients available to the flowers as they developed into fruit (Rapoport and Rallo, 1991a, 1991b). Regression analysis of the relationships
Fruit Set= 12.472-0.2288 Silt
n= 13, R2= 0.9389
Fruit Set= -1.6275+8.7625 K n= 13, R2
= 0.8070 Fruit Set= -0.9745+3.6342 N
n= 13, R2= 0.8525
LCYS= -0.5063+25.649K n= 13, R2
= 0.7158
LCYS= 23.26 - 1.3074 EC n=13, R2
= 0.8791 LCYS= 0.7517+11.099 N
between the nutrient concentrations in leaves and the productivity variables were statistically significant.
In the present study, fruit set was increased by increasing the concentrations of N and K. This finding indicates that both N and K must therefore play a fundamental role in processes affecting tree productivity. Nitrogen deficiency in leaves is well established as a factor limiting fruit set in olive trees (Cimato et al., 1990; Freeman et al., 2005; Therios, 2006). Furthermore, correction of insufficient N has been found to reduce fruit
abscission throughout all developmental stages (Cimato et al., 1990; Inglese et al., 2002). Nitrogen is essential for protein biosynthesis, and the fact that developing
inflorescences have been shown to be strong sinks for N and water-soluble proteins that its availability is important for flowering (Bouranis et al., 1999). Furthermore, it has been suggested that polyamine plays an important regulatory role in olive flower induction (Prista and Voyiatzis, 2004). Correlations between high yields and high levels of leaf K in olive trees have been well documented (Freeman et al., 2005). Potassium, more than any other macroelement, is understood to have a positive effect on flowering (Fabbri and Benelli, 2000), as it promotes the formation of amino acids that stimulate the
formation of IAA oxidase which, in turn, stimulates flower induction (Gonzalez-Garcia et al., 1972). Potassium might also promote the production of pyruvate kinase (Mazuelos et al., 1983) and thereby influence the level of a number of amino acids involved in flowering induction.
Galvez et al. (2004) reported that as the percentages of silt and clay increase in the soil, the growth of the olive tree (shoot growth, canopy volume, and diameter) is reduced. They found a negative and significant correlation (r=- 0.797**) between the percentages of silt and clay in the soil and olive shoot growth.
Melgar et al. (2009) indicated that soil salinity did not cause changes in any of the
growth variables measured, including shoot length, whereas Aragues et al. (2005) found significant decreases in trunk diameter growth with increases in soil salinity.
Remote sensing technology clearly distinguished orchards with the highest amount of greenness from those with the lowest amount of greenness. The results of this study clearly demonstrate that fruit set was affected by N and K. Increasing N and K concentrations results in an increased fruit set. In addition to the results of this study regarding the important roles of N and K in fruit set, information concerning long-term tree growth as a function of nutrient status is needed for a more complete understanding of olive tree nutrition and proper horticultural management. Based on the current results, the main reasons for differences in fruit set and olive tree vegetative growth in orchards with low yield were deficiencies in concentrations of N and K as well as soil salinity and a high percentage of silt.
Acknowledgments
References
Ahadnejad Reveshty, M., (2005). Crop area estimation (Olive tree) using satellite images: A case study in Tarom region-Zanjan province Iran. In Mapasia conference, Jakarta-Indonesia.
AOAC, (1990). Official Methods of Analysis. 15th Ed. Washington, Association of Official Analytical Chemists.
Aragues, R., Puy, J., Royo, A., Espada, J.L., (2005). Three-year field response of young olive trees (Olea europaea L., cv. Arbequina) to soil salinity: Trunk growth and leaf ion accumulation. Plant Soil, 271, 265-273.
Bartolini, G., Mazuelos, C., Troncoso, A., (1991). Influence of Na2SO4 and NaCl salts on
survival, growth and mineral composition of young olive plants in inert sand culture. Advances in Horticultural Science, 5, 73–79.
Ben Rouina, A., Trigui, A., Boukhris, M., (2002). Effect of tree growth and nutrients status of “chemlali de sfax” olive trees and their productivity. Acta Horticulturae 586, 349–352.
Bernstein, L., (1965). Salt tolerance of fruit crops. USDA, Agric. Res. Agric. Int. Bull. 292.
Bongi, G., Loreto, F., (1989). Gas-exchange properties of salt-stressed olive (Olea europea L.) leaves. Plant Physiology, 90, 1408–1416.
Bouranis, D.L., Kitsaki, C.K., Cgorianopoulou, S.N., Alvalakis, G., Drossopoulos, J.B., (1999). Nutritional dynamics of olive trees flowers. Journal of Plant Nutrition, 22, 245–257.
Chartzoulakis, K., Loupassaki, M., Androulakis, I., (2002). Comparative study on NaCl salinity of six olive cultivars. Acta Horticulturae, 586 (1), 497–502.
Chartzoulakis, K.S. (2005). Salinity and olive: Growth, salt tolerance, photosynthesis and yield. Agricultural Water Management, 78, 108–121.
Chatzissavvidis, C.A., Therios, I.N., Antonopoulou, C., (2004). Seasonal variation of nutrient concentration in two olive (Olea europaea L.) cultivars irrigated with high boron water. Journal of Horticultural Science Biotechnology, 79, 683–688.
Cimato, A., Marrranci, M., Tattini, M., (1990). The use of foliar fertilization to modify sinks competition and to increase yield in olive (Olea europaea cv Frantoio). Acta Horticulturae 286, 175–178.
Cresti, M., Ciampolini, F., Tattini, M., Cimato, A., (1994). Effect of salinity on productivity and oil quality of olive (Olea europaea L.) plants. Advances in Horticultural Science, 8, 211–214.
Fabbri, A., Benelli, C., (2000). Flower bud induction and differentiation in olive. Journal of Horticultural Science Biotechnology, 75, 131–141.
Freeman, M., Uriu, K., Hartmann, H.T., (2005). Diagnosing and correcting nutrient problems, In: Olive production manual (Eds Sibbet, G.S., Ferguson, L.), pp. 83–92. University of California, Agriculture and Natural Resources, Oakland.
Galvez, M., Parra, M.A., Navarro, C., (2004). Relating tree vigour to the soil and
landscape characteristics of an olive orchard in a marly area of southern Spain. Scientia Horticulturae, 101, 291–303.
Gomez-Casero, T.M., Lopez-Granados, F., Pena-Barragan, J.M., Jurado-Exposito, M., Garcıa-Torres, L. (2007) Assessing Nitrogen and Potassium Deficiencies in Olive Orchards through Discriminant Analysis of Hyperspectral Data. Journal of the American Society for Horticultural Science, 132 (5), 611–618.
Gonzalez-Garcia, F., Chaves, M., Mazuelos, C., Troncoso, A., (1972). Physiological aspects of the nutrition of the olive tree, ‘Manzanillo’ table variety. Cycle of nutrients in leaves and in growth of reproduction organs. Physiology Biochemistry Horticulture Crops, 32, 614–634.
Inglese, P., Gullo, G., Pace, L.S. (2002). Fruit growth and olive quality in relation to foliar nutrition and time of application. Acta Horticulturae, 586, 507–509.
Khabou, W., Ben Amar, F., Rekik, H., Beghir, M., Touir, A., (2009). Performance evaluation in olive trees irrigated by treated wastewater. Desalination. 248, 8– 15.
Lavee, S., (2006). Biennial bearing in olive (Olea europaea L.). Olea, 25, 5–13. Lopezvillalta, L.C. (1996). World olive encyclopedia, Production techniques
(International Olive Oil Council, Madrid, Spain), pp 145–194.
Marin, L., Benlloch, M., Fernandez-Escobar, R., (1995). Screening for olive cultivars for salt tolerance. Scientia Horticulture, 64, 113–116.
Martin, G.C., Ferguson, L., Sibbet, G.S. (2005). Flowering, pollination, fruiting, alternate bearing and abscission, In: Olive production manual (Eds Sibbet, G.S.,
Ferguson, L.), p. 49–54. University of California Agriculture and Natural Resources, Oakland.
Mazuelos, C., Romero, R., Valpuesta, V., Sarmiento, R., Catalina, L. (1983). Pyruvate kinase activity levels of potassium and reduction sugars in vegetative and reproductive buds of Olea europea L. Anales de edafologia y agrobiologia, 42, 279–284.
Melgar, J.C., Mohamed, Y., Serrano, N., Garcia-Galavis, P.A., Navarro, C., Parra, Benlloch, M., Fernandez-Escobar, R., (2009). Long term response of olive tree to salinity. Agricultural Water Management, 96, 1105-1113.
Nelson, D., Sommers, L. (1982). Total carbon, organic carbon and organic matter. In: Methods of soil analysis, part 2, no. 9 2nd ed., (Eds. A. L. Page), pp. 539–580. Madison: ASA Publication.
Pena-Barragan, J.M., Jurado-Exposito, M., Lopez-Granados, F., Atenciano, S., Sanchez De La Orden, M., Garcia-Ferrer, A., Garcia-Torres, L., (2004). Assessing land-use in olive groves from aerial photographs. Agriculture, Ecosystems and Environment, 103, 117–122.
Prista, T.S., Voyiatzis, D.G., (2004). Seasonal changes in polyamine content of
vegetative and reproductive olive organs in relation to floral initiation, anthesis and fruit development. Australian Journal of Agricultural Research55, 1039– 1046.
Rapoport, H.F., Rallo, L., (1991a). Fruit set and enlargement in fertilized and unfertilized olive ovaries. HortScience, 26, 896–898.
Rapoport, H.F., Rallo, L., (1991b). Postanthesis flower and fruit abscission in
‘Manzanillo’ olive. Journal of the American Society for Horticultural Science, 116, 720–723.
Rouse, J.W., Haas, R.H., Schell, J.A., Deering, D.W., (1974). Monitoring the vernal advancement and retrogradation (green wave effect) of natural vegetation. In Progress Report RSC 1978-1; Remote Sensing Center, Texas A&M University: College Station, TX, USA.
SAS (2008). User's Guide. Ver. 9.1. SAS Institute Inc., Cary, NC, USA.
Tattini, M., (1994). Ionic relations of aeroponically grown olive plants during salt stress. Plant Soil, 161, 251–256.
Tattini, M., Gucci, R., Coradeschi, M.A., Ponzio, C., Everarard, J.D. (1995). Growth, gas exchange and ion content in Olea europaea plants during salinity and
subsequent relief. Physiol. Plantarum, 95, 203–210.