ABSTRACT: Prohexadione calcium (P-Ca) has been reported to effectively control shoot growth in several pear cultivars, but with
a few reports about its efficiency under the climatic conditions
of southern Brazil. Therefore, the objective of this study was to
evaluate vegetative growth, production, and fruit quality of ‘Smith’
pear trees in response to the use of different rates of P-Ca in the
climatic conditions of southern Brazil. The experiment was conducted
during the 2013/2014 and 2014/2015 seasons, in a 6-year-old ‘Smith’
pear orchard, trained to a central-leader system, with spacing
of 1.5 × 4.8 m, grafted onto Pyrus calleryana Decne. Different P-Ca rates were applied (100, 200, 300, and 400 mg·L–1) in different stages: first, in early spring for all treatments, and the others when
shoot growth resumed (GR), but only for some treatments. Variables
BASIC AREAS - Article
Prohexadione calcium reduces vegetative
growth and increases fruit set of ‘Smith’ pear
trees, in Southern Brazil
Bruno Carra1*, Daniel Spagnol1, Everton Sozo de Abreu1, Mateus da Silveira Pasa2,
Carina Pereira da Silva1, Cristiano Geremias Hellwig1, José Carlos Fachinello1
1. Universidade Federal de Pelotas - Faculdade de Agronomia Eliseu Maciel - Departamento de Fitotecnia - Pelotas (RS), Brazil. 2. Empresa de Pesquisa Agropecuária e Extensão Rural de Santa Catarina - Fitotecnia - São Joaquim (SC), Brazil.
*Corresponding author: [email protected]
Received: Jul.22, 2016 – Accepted: Oct. 3, 2016
for vegetative growth, yield components and fruit quality at harvest
and post-harvest were evaluated. The use of P-Ca was effective to
control vegetative growth in both seasons, at different rates. Yield
components were not affected by P-Ca applications in 2013/2014,
except return bloom and return yield. In 2014/2015 season, P-Ca
applications positively affected yield components, except average
fruit weight and return bloom. P-Ca applications did not alter the
qualitative attributes of the fruits of ‘Smith’ pear trees at harvest
and after a period of cold storage. These results implicate P-Ca
as a potential tool to manage vigor of ‘Smith’ pear trees in climatic
conditions of southern Brazil.
INTRODUCTION
The pear (Pyrus spp.) is the most imported fruit in Brazil, according to the FAO (2016). In 2013, the volume of imports was approximately 190,000 Mg, which corresponds to 90% of the consumption of the country. Thus, it is clear that the culture of pear is an important opportunity for Brazilian producers, however, some obstacles that prevent economically satisfactory productions must be solved.
The pear is one of the less productive temperate fruit trees in Brazil. Hawerroth et al. (2012) attribute the reduced cultivation of the pear to problems related to low productivity, like low fruit set and long juvenile period in the climatic conditions of the country. According to them, in southern Brazil, these conditions are characterized by high rainfall, high temperatures in the growing season, short wintry periods, and insufficient accumulation of chilling hours. This favors the higher vegetative growth, especially when vigorous rootstocks are used. In studies about fruiting habit and production of pear trees on different rootstocks, it was observed that formation of flower buds, production structures, and production efficiency are inversely proportional to the vigor induced by the rootstocks in most of the time (Pasa et al. 2011). Vegetative growth control is necessary to prevent excessive shoot growth within the canopy and shading, in order to provide higher interception of solar radiation and improving fruit quality (Rademacher 2004). Furthermore, excessive vegetative growth has a negative effect in the productivity (Pasa et al. 2011) and increased costs of pruning (Hawerroth et al. 2012). According to Rufato et al. (2012), the growth of pear and other fruits is influenced by the phenomena of competition for assimilates between the vegetative and fruiting parts. The branches, shoots, and leaves are stronger drains of assimilates during the initial phase of plant growth after a period of dormancy, which impair the entire reproductive part, as the formation of flowering buds and fruits. In order to have an economically satisfactory production and improved fruit quality, we must use management techniques that promote the proper balance between vegetative growth and fruiting (Sharma et al. 2009), especially in vigorous cultivars and rootstocks.
P-Ca is an inhibitor of gibberellin (GAs) synthesis with low toxicity and limited persistence, being metabolized
or decomposed 6 to 7 weeks after application (Evans et al. 1999; Rademacher 2004) and used to control the vegetative growth of different cultures. When applied during the early stages of vegetative growth, the P-Ca reduces the levels of GA1 (highly active), accumulating its precursor — the GA20 (inactive) — in plant tissues (Evans et al. 1999). Studies have shown the efficiency of P-Ca in the vegetative growth control of several cultivars of pear trees (Sugar et al. 2004; Asín et al. 2007; Hawerroth et al. 2012; Einhorn et al. 2014; Pasa and Einhorn 2014). Given the problems caused by excessive vegetative growth of pears, the development of strategies to overcome this problem, such as the use of P-Ca, is very important as an attempt to increase pear production in warm-winter regions like Brazil. The objective of this study was, therefore, to evaluate the influence of different P-Ca rates on vegetative growth, production, and fruit quality of ‘Smith’ pear, in the climatic conditions of southern Brazil.
MATERIAL AND METHODS
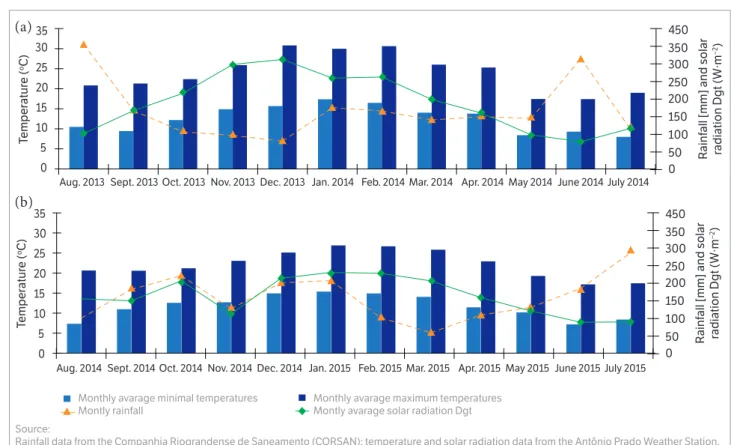
The experiment was performed in a commercial orchard in the city of Antônio Prado, RS, Brazil (lat 28°50′15″S, long 51°17′35″W Greenwich; altitude: 785 m) in the 2013/2014 and 2014/2015 seasons. According Köppen climate classification, the studied region has a Cfb climate, marine, with annual averages of rainfall, temperatures, and humidity of 1,736 mm, 17.2 °C, and 76%, respectively. It accumulates an average of 410 chill hours (CH) below 7.2 °C, during the winter, according to data provided by Bento Gonçalves Agro Climatic Station. The climatic conditions of both seasons in the city of Antônio Prado during the experiment are shown in Figure 1.
The experiment was set in a 6-year-old orchard of ‘Smith’ pear trees grafted on Pyrus calleryana Decne. rootstock. The trees were spaced 1.5 m between each one and 4.8 m between rows, totaling 1,388 trees·ha–1, as well as trained to a central-leader system. Management practices used in the execution of the experiment were: fertilization based on soil analysis; bending branches; phytosanitary treatments when necessary; and weed control.
central tree was evaluated (experimental unit), leaving 1 tree at each end as border. The trees were selected by uniformity and size (canopy volume) and, then, grouped into blocks based on trunk circumference measured at 25 cm from the ground.
At the end of the winter period of both seasons, the trees were pruned and, after 15 days, it was applied Erger® at 5% added to 5% of calcium nitrate, for induction and standardization of budding and flowering. The treatments consisted of: 1) Control: only water; 2) P-Ca 100 mg·L–1 of active ingredient (a. i.); 3) P-Ca 200 mg·L–1 of a. i.; 4) P-Ca 300 mg·L–1 of a. i.; 5) P-Ca 400 mg·L–1 of a. i.; 6) P-Ca 100 mg·L–1 of a. i. + [reapplication of P-Ca when shoot growth resumed (GR)]; 7) P-Ca 200 mg·L–1 of a. i. + (GR); 8) P-Ca 300 mg·L–1 of a. i. + (GR); 9) P-Ca 400 mg·L–1 of a. i. + (GR). All treatments received P-Ca application when shoots had 2.5 – 5 cm of length, and the treatments 6 to 9 received reapplication of P-Ca every time shoot growth resumed. The P-Ca source was the commercial product Viviful® (Iharabras S.A. Chemical Industries), containing 27.5% of active ingredient, that was applied with the surfactant Silwet® L-77 Ag, at a rate
of 0.5 mL·L–1 (0.05%). P-Ca was sprayed using a powered backpack sprayer Stihl SR430. At the time of application, the limit volume applied was the runoff point.
Shoot length for all treatments was measured on 10 one-year-old shoots with similar diameters in the 4 quadrants of the plant with a similar height, evenly selected and tagged at the time of the first application and, then, at biweekly intervals until the end of the season. Similarly, the diameter of the fruits was measured on 10 fruits with similar diameters in the 4 quadrants of the plants with a similar height, evenly selected and tagged between 20 and 30 days after full bloom (DAFB) and, then, at biweekly intervals until harvest. Average growth rate (mm·day–1) was calculated using biweekly shoot length data. In the fall of 2013/2014 season, 2 scaffolds per tree were selected and the total number of shoots and their annual shoot growth per scaffold were determined and expressed as the total growth in centimeters per scaffold cross-sectional area (SCA), expressed in cm·cm–2. SCA was calculated from the circumference of the scaffold, measured at 10 cm from the trunk. The annual growth of trunk cross sectional area (TCSA) was registered at the
Figure 1. Monthly average of minimal and maximum temperatures, monthly rainfall, and monthly average solar radiation Dgt in the city of Antônio Prado in 2013/2014 and 2014/2015 seasons (a and b, respectively).
0 5 10 15 20 25 30
0 5 10 15 20 25 30 35
Temper
atur
e (
oC)
35
Temper
atur
e (
oC)
Aug. 2013 Sept. 2013 Oct. 2013 Nov. 2013 Dec. 2013 Jan. 2014 Feb. 2014 Mar. 2014 Apr. 2014 May 2014 June 2014 July 2014 0 50 100 150 200 250 300 350 450
may/14
Aug. 2014 Sept. 2014 Oct. 2014 Nov. 2014 Dec. 2014 Jan. 2015 Feb. 2015 Mar. 2015 Apr. 2015 May 2015 June 2015 July 2015
R
ainf
all [mm] and solar
radiation Dgt (W∙m
−2)
0 50 100 150 200 250 300 350 450
may/14 R
ainf
all [mm] and solar
radiation Dgt (W∙m
−2)
Monthly avarage minimal temperatures Montly rainfall
Monthly avarage maximum temperatures Montly avarage solar radiation Dgt Source:
Rainfall data from the Companhia Riograndense de Saneamento (CORSAN); temperature and solar radiation data from the Antônio Prado Weather Station.
(a)
beginning and at the end of each season, by measuring the trunk circumference at 25 cm of the surface soil. The final value was subtracted from the initial value, and, thus, it was calculated the TCSA increase, expressed in cm–2. The TCSA was calculated according the following formulas:
juice mixed with distilled water at a ratio of 1:10, with a solution of NaOH 0.1 N to a pH end point of 8.1 using a digital microprocessor pH meter model DLA-pH. Titratable acidity, which is expressed as a percentage of malic acid, was calculated according to the following formula:
TCSA = π·r2 and r = C/2·π
where: π = 3.1416; r represents the radius; C represents the trunk circumference.
At full bloom, the number of flower clusters per tree was counted. After natural fruit drop, 30-40 DAFB, the remaining fruit in each experimental unit was counted and the fruit set, calculated (%). Return bloom was determined at full bloom and expressed as the number of flower clusters per tree. Full bloom occurred on 5 September 2013, 21 August 2014, and 23 August 2015.
Fruits were harvested at commercial timing: 16 January 2014 (134 DAFB) and 5 January 2015 (138 DAFB). The total number of fruit per tree were counted and weighted. Estimated yield was calculated based on the yield per tree and the number of trees per ha. The average fruit weight was calculated using the yield per tree and the number of fruits per tree. Fruit qualitative attributes were determined in a sample of 10 fruits per tree randomly selected at harvest. Additionally, in 2014/2015 season, a sample of 20 fruits per tree were immediately placed in regular air cold storage (RACS) (0 ± 1 °C and relative humidity of 90%), where it remained for 15 and 30 days. To simulate the ripening period (RP), the fruits taken from regular air cold storage remained at room temperature (20 ± 1 °C; relative humidity of 65 – 70%) for 3 days before the evaluation.
In the 2014/2015 season, return yield following P-Ca application in the previous season (2013/2014) was determined by counting and weighing the total fruits per tree to obtain the yield, estimated yield, and average fruit weight.
The qualitative attributes of the fruits analyzed were flesh firmness (FF), total soluble solids (TSS), and titratable acidity (TA). Flesh firmness was determined by removing fruit skin on 2 opposite sides of each fruit, using a digital penetrometer with an 8 mm diameter probe, expressed in Newton (N). To measure the total soluble solids (TSS), the sample was juiced, and placed on the prism of a digital refractometer model Atago PAL-1; expressed as °Brix. Titratable acidity (TA) was measured by titrating the
% malic acid = (Vs × N × Meq. Ac. × 100)/S
where: Vs is the volume of NaOH spent (mL); N is the normality of the NaOH solution used, equal to 0.1 N; Meq. Ac. represents the milliequivalent acid, to which malic acid is 0.06705; S means the juice volume used (10 mL). The statistical analysis were performed using the R software (R Core Team 2014), with package ExpDes (Ferreira et al. 2013). Data expressed as percentage or counts were transformed by arcsin [square root (n + 1)] and square root (n + 0.5) analysis, respectively. Analysis of variance (ANOVA) was performed by F-test and, when significant, the data were submitted to mean comparison by Duncan’s test at 5% of significance. Polynomial regression analysis between P-Ca rates without reapplication, the final shoot length, and the final fruit diameter were performed (p < 0.05).
RESULTS AND DISCUSSION
In both seasons, the treatment that showed the greatest effi ciency to control shoot length was the rate of 400 mg·L–1 GR, followed by other rates with and without GR. Th e treatments showed a reduction in fi nal shoot length between ~20 and ~56% compared to control trees in both seasons (Table 1). Regardless the rate, total shoot length of P-Ca treated trees was lower than control trees (Table 1).
Th e greatest reduction was observed at the rates of 400 and 300 mg·L–1 GR, where the reduction was ~58 and 54%, respectively, relative to control. Th ere was signifi cant diff erence between rates with and without reapplication when shoot growth resumed in 2013/2014 and 2014/2015 seasons (Table 1). In both seasons, plants with P-Ca applications had lower TCSA increase compared to control (Table 1). 0
10 20 30 40 50 60 70 80 90 100 110 120 130
0 15 30 45 60 75 90 105 120 135 150 165 180 195
Shoot length (cm)
Days aer full bloom
0 15 30 45 60 75 90 105 120 135 150 165 180 195
Days aer full bloom
0 15 30 45 60 75 90 105 120 135 150 165 180 195
Days aer full bloom
0 15 30 45 60 75 90 105 120 135 150 165 180 195
Days aer full bloom
0 10 20 30 40 50 60 70 80 90 100 110 120 130
Shoot length (cm)
Control 100 mg·L–1
100 mg·L–1 (GR)
200 mg·L–1 (GR)
300 mg·L–1 (GR)
400 mg·L–1 (GR)
200 mg·L–1
300 mg·L–1
400 mg·L–1
20
15
10
5
0
Shoot growth rate
(mm∙day
−1)
20
15
10
5
0
Shoot growth rate
(mm∙day
−1)
y = –0.1239x + 116.86 R2 = 0.9476
R2 = 0.9322
p ≤ 0.0001
p ≤ 0.0001
0 20 40 60 80 100 120 140
0 50 100 150 200 250 300 350 400
Shoot length (cm)
0 20 40 60 80 100 120 140
Shoot length (cm)
P-Ca rates
0 50 100 150 200 250 300 350 400
P-Ca rates
y = –0.1078x + 108.92
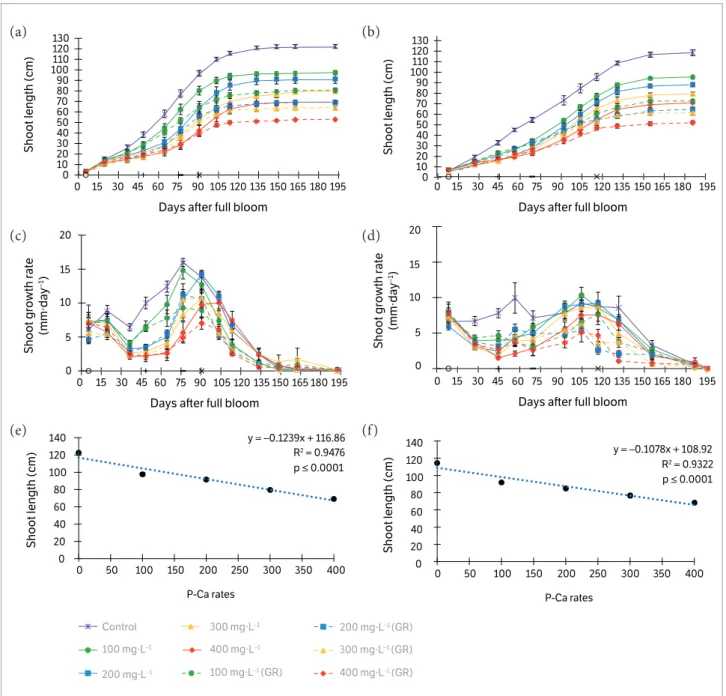
Figure 2. Eff ects of 2013/2014 (a, c, and e) and 2014/2015 (b, d, and f) P-Ca applications on shoot length (a and b), shoot growth rate (c and d), and regression of fi nal shoot length applied once (e and f) on ‘Smith’ pear shoots. Circle on the x-axis denotes the fi rst application
of P-Ca; the + on the x-axis denotes time of reapplication when shoot growth resumed (GR) for 100 mg·L–1 (2013/2014 and 2014/2015);
the dash on the x-axis denotes time of reapplication GR for 200 and 300 mg·L–1 and 200, 300, and 400 mg·L–1 (2013/2014 and 2014/2015,
respectively); and the x on the x-axis denotes time of reapplication GR for 100 and 400 mg·L–1 and 100 mg·L–1 (2013/2014 and 2014/2015,
respectively). Vertical bars represent ± standard error. (a)
(c)
(e)
(b)
(d)
The lowest values were observed with the rate of 400 mg·L–1 GR, where the reduction was ~29% (2013/2014) and ~54% (2014/2015) compared to control trees.
Vegetative growth control of P-Ca treated trees was consistent with other studies (Rademacher 2004; Asín et al. 2007; Hawerroth et al. 2012; Einhorn et al. 2014; Pasa and Einhorn 2014; Carra et al. 2016). All P-Ca rates tested were efficient to control vegetative growth of ‘Smith’ pears. In 2013/2014 and 2014/2015 seasons, a stronger secondary growth flush was observed starting at ~45 until ~116 DAFB, period when most of P-Ca reapplications were done. Even tough P-Ca has a relatively rapid metabolism in plant tissue (2 – 3weeks; Evans et al. 1999), our results are similar to those found in ‘d’Anjou’ and ‘Le Conte’ pear trees, where a pronounced second growth flush occurred at 87 DAFB (Pasa and Einhorn 2014) and ~90 DAFB (Carra et al. 2016), respectively.
The secondary flush of growth seems to be rate dependent, since after a couple of weeks a second application was necessary in the trees treated with 100 mg·L–1, and only after 10 – 13 weeks from application for trees treated with 200, 300, and 400 mg·L–1. Besides, higher temperature seems to be correlated with secondary growth flushes, as observed for ‘d’Anjou’, where the application of 250 mg·L–1 of P-Ca effectively controlled shoot growth over the entire season in a cooler site of Hood River, while in a warmer site, a second application was required (Einhorn et al. 2014).
At the end of both seasons, for all rates tested, the decrease in growth flush after reapplications caused significant difference in the final shoot length between plants with and without reapplications. This indicates that at additional applications may be necessary when growth resumption occurs, mainly in highly vigorous cultivars, similarly as found in ‘Le Conte’ (Carra et al. 2016) and ‘d’Anjou’ (Pasa and Einhorn 2014) pears. In the present study, the linear regression between P-Ca rates and the final shoot length was similar to what was found in ‘Housui’ (Hawerroth et al. 2012) and ‘Le Conte’ (Carra et al. 2016) pear trees, in which the greatest reduction values were observed as increasing the P-Ca rate (Figures 2e,f ).
Plants treated with P-Ca had lower TCSA increase compared to control plants in both seasons. The difference was almost exclusively between the plants treated with P-Ca (regardless of the rate used) and the control plants, and the largest reduction in TCSA increase was observed at the rate of 400 mg·L–1 GR (Table 1). Similar results were reported in apple (Zadravec et al. 2008) and pear trees (Carra et al. 2016). The TCSA reduction in response to P-Ca ranged from 8 to 29% in 2013/2014 and from 30 to 54% in 2014/2015 season, relative to control trees. The greatest reductions were associated with higher P-Ca rates. The trunk is a carbohydrate storage organ (Loescher et al. 1990), and photo-assimilate accumulation at the end of the growing season has been shown to be positively 1Mean separation within columns by Duncan’s test at p < 0.05 ― means followed by different letters are significantly different; 2The data are expressed as the
total growth in centimeters per scaffold cross-sectional area (SCA), which was calculated from the circumference of the scaffold, 10 cm from its point of origin to the trunk. TCSA = Trunk cross sectional area; GR = Reapplication of P-Ca when shoot growth resumed.
Table 1. Total shoot length, final shoot length, and trunk cross sectional area of ‘Smith’ pear treated with prohexadione calcium1.
Treatments
2013 – 2014 2014 – 2015
Total shoot length (cm·cm–2 SCA)2
Final shoot length (cm)
TCSA increase
(cm–2)
Final shoot length (cm)
TCSA increase (cm–2)
Control 39.92 a 122.43 a 26.58 a 114.57 a 19.33 a
P-Ca 100 mg·L–1 32.39 b 97.44 b 24.52 b 92.33 b 13.45 b
P-Ca 200 mg·L–1 27.73 c 91.43 c 23.71 bc 84.99 c 9.90 cd
P-Ca 300 mg·L–1 23.42 d 79.75 d 22.43 cd 76.75 d 10.80 bcd
P-Ca 400 mg·L–1 20.87 e 69.31 e 21.74 d 69.18 e 12.59 bc
P-Ca 100 mg·L–1 (GR) 27.51 c 80.79 d 23.11 bcd 70.01 e 10.45 bcd
P-Ca 200 mg·L–1 (GR) 19.24 ef 69.22 e 22.71 cd 62.46 f 13.37 b
P-Ca 300 mg·L–1 (GR) 18.17 fg 64.04 e 21.40 d 59.15 f 10.84 bcd
P-Ca 400 mg·L–1 (GR) 16.79 g 52.99 f 18.81 e 50.39 g 8.90 d
CV (%) 5.67 5.32 5.58 4.94 18.92
correlated with the yield in the following season in apple trees (Greer et al. 2002). Even though TCSA reduction is desirable in order to hold tree vigor, a strong reduction could lead to lower reserve accumulation, and possibly impairing the next season yield, such as we have found in the present study.
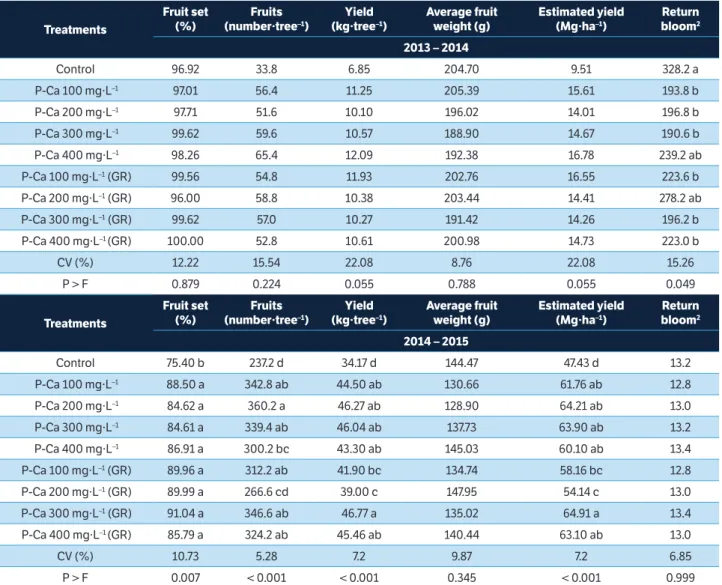
Fruit set, number of fruits per tree, yield, average fruit weight and estimated yield were not affected by P-Ca applications with or without GR in 2013/2014 season, but the return bloom was affected (Table 2). However, in 2014/2015 season, the opposite was found, when all variables were affected by P-Ca applications, except the average fruit weight and the return bloom. The average fruit diameter (Figure 3) was not affected
by P-Ca applications in both seasons (Figures 3a,b). The regression curve of fruit diameter values depending on the P-Ca rate in both seasons shows that there is no effect of P-Ca rate on fruit size of ‘Smith’ pears (Figures 3c,d). Fruit set and number of fruit per tree were not significantly affected in the first season, similarly as found in ‘Spadona’ (Asín et al. 2007), ‘Bartlett’, ‘Bosc’, and ‘Red Anjou’ (Sugar et al. 2004), and ‘Northern Spy’ apple (Duyvelshoff and Cline 2013). The opposite was observed in the second season, similarly as found in ‘d’Anjou’ (Einhorn et al. 2014), ‘Housui’ (Hawerroth et al. 2012), and apples (Greene 2007, 2008), where the P-Ca application increased fruit set and number of fruits per tree. According to Greene (2008), the fruit set increase is
Table 2. Effect of prohexadione calcium application on fruit set, number of fruits per tree, yield, average fruit weight, estimated yield, and
return bloom of ‘Smith’ pear1.
Treatments
Fruit set (%)
Fruits (number·tree–1)
Yield (kg·tree–1)
Average fruit weight (g)
Estimated yield (Mg·ha–1)
Return bloom2
2013 – 2014
Control 96.92 33.8 6.85 204.70 9.51 328.2 a
P-Ca 100 mg·L–1 97.01 56.4 11.25 205.39 15.61 193.8 b
P-Ca 200 mg·L–1 97.71 51.6 10.10 196.02 14.01 196.8 b
P-Ca 300 mg·L–1 99.62 59.6 10.57 188.90 14.67 190.6 b
P-Ca 400 mg·L–1 98.26 65.4 12.09 192.38 16.78 239.2 ab
P-Ca 100 mg·L–1 (GR) 99.56 54.8 11.93 202.76 16.55 223.6 b
P-Ca 200 mg·L–1 (GR) 96.00 58.8 10.38 203.44 14.41 278.2 ab
P-Ca 300 mg·L–1 (GR) 99.62 57.0 10.27 191.42 14.26 196.2 b
P-Ca 400 mg·L–1 (GR) 100.00 52.8 10.61 200.98 14.73 223.0 b
CV (%) 12.22 15.54 22.08 8.76 22.08 15.26
P > F 0.879 0.224 0.055 0.788 0.055 0.049
Treatments
Fruit set (%)
Fruits (number·tree–1)
Yield (kg·tree–1)
Average fruit weight (g)
Estimated yield (Mg·ha–1)
Return bloom2
2014 – 2015
Control 75.40 b 237.2 d 34.17 d 144.47 47.43 d 13.2
P-Ca 100 mg·L–1 88.50 a 342.8 ab 44.50 ab 130.66 61.76 ab 12.8
P-Ca 200 mg·L–1 84.62 a 360.2 a 46.27 ab 128.90 64.21 ab 13.0
P-Ca 300 mg·L–1 84.61 a 339.4 ab 46.04 ab 137.73 63.90 ab 13.2
P-Ca 400 mg·L–1 86.91 a 300.2 bc 43.30 ab 145.03 60.10 ab 13.4
P-Ca 100 mg·L–1 (GR) 89.96 a 312.2 ab 41.90 bc 134.74 58.16 bc 12.8
P-Ca 200 mg·L–1 (GR) 89.99 a 266.6 cd 39.00 c 147.95 54.14 c 13.0
P-Ca 300 mg·L–1 (GR) 91.04 a 346.6 ab 46.77 a 135.02 64.91 a 13.4
P-Ca 400 mg·L–1 (GR) 85.79 a 324.2 ab 45.46 ab 140.44 63.10 ab 13.0
CV (%) 10.73 5.28 7.2 9.87 7.2 6.85
P > F 0.007 < 0.001 < 0.001 0.345 < 0.001 0.999
.
1Mean separation within columns by Duncan’s test at p < 0.05 — means followed by different letters are significantly different; 2Number of flowers clusters per
more related to a reduction in fruit abscission, than to a larger number of fruit per plant initially. Therefore, the application of P-Ca is recommended 2 to 3 weeks after the full bloom, to decreased fruit abscission (Vercammen and Gomand 2008). The potential of P-Ca increasing fruit set can be attributed to its action interfering the ethylene metabolism (Rademacher 2004), which carries essential role in fruit abscission (Gepstein and Kieber 2013). The response of fruit set to P-Ca application is not consistent among studies, which indicates the complexity of the process and the many factors that modulate it, as genotypic responses/sensitivity to ethylene, hormonal balance, production of previous years, seasons of P-Ca application and environmental conditions before, during and after application (Stover and Greene 2005). A possible explanation for the differences in fruit set among seasons is the solar radiation. Fruit abscission is highly affected by carbohydrate availability, i.e., in situations of low carbohydrates supply (cloudy and/or rainy conditions)
fruit abscission if facilitated, the inverse being true. In addition, a strong vegetative growth competes for carbohydrates with young fruitlets. In the first season, solar radiation during the period of fruit set was greater than in the second season (Figure 1). Then, the stronger shoot growth of untreated trees did not impair fruit set, probably because the solar radiation enabled a high rate of photosynthesis to produce enough carbohydrates for both shoot and fruit growth.
Average fruit diameter and average fruit weight of ‘Smith’ pear trees in both seasons were not affected by P-Ca applications. Similar results for average fruit weight were observed in two of three seasons of ‘d’Anjou’ pear trees treated with P-Ca (Einhorn et al. 2014) and in ‘Le Conte’ pears (Carra et al. 2016). In the first season, different rates of P-Ca, with and without reapplication, in ‘Smith’ pear trees did not affect the yield and estimated yield (Table 2). The same was found in other cultivars, such as ‘Conference’ (Rademacher 2004), ‘Blanquilla’ (Asín et al.
90 80 70
60 50 40 30 20 10
0
20 30 40 50 60 70 80 90 100 110 140 130 140
Days aer full bloom
y = 0.0045x + 62.055 y = –0.0107x + 75.697
R2 = 0.1752
R2 = 0.1551 p = 0.5591
p = 0.3192 80
100
60
40
20
0
80 100
60
40
20
0
Control
100 mg∙L–1
100 mg∙L–1 (GR)
200 mg∙L–1 (GR)
300 mg∙L–1 (GR)
400 mg∙L–1 (GR)
200 mg∙L–1
300mg∙L–1
400 mg∙L–1
0 50 100 150 200 250 300 350 400
P-Ca rates
0 50 100 150 200 250 300 350 400
P-Ca rates
Fruit diameter (mm)
Fruit diameter (mm)
Fruit diameter (mm)
90 80
70
60 50 40 30 20 10
0
20 30 40 50 60 70 80 90 100 110 120 130 140
Days aer full bloom
Fruit diameter (mm)
Figure 3. Eff ects of 2013/2014 (a and c) and 2014/2015 (b and d) P-Ca applications on fruit diameter (a and b) and regression of fi nal fruit diameter applied once (c and d) on ‘Smith’ pear fruits. Vertical bars represent ± standard error.
(a)
(c)
(b)
2007) and ‘d’Anjou’ (Einhorn et al. 2014). However, in the second season, P-Ca applications increased both, yield and estimated yield (Table 2), due to higher fruit set and number of fruits per tree in plants with P-Ca applications. Similar results were found in ‘Golden Delicious’ apple trees (Ramírez et al. 2006), ‘Williams’ (Lafer 2008) and ‘Housui’ pear trees (Hawerroth et al. 2012).
Return bloom was negatively affected by the use of P-Ca in 2013/2014 growing season (Table 2), the same observed in ‘d’Anjou’ pears (Einhorn et al. 2014) and ‘Mutsu’ apples (Greene 2008). On the contrary, in 2014/2015 growing season, the return bloom was not affected by the use of P-Ca. Similar results as the 2014/2015 growing season, where the return bloom was not affected by P-Ca applications were observed in ‘Bartlett’, ‘d’Anjou’ (Sugar et al. 2004), ‘Blanquilla’ (Asín et al. 2007) and ‘Le Conte’ pear trees (Carra et al. 2016). It is widely acknowledged that there is an inverse relationship between fruit set and return bloom. According to Greene (2008), this principle is false, and plants that did not have a higher fruit set with application of P-Ca had still lower return bloom compared to control plants, the same found in the present study in the first season. In the other hand, the reduction of return bloom in ‘d’Anjou’ pears following P-Ca application was positively related to fruit set (Einhorn et al. 2014). Flower bud formation in temperate fruit trees is a complex biological phenomenon, which is related to the characteristics of
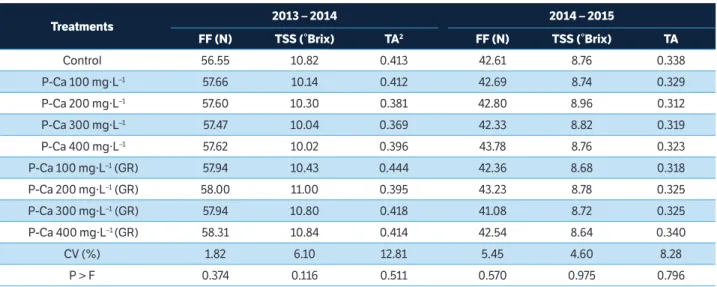
the fruit tree species and cultivars, ecological conditions and agricultural practices (Koutinas et al. 2010). The way return bloom is affected by P-Ca application in pear trees is still not well understood, needing more studies. Fruit quality attributes (flesh firmness, total soluble solids and titratable acidity) of ‘Smith’ pear trees at harvest in both seasons (Table 3) and when they were stored for a period of 15 and 30 days RACS + 3 days RP in 2014/2015 season (Table 4) were not affected by P-Ca applications with and without GR. Similar results were found for ‘d’Anjou’ (Einhorn et al. 2014), and ‘Le Conte’ pears (Carra et al. 2016). The results regarding total soluble solids, where P-Ca did not differ to control, agree with those found for ‘Le Conte’ pears (Carra et al. 2016). Hawerroth et al. (2012) and Carra et al. (2016) found similar results of titratable acidity, where P-Ca applications did not differ to control. The results we have found are important, because P-Ca does not have negative effects on fruit quality attributes at harvest and following cold storage.
Return yield of ‘Smith’ pear trees following P-Ca application in the previous season (2013/2014) showed significant differences in the number of fruits per tree, yield, estimated yield and average fruit weight (Table 5). For number of fruits per tree, the lowest values were observed in plants subjected to P-Ca applications, except in the rate of 200 mg·L–1 GR, which showed no difference compared to control plants. Similar results for number
Treatments 2013 – 2014 2014 – 2015
FF (N) TSS (°Brix) TA2 FF (N) TSS (°Brix) TA
Control 56.55 10.82 0.413 42.61 8.76 0.338
P-Ca 100 mg·L–1 57.66 10.14 0.412 42.69 8.74 0.329
P-Ca 200 mg·L–1 57.60 10.30 0.381 42.80 8.96 0.312
P-Ca 300 mg·L–1 57.47 10.04 0.369 42.33 8.82 0.319
P-Ca 400 mg·L–1 57.62 10.02 0.396 43.78 8.76 0.323
P-Ca 100 mg·L–1 (GR) 57.94 10.43 0.444 42.36 8.68 0.318
P-Ca 200 mg·L–1 (GR) 58.00 11.00 0.395 43.23 8.78 0.325
P-Ca 300 mg·L–1 (GR) 57.94 10.80 0.418 41.08 8.72 0.325
P-Ca 400 mg·L–1 (GR) 58.31 10.84 0.414 42.54 8.64 0.340
CV (%) 1.82 6.10 12.81 5.45 4.60 8.28
P > F 0.374 0.116 0.511 0.570 0.975 0.796
Table 3. Effect of prohexadione calcium application on fruit quality attributes of ‘Smith’ pear at harvest plus 3 days of ripening period at room
temperature in 2013 – 2014 and 2014 – 2015 seasons1.
1Means were analyzed by Duncan’s test at p < 0.05; 2% of malic acid. FF = Flesh firmness; TSS = Total soluble solids; TA = Titratable acidity; GR = Reapplication
.
1Mean separation within columns by Duncan’s test at p < 0.05; means followed by different letters are significantly different. GR = Reapplication of P-Ca when
shoot growth resumed.
Table 4. Effect of prohexadione calcium application on fruit quality attributes of ‘Smith’ pear after 15 days of regular air cold storage plus
3 days of ripening period and after 30 days of regular air cold storage plus 3 days of ripening period in the 2014 – 2015 season1.
Treatments 15 days RACS + 3 days RP 30 days RACS + 3 days RP
FF (N) TSS (°Brix) TA2 FF (N) TSS (°Brix) TA
Control 26.91 8.7 0.245 24.75 8.9 0.224
P-Ca 100 mg·L–1 28.56 8.74 0.235 25.26 8.68 0.243
P-Ca 200 mg·L–1 26.8 9.06 0.239 23.99 8.18 0.198
P-Ca 300 mg·L–1 27.68 8.82 0.229 23.93 8.62 0.204
P-Ca 400 mg·L–1 28.43 9.14 0.243 25.43 8.58 0.223
P-Ca 100 mg·L–1 (GR) 28.66 8.76 0.240 25.96 8.52 0.219
P-Ca 200 mg·L–1 (GR) 29.59 9.14 0.261 24.66 8.7 0.223
P-Ca 300 mg·L–1 (GR) 29.25 8.58 0.245 23.32 8.72 0.230
P-Ca 400 mg·L–1 (GR) 26.32 8.84 0.238 22.98 8.66 0.186
CV (%) 7.58 4.21 10.34 11.39 6.16 13.34
P > F 0.192 0.208 0.741 0.738 0.709 0.999
.
1Means were analyzed by Duncan’s test at p < 0.05; 2% of malic acid. RACS = Regular air cold storage; RP = Ripening period; FF = Flesh firmness; TSS = Total
soluble solids; TA = Titratable acidity; GR = Reapplication of P-Ca when shoot growth resumed.
of fruits per tree in plants treated with P-Ca were found by Einhorn et al. (2014), and the contrary by Carra et al. (2016). The average fruit weight was lowest in the treatments that showed higher number of fruits per tree. According to Greene (2007), it is widely acknowledged that there is an inverse relationship between fruit set and fruit size. Furthermore, we can say that there is an inverse relationship between number of fruits per tree and average fruit weight, like observed in this study. Even with lower number of fruits per tree in plants treated with P-Ca, only the rates of 100 and 300 mg·L–1 and
Table 5. Return yield of ‘Smith’ pear following prohexadione calcium application in the previous season (2013 – 2014)1.
Treatments
Return yield (2013 – 2014)
Fruits (number·tree–1)
Yield (kg·tree–1)
Estimated yield (Mg·ha–1)
Average fruit weight (g)
Control 396.4 a 52.20 ab 72.46 ab 131.71 b
P-Ca 100 mg·L–1 269.2 c 44.07 d 61.17 d 164.43 a
P-Ca 200 mg·L–1 306.6 bc 47.96 bcd 66.57 bcd 157.07 a
P-Ca 300 mg·L–1 282.8 bc 45.30 cd 62.87 cd 160.88 a
P-Ca 400 mg·L–1 299.8 bc 47.71 bcd 66.23 bcd 159.63 a
P-Ca 100 mg·L–1 (GR) 294.6 bc 45.59 cd 63.27 cd 155.82 a
P-Ca 200 mg·L–1 (GR) 430.6 a 54.13 a 75.13 a 125.75 b
P-Ca 300 mg·L–1 (GR) 291.0 bc 46.59 bcd 64.67 bcd 161.14 a
P-Ca 400 mg·L–1 (GR) 319.0 b 50.85 abc 70.58 abc 160.46 a
CV (%) 5.29 8.45 8.45 5.74
P > F < 0.001 0.005 0.005 < 0.001
100 mg·L–1 GR affected negatively the yield and the estimated yield following P-Ca applications in the previous season. Rademacher (2004) did observe reduction of return yield in ‘Conference’ pear trees treated with P-Ca, even with lower return bloom. However, Einhorn et al. (2014), in ‘d’Anjou’ pear trees, observed that P-Ca application caused a decrease in return yield relative to untreated trees, following reduced return bloom.
needing further studies with the effect of P-Ca application in the return bloom and return yield, as well as work with plant growth regulators to increase return bloom.
CONCLUSION
P-Ca effectively reduces vegetative growth of ‘Smith’ pears, and its effect is rate-dependent. Yield components (fruit set, number of fruits per tree, yield, and fruit size) are not negatively affected by P-Ca.
Fruit quality attributes, at harvest and following 15 and 30 days of cold storage, are not affected by P-Ca. Return
bloom and yield may be reduced by P-Ca, depending on the growing season.
ACKNOWLEDGEMENTS
The authors would like to thank the Coordination for the Improvement of Higher Education Personnel (CAPES) as well as the National Council for Scientific and Technological Development (CNPq), for grant support, besides the grower Ariel Lovatel and his family, for providing plant material and supporting the research.
Asín, L., Alegre, S. and Montserrat, R. (2007). Effect of paclobutrazol,
prohexadione-Ca, deficit irrigation, summer pruning and root
pruning on shoot growth, yield, and return bloom, in a ‘Blanquilla’
pear orchard. Scientia Horticulturae,113, 142-148. http://dx.doi.
org/10.1016/j.scienta.2007.02.008.
Carra, B., Pasa, M. S., Fachinello, J. C., Spagnol, D., Abreu, E. S.
and Giovanaz, M. A. (2016). Prohexadione calcium affects shoot
growth, but not yield components, of ‘Le Conte’ pear in
warm-winter climate conditions. Scientia Horticulturae,209, 241-248.
http://dx.doi.org/10.1016/j.scienta.2016.06.036.
Duyvelshoff, C. and Cline, J. A. (2013). Ethephon and
prohexadione-calcium influence the flowering, early yield, and vegetative growth
of young ‘Northern Spy’ apple trees. Scientia Horticulturae,151,
128-134. http://dx.doi.org/10.1016/j.scienta.2012.12.002.
Einhorn, T. C., Pasa, M. S. and Turner, J. (2014). ‘D’Anjou’ pear
shoot growth and return bloom, but not fruit size, are reduced by
prohexadione-calcium. HortScience, 49, 180-187.
Evans, J. R., Evans, R. R., Regusci, C. L. and Rademacher, W.
(1999). Mode of action, metabolism, and uptake of BAS 125W,
prohexadione-calcium. HortScience, 34, 1200-1201.
Ferreira, E. B., Cavalcanti, P. P. and Nogueira, D. A. (2013). ExpDes:
Experimental Designs pacakge. R package version 1.1.2; [accessed
2016 Jun 13]. http://CRAN.R-project.org/package=ExpDes
Food and Agriculture Organization of the United Nations (2016).
FAOSTAT; [accessed 2016 Jul 11]. http://faostat.fao.org/site/567/
DesktopDefault.aspx?PageID=567#ancor
REFERENCES
Gepstein, S. and Kieber, J. (2013). Etileno. In L. Taiz and E.
Zeiger (Eds.), Fisiologia vegetal. 5. ed. (p. 647-676). Porto
Alegre: Artmed.
Greene, D. W. (2007). The effect of prohexadione-calcium on fruit set
and chemical thinning of apple trees. HortScience, 42, 1361-1365.
Greene, D. W. (2008). The effect of repeat annual applications of
prohexadione — calcium on fruit set, return bloom, and fruit size
of apples. HortScience, 43, 376-379.
Greer, D. H., Wünsche, J. N. and Halligan, E. A. (2002). Influence
of postharvest temperatures on leaf gas exchange, carbohydrate
reserves and allocations, subsequent budbreak, and fruit yield of
‘Braeburn’ apple (Malus domestica) trees. New Zealand Journal of
Crop and Horticultural Science, 30, 175-185.
Hawerroth, F. J., Petri, J. L., Fachinello, J. C. and Herter, F. G.
(2012). Redução da poda hibernal e aumento da produção de
pereiras ‘Hosui’ pelo uso de prohexadiona cálcio. Pesquisa
Agropecuária Brasileira, 47, 939-947. http://dx.doi.org/10.1590/
S0100-204X2012000700010.
Koutinas, N., Pepelyankov, G. and Lichev, V. (2010). Flower
induction and flower bud development in apple and sweet cherry.
Biotechnology and Biotechnological Equipment, 24, 1549-1558.
http://dx.doi.org/10.2478/V10133-010-0003-9.
Lafer, G. (2008). Effects of different bioregulator applications
on fruit set, yield and fruit quality of ‘Williams’ pears. Acta
Horticulturae, 800, 183-188. http://dx.doi.org/10.17660/
Loescher, W. H., McCamant, T. and Keller, J. D. (1990). Carbohydrate
reserves, translocation, and storage in woody plant roots.
HortScience, 25, 274-281.
Pasa, M. S. and Einhorn, T. C. (2014). Heading cuts and
prohexadione-calcium affect the growth and development of ‘d’Anjou’ pear shoots
in a high-density orchard. Scientia Horticulturae, 168, 267-271.
http://dx.doi.org/10.1016/j.scienta.2014.02.003.
Pasa, M. S., Fachinello, J. C., Schmitz, J. D., de Souza, A. L. K. and Herter,
F. G. (2011). Hábito de frutificação e produção de pereiras sobre
diferentes porta-enxertos. Pesquisa Agropecuária Brasileira, 46,
998-1005. http://dx.doi.org/10.1590/S0100-204X2011000900005.
R Core Team (2014). R: A language and environment for statistical
computing. R Foundation for Statistical Computing, Vienna, Austria;
[accessed 2016 Jun 13]. Available in: <http://www.R-project.org/
Rademacher, W. (2004). Chemical regulation of shoot growth in
fruit trees. Acta Horticulturae, 653, 29-32. http://dx.doi.org/10.17660/
ActaHortic.2004.653.2.
Ramírez, H., Alonso, S. and Benavides, A. (2006). Prohexadione-Ca
modifies growth and endogenous hormones in the shoot apex
in apple trees. Acta Horticulturae, 727, 117-124. http://dx.doi.
org/10.17660/ActaHortic.2006.727.12.
Rufato, L., Marcon Filho, J. L., Marodin, G. A. B., Kretzschmar,
A. A. and Miqueluti, D. J. (2012). Intensidade e época de poda
verde em pereira ‘Abate Fetel’ sobre dois porta-enxertos. Revista
Brasileira de Fruticultura, 34, 475-481. http://dx.doi.org/10.1590/
S0100-29452012000200021.
Sharma, S., Rehalia, A. S. and Sharma, S. D. (2009). Vegetative
growth restriction in pome and stone fruits — A review. Agricultural
Reviews, 30, 13-23.
Stover, E. W. and Greene, D. W. (2005). Environmental effects on
the performance of foliar applied plant growth regulators: A review
focusing on tree fruits. Horttechnology, 15, 214-221.
Sugar, D., Elfving, D. C. and Mielke, E. A. (2004). Effects of
prohexadione-calcium on fruit size and return bloom in pear.
HortScience, 39, 1305-1308.
Vercammen, J. and Gomand, A. (2008). Fruit set of ‘Conference’: A
small dose of Gibberellins or Regalis. Acta Horticulturae, 800,
131-138. http://dx.doi.org/10.17660/ActaHortic.2008.800.11.
Zadravec, P., Cmelik, Z., Tojnko, S., Unuk, T. and Schlauer, B. (2008).
Vegetative growth, yield and fruit quality of ‘Gala’ apple treated
with Regalis (Prohexadione-Ca). Acta Horticulturae, 774, 287-290.