www.atmos-meas-tech.net/9/6025/2016/ doi:10.5194/amt-9-6025-2016
© Author(s) 2016. CC Attribution 3.0 License.
The AOTF-based NO
2
camera
Emmanuel Dekemper, Jurgen Vanhamel, Bert Van Opstal, and Didier Fussen
Royal Belgian Institute for Space Aeronomy (BIRA-IASB), Avenue Circulaire 3, 1180 Brussels, Belgium
Correspondence to:Emmanuel Dekemper ([email protected]) Received: 15 July 2016 – Published in Atmos. Meas. Tech. Discuss.: 15 August 2016 Revised: 22 November 2016 – Accepted: 24 November 2016 – Published: 15 December 2016
Abstract.The abundance of NO2in the boundary layer
re-lates to air quality and pollution source monitoring. Ob-serving the spatiotemporal distribution of NO2 above
well-delimited (flue gas stacks, volcanoes, ships) or more ex-tended sources (cities) allows for applications such as moni-toring emission fluxes or studying the plume dynamic chem-istry and its transport. So far, most attempts to map the NO2
field from the ground have been made with visible-light scan-ning grating spectrometers. Benefiting from a high retrieval accuracy, they only achieve a relatively low spatiotemporal resolution that hampers the detection of dynamic features.
We present a new type of passive remote sensing instru-ment aiming at the measureinstru-ment of the 2-D distributions of NO2 slant column densities (SCDs) with a high
spatiotem-poral resolution. The measurement principle has strong sim-ilarities with the popular filter-based SO2camera as it relies
on spectral images taken at wavelengths where the molecule absorption cross section is different. Contrary to the SO2
camera, the spectral selection is performed by an acousto-optical tunable filter (AOTF) capable of resolving the target molecule’s spectral features.
The NO2camera capabilities are demonstrated by imaging
the NO2abundance in the plume of a coal-fired power plant.
During this experiment, the 2-D distribution of the NO2SCD
was retrieved with a temporal resolution of 3 min and a spa-tial sampling of 50 cm (over a 250×250 m2area). The de-tection limit was close to 5×10¹⁶molecules cm−2, with a maximum detected SCD of 4×10¹⁷molecules cm−2. Illus-trating the added value of the NO2 camera measurements,
the data reveal the dynamics of the NO to NO2conversion
in the early plume with an unprecedent resolution: from its release in the air, and for 100 m upwards, the observed NO2
plume concentration increased at a rate of 0.75–1.25 g s−1. In joint campaigns with SO2cameras, the NO2camera could
also help in removing the bias introduced by the NO2
inter-ference with the SO2spectrum.
1 Introduction
Nitrogen oxides (NOx=NO+NO2) play a key role in the
air quality of the boundary layer. While NO is produced in combustion processes (transport, thermal power plants, etc.), NO2 mainly appears through the reaction of NO with O3
or HO2. Eventually, the photolysis of NO2releases an
oxy-gen atom and a NO molecule. To a good approximation, the balance of NO and NO2 is kept constant through this
cycle of photo-chemical reactions, which substantiates the widespread use of the NOx family concept (Seinfeld and
Pandis, 2006). Considering the relative ease of measuring NO2with visible-light spectroscopy, NOxbudgets are often
inferred based on NO2measurements and the photochemical
equilibrium assumption.
The most common NO2 remote sensing techniques rely
the plume through two interference filters. One filter selects a narrow band of the incident spectrum around 310 nm, where SO2is still strongly absorbing, while the other one captures
the light around 330 nm, where almost no more absorption takes place. The main advantages are a typical temporal res-olution of 1 Hz, the capability to capture dynamic features such as puffs in the plume and the possibility to determine the plume speed from the sequence of images. The disad-vantages are the interference by the plume aerosols caused by the coarse spectral resolution and the need for regular re-calibration with reference cells filled with SO2 to account
for changes of illumination conditions (Kern et al., 2010). More recent concepts now use the combined information of a spectrometer with the camera spectral images (Lübcke et al., 2013), which yields a greater measurement accuracy.
We present a new instrument, a spectral imager dedicated to measuring the 2-D NO2 field above finite sources like
thermal power plants, industrial complexes, cities, volcanoes, etc. The measurement principle is close to the SO2
cam-era: snapshots at two wavelengths emphasize the presence of NO2 by taking advantage of absolute differences in the
molecule absorption cross section. Contrary to the SO2
cam-eras which use interference filters, the new instrument relies on an acousto-optical tunable filter (AOTF) to provide the spectral information. The AOTF can offer sufficient spectral resolution to resolve the structures of the NO2spectrum. The
ability to discriminate between weak and strong absorption within a few nanometers virtually cuts out any sensitivity to aerosol scattering and changes of solar angles. Potential ap-plications include urban and industrial pollution monitoring, emission fluxes estimation, satellite-product validation and volcanic plume chemistry.
2 Instrument concept
The AOTF-based NO2camera springs from the ALTIUS
in-strument (atmospheric limb tracker for the investigation of the upcoming stratosphere; Fussen et al., 2016). ALTIUS is a space mission project aimed at the retrieval of atmospheric species concentration profiles with a global geographical coverage and a high vertical resolution. Its primary scientific objective is to measure ozone, but NO2, aerosols, H2O, CH4,
polar stratospheric and noctilucent clouds, and other minor species will be measured as well. Measurements will be per-formed in two different geometries: limb scattering and
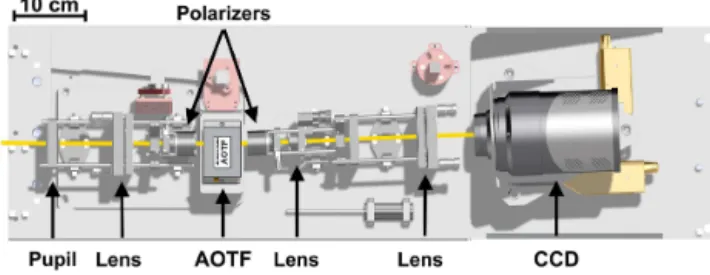
oc-Figure 1.Optical layout of the NO2camera seen from top. Light propagates from left to right through a pupil and a lens doublet, a polarizer selecting vertically polarized light, the AOTF, a second cross-oriented polarizer, two lens doublets and the detector.
cultations (Sun, Moon, stars, planets). To address the prob-lem of tangent height registration of previous limb scatter instruments, a spectral imager concept based on a tunable filter has been selected. During the feasibility study, a pro-totype of the visible (VIS) channel (440–800 nm) was built from commercially available parts. The detailed description of this prototype is given in Dekemper et al. (2012). We will only point out the key features of the concept.
The instrument images a 6◦square FOV onto a Princeton Instrument Pixis 512B peltier-cooled CCD detector (512× 512 pixels). The optical layout (Fig. 1) is linear with an in-termediate focal plane located close to the AOTF. To pre-serve the spectral homogeneity across the image, the design is made telecentric by placing an iris at the object focal point of the first lens. This ensures an identical propagation angle of all light rays through the AOTF.
The most important part of this NO2 camera concept is
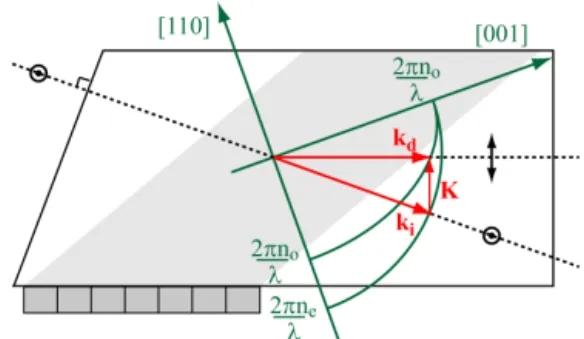
the AOTF (Chang, 1974). AOTFs have been used in many areas requiring spectral images (agriculture, food industry, fluorescence spectroscopy, etc.) but received little attention from the atmospheric remote sensing community. The work-ing principle is based on the interaction of light and sound in a birefringent crystal (see Fig. 2). By the momentum match-ing of the optical and acoustic waves, a narrow portion of the light spectrum is diffracted into a slightly different direction (a few degrees). If the incident radiation is linearly polarized, the diffracted beam will leave the crystal with the orthogonal polarization. The spatial and polarimetric dissociations can be combined to achieve very efficient extinction of the un-wanted spectrum.
Figure 2.Schematics of the acousto-optic interaction in an AOTF (top view). The gray area depicts the acoustic field created by the piezoelectric transducer bonded to a lateral face of the TeO2crystal. The momentum phase matching of the incident (ki) and diffracted (kd) photons with the acoustic wave (K) is represented in the [110] crystallographic frame. The phase matching takes advantage of the medium birefringence: incident and diffracted light beams have or-thogonal polarizations and different propagation directions, which facilitates their selection.
a smooth wavelength dependence. The transducer length de-fines the length of the acousto-optic interaction, which di-rectly affects the AOTF bandwidth: a short transducer will induce a larger passband and vice versa.
The parameters of an AOTF are defined by the crystal elas-tic and opelas-tical properties and by the propagation directions of light and sound in the frame of the crystal axes (Voloshinov et al., 2007). The AOTF we used was manufactured out of a TeO2crystal by the company Gooch & Housego (UK). It
offers an aperture of 10×10 mm2and a tuning range cov-ering the visible spectrum. Laboratory characterization re-vealed a transparency better than 90 % and a DE better than 95 %. In the relevant spectral range for NO2measurements,
i.e., around 450 nm, the STF showed a bandwidth of 0.6 nm. Typical driving frequencies were around 130 MHz, and less than 100 mW of acoustic power was needed in any circum-stances. The theoretical number of resolvable spots at 450 nm is about 350 in the plane of acousto-optic interaction (hori-zon) and 700 in the vertical direction.
3 Measurement principle
There are strong similarities between the measurement prin-ciples of a filter-based SO2camera and an AOTF-based NO2
camera: the FOV needs to be pointed towards the target re-gion (e.g., a plume) while making sure that the background can still be seen in some areas of the image. Two spectral images of the scene are taken: one at a wavelengthλswhere
there is strong absorption by the target species and another at a wavelengthλwwhere there is weak absorption. In each
im-age, the signalSij(λ)(in e−) recorded by pixelij looking at
the plume will be normalized by the background signalS0(λ)
in order to quantify the extinction that took place during the crossing of the plume. The optical thickness τij associated
Figure 3.NO2absorption cross section measured with a Fourier transform spectrometer (gray line; Vandaele et al., 1998) and with this NO2camera in the laboratory (red line). At 450 nm, the spectral resolution of both datasets are 0.04 and 0.6 nm respectively.
with the slant column density (SCD) of the target species ob-served in the FOV of pixelij follows from the comparison of the normalized signals recorded at the two wavelengths.
The major difference comes from the capability of the AOTF-based NO2camera to resolve the fine structures of the
absorption cross section σNO2 (Fig. 3). This allows
choos-ingλsandλwvery close to each other (a few nm),
minimiz-ing the interference by broadband absorbminimiz-ing and scatterminimiz-ing species like aerosols.
3.1 Mathematical model
As AOTFs do not treat different polarizations identically, an AOTF-based NO2camera exhibits a strong polarization
sen-sitivity. The polarization state of a stream of light is described by the Stokes vectors=(I, Q, U, V )T, whereI =Ih+Iv
andQ=Ih−Iv, withIh andIv being the light intensity along the horizontal and vertical axes of a scene frame.U
andV also refer to the orientation of the polarization ellipse but they will not be discussed further because they do not par-ticipate if the AOTF and its surrounding polarizers are well aligned.
ele-0 0 0 2ηeηt
MPh=
1 2
η2t +η2e η2t −ηe2 0 0
η2t −η2e η2t +ηe2 0 0
0 0 2ηeηt 0
0 0 0 2ηeηt
, (3)
whereAis the amplitude of the AOTF STF (i.e., its DE, 0≤
A≤1),η2t is the attenuation of the light intensity along the polarizer transmission axis, and η2e is the attenuation along the extinction axis. Assuming that all three elements have their transmission and extinction axes well aligned, the total Mueller matrix of the camera is simplyM=ηt4·MAOTF. As
the detector only measures the total light intensity, the first element of the Stokes vector is the only meaningful quantity: s′(1)=A·η4
t ·(I−Q)/2=A·η4t ·Iv. Hence, in the present
configuration, the NO2camera is only sensitive to vertically
polarized component of the light.
We now have a description of the light intensity which will be measured by the detector, but we still have to ac-count for the transmittance of the lenses (T) and the quan-tum efficiency (QE) of the detector. These terms exhibit a smooth wavelength dependence. For the AOTF STF, one can use F(λ;λc)=A(λc)·G(λ−λc), where Gis essentially a
sinc2function. Moreover, some parameters are susceptible to vary across the FOV, yielding a pixel-to-pixel variation. This is particularly true when image planes are located close to optical surfaces (mainly the AOTF and the detector). Finally, the electronic current (in e−s−1) found in pixelij when the AOTF is tuned toλcis given by
Cij(λc)= Z
Aij(λc)·η4t(λ)·Iijv(λ)·G(λ−λc)
·T (λ)·QEij(λ)dλ,
≃Aij(λc)·ηt4(λc)·T (λc)·QEij(λc) Z
Iijv(λ)·G(λ−λc)dλ,
=rij(λc) Z
Iijv(λ)·G(λ−λc)dλ. (4)
The decision to leave the smoothly varying parameters out of the integral is supported by the narrow passband of the AOTF (0.6 nm). Their product forms the instrument response at pixelijand wavelengthλc:rij(λc). The remaining integral
is simply the convolution of the vertically polarized incident light intensity with the AOTF STF.
ical species and particles. Over the passband of the AOTF, one can considerτ∗(λ)as a constant valueτ∗(λc)and replace τNO2(λ)by its weighted average:
τNO2(λc)=
R
τNO2(λ)·G(λ−λc)dλ
R
G(λ−λc)dλ
. (6)
As the optical thickness is defined by the product of the trace gas SCDkwith its absorption cross sectionσ, it is clear that
τNO2(λc)=kNO2.σNO2(λc). Under these assumptions, one
can insert Eq. (5) into Eq. (4) and write for the pixel pho-toelectric current:
Cij(λc)=rij(λc)·exp −τNO2ij(λc)−τ∗ij(λc)
·
Z
I0v(λ)·G(λ−λc)dλ. (7)
In the meantime, other pixels have been looking at the unattenuated background intensityI0. Suppose that one of
them is pixel mn. According to Eq. (4), we have
Cmn(λc)=rmn(λc)· Z
I0v(λ)·G(λ−λc)dλ. (8)
Averaging all these background-looking pixels yields the ref-erence current associated with the background intensity:
C0(λc)=r(λc)· Z
I0v(λ)·G(λ−λc)dλ, (9)
withrrepresenting the average instrument response. Divid-ingCijbyC0yields the transmittance of the plume alone:
Tij(λc)= Cij(λc)
rij(λc) C0(λc) r(λc)
=exp −τNO2ij(λc)−τ∗ij(λc)
. (10)
If the spectral interval betweenλw andλs is small enough
that the approximationτ∗(λw)=τ∗(λs)holds, then the
ra-tio of the transmittancesT (λw)/T (λs) is a quantity which
only depends on the NO2 content of the plume.
Introduc-ing the relative instrument response at pixel ij, ρij(λ)= rij(λ)/r(λ), we find
Tij(λw) Tij(λs)
=
Cij(λw)
C0(λw)ρij(λw)
Cij(λs)
C0(λs)ρij(λs)
=exp τNO2ij(λs)−τNO2ij(λw)
. (11)
Finally, the NO2 SCD subtended by the area of the plume
ratio of transmittances:
kNO2ij=
1
σNO2(λs)−σNO2(λw)
·ln
T ij(λw) Tij(λs)
. (12)
Clearly, the best sensitivity is reached by maximizing the dif-ferential optical thickness when selectingλwandλs.
3.2 Ancillary data
Equations (11) and (12) show that the NO2SCD can be
ob-tained from a combination of measurements (the detector sig-nal), cross-section data and the knowledge of the instrument response. In the results presented below, the cross section is taken from Vandaele et al. (1998). For theρijcoefficients, an
ad hoc method was set up to build a synthetic flat field. Tak-ing advantage of a cloudy weather (100 % cloudiness), long-exposure frames (10 s) were captured at the required wave-lengths looking at zenith. The mean image obtained from tens of such frames constitutes the instrument response to a synthetic, radiometrically flat scene. This allows us to re-move wavelength-dependent nonuniformities which can be relatively pronounced in, e.g., the AOTF.
Determining the photoelectric current strictly proportional to the signal (i.e., Cij and C0) implies that voltage offset,
dark current and stray light have been subtracted from the raw data. In this respect, AOTFs offer a unique feature: one can turn them off. This is simply done by bringing the acous-tic wave amplitude to 0. An image acquired in these condi-tions contains anything but the real signal (i.e., dark current, offset, stray light). UsingDij andDijoffto represent the raw
signal of pixelij (in digital numbers, DN) when the AOTF is turned on or off respectively, the photo-electric signal is given by
Sij =
Dij−Dijoff
γ , (13)
whereγis the sensor gain (in DN/e−). The only precaution is to take these dark images regularly because the stray light is a function of the general illumination conditions (e.g., solar angles) and it will vary with local time.
3.3 Data averaging and multiple image doublets
It is often necessary to repeat the measurements in order to average out transient features and increase the signal-to-noise ratio. Assuming that only the plume optical transmis-sion varies, we can write a time-dependent vertransmis-sion of Eq. (7):
Cij(λc, t )=rij(λc)·exp −τNO2ij(λc, t )−τ∗ij(λc, t )
·
Z
I0v(λ)·G(λ−λc)dλ. (14)
The time-averaged optical thicknessτ (λ, t )can be obtained from the geometric mean of the consecutive images:
N v u u t N Y
k=1
Cij(λc, tk)
=rij(λc)·exp − 1
N
N
X
k=1
τNO2ij(λc, tk)+τ∗ij(λc, tk)
!
·
Z
I0v(λ)·G(λ−λc)dλ.
=rij(λc).exp −τNO2ij(λc, t )−τ∗ij(λc, t )
·
Z
I0v(λ).G(λ−λc)dλ. (15)
Another means of increasing the reliability of the measure-ments is to use different doublets, i.e., pairs ofλwandλs. If
the transmittance is known for several doublets, their prod-uct strengthens the NO2SCD retrieval by providing
informa-tion from multiple spectral regions. If1σNO2=σNO2(λs)− σNO2(λw), then for two doublets we have for the SCD kNO2ij=
1
1σNO(1)
2+1σ
(2) NO2
·ln
T
ij(λw1)·Tij(λw2) Tij(λs1)·Tij(λs2)
. (16)
This approach can potentially attenuate a bias in one of the measurements.
3.4 Error budget and instrument sensitivity
One can work out Eq. (12) with the classical first-order Tay-lor expansion approximation to determine the uncertainty on the NO2 SCD. This approach will require estimates of the
uncertainty on the photon countsCij, on the background
sig-nal C0, on the relative instrument response ρij and on the
cross-section dataσNO2. These estimates are not always
eas-ily obtained, and we briefly discuss each of them.
The photo-electric counting rates Cij are obtained from
Eq. (13):Cij=Sij/t, wheretis the sensor exposure time. It
is reasonable to assume that the camera operator selects ac-quisition settings to ensure that the signal is well into the shot noise regime:σCij =
p
Sij/t. With signals exceeding 104e−
in 1 s (the case in the examples below), the relative uncer-tainty onCij will be below 1 %.
The background signalC0 is estimated by averaging the
pixels looking at the background of the scene. While one would presume that the averaging of a large number of such pixels should yield a very high precision, the accuracy is lim-ited by the difficulty of identifying pixels effectively look-ing at the background. Automated data processlook-ing needs a screening of each image to determine if a pixel is looking at the plume, the background, a cloud or even a bird. This screening is based on the interpretation of the raw signals and, for instance, it sometimes fails to recognize pixels which still have in their FOV the residual NO2molecules left by a
past position of the plume. From our experience, the relative uncertainty onC0determined from a single image is
atively homogeneous images under the assumption that their average is truly flat, then the uncertainty on the flatness par-ticipates to the error budget ofρij(λ)and quickly becomes
the driver (signal shot noise is surpassed). This error source is a generic problem of all imaging systems but remains dif-ficult to quantify. The only certainty is that it drops with the sample size.
The NO2 absorption cross-section data are taken from
Vandaele et al. (1998), who report a total relative uncertainty of 3 % at a resolution of 2 cm−1(0.04 nm at 450 nm). Taking our coarser resolution into account (about 0.6 nm), the uncer-tainty drops to about 0.8 % for the convolved spectrum. How-ever, the AOTF tuning curve is temperature dependent, with a typical drift of+0.1 nm per Kelvin (Ohmachi and Uchida, 1970; Uchida, 1971). The driving electronics is currently not enslaved to a temperature sensor. The exact measurement wavelength is computed at the processing stage. Depend-ing on the amount of wavelength drift, the uncertainty on
σNO2(λ)can reach 5–10 %.
The minimum relative uncertainty on the NO2 SCD will
be reached if the uncertainty on the plume transmittanceT is driven by C0. Assuming σT/T =1 %, and taking into
ac-count a 5 % error on the cross-section term (with a typi-cal value forσNO2(λs)−σNO2(λw)=2×10
−19), one obtains σk=5×10¹⁶molecules cm−2. If one assumes less favorable
conditions like a 1 % uncertainty onρ, yieldingσT/T =2 %
and a 10 % error on the cross section, then the SCD error reaches 1017molecules cm−2.
4 Application to the remote sensing of NO2at a coal-fired power plant
The data of a spectral imager such as the NO2 camera are
more easily exploited if a number of observational require-ments are satisfied. First, the camera must be placed at a lo-cation where both the plume and the background can be cap-tured within the same image. Second, the target plume must remain optically thin in order to preserve the assumption of the Beer–Lambert extinction along a straight light path. Fi-nally, scattered clouds behind the plume will corrupt the re-trieval and should be avoided.
These three requirements were sometimes fulfilled during the second Airborne ROmanian Measurements of Aerosols and Trace gases (AROMAT-2) campaign in August 2015. The campaign aimed at joining the efforts of several
Euro-Figure 4. Observational geometry during the AROMAT-2
cam-paign at Turceni’s power plant. The NO2camera was installed on a football pitch looking at the four 280 m tall stacks. The red lines delimit the camera horizontal FOV (6◦). The direction of the Sun at 16:00 local time is approximately indicated, together with two rays illustrating the scattering behind the scene towards the camera. One of the rays passes through the plume, while the other one passes by. Map data from OpenStreetMap.
pean research institutes and universities to spatially and tem-porally characterize the emissions from two types of sites: a large city (Bucharest) and point sources (large thermal power plants in the Jiu Valley, Romania). Both sites should eventu-ally serve as validation targets for the ESA TROPOMI/S-5P mission.
The NO2 camera was placed at a distance of 2.5 km
from a group of four stacks belonging to Turceni’s power plant, the largest being in Romania (330 MW per turbine, 2000 GWh year−1 total electric power generation of which
more than 93 % is generated from coal). Figure 4 depicts the measurement geometry. Our location was 44.6792◦N, 23.3788◦E, the line of sight (LOS) azimuth angle ranged from 113◦(left edge of the image) to 119◦(right edge) east-ward from north, and the LOS zenith angle ranged between 75.5◦ (top edge) and 81.5◦ (bottom edge). We only report on measurements performed on 24 August between 16:15 and 16:30 LT as the observational conditions were close to ideal and best illustrate the performance of the instrument. In particular, the smokes were optically thin, with the blue sky clearly visible in the background. This ensures that absorp-tion is the dominant process over scattering for the extincabsorp-tion of light rays crossing the plumes (Beer–Lambert regime). The optical thickness of the smokes was always smaller than 0.1 at our measurement wavelengths.
4.1 Exhaust plume NO2SCD field
As explained in Sect. 3.1, the 2-D NO2 SCD field is
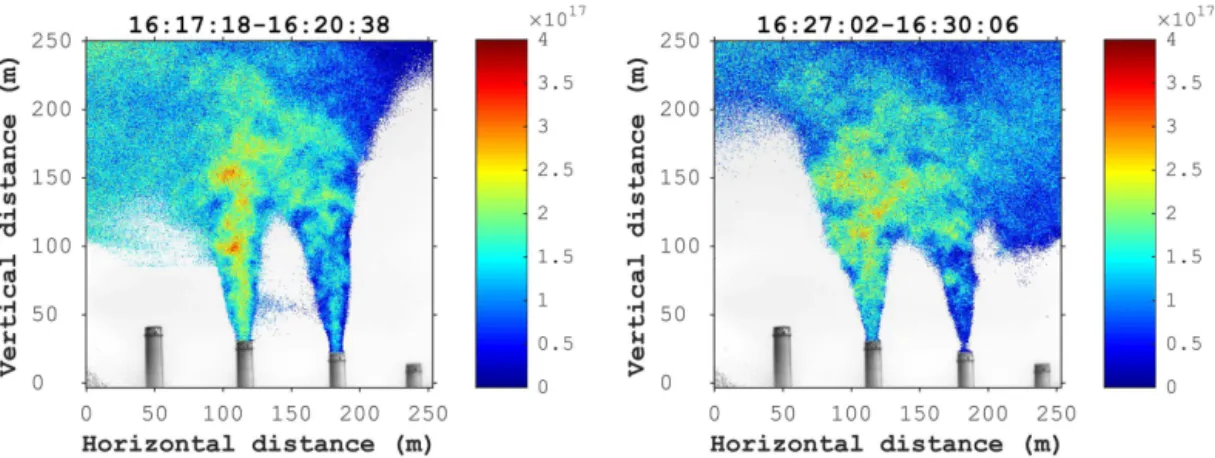
Figure 5.Sample NO2SCD field obtained from the averaging of images acquired atλw2=446.7 nm,λs2=448.1 nm,λw4=465.8 nm and λs4=463.2 nm (12 of each). The color scale shows the plume NO2SCD in molecules cm−2. Thexandyaxes show the image dimensions in the scene plane, while the title gives the time span (local time).
λs3=435.1; λw4=465.8 and λs4=463.2. The automated
acquisition system was in charge of synchronizing the driv-ing of the AOTF with the image acquisition. A nominal ac-quisition sequence started by setting the appropriate acoustic signal for the AOTF to filter atλw1, opening the CCD shutter
for 0.5 s, reading out the image and repeating these opera-tions for the seven other wavelengths. After completion of the nominal sequence, a picture with the AOTF turned off is taken and the nominal sequence is resumed. The dwell time between the closing of the shutter and its reopening was 1.3 s, yielding a total acquisition sequence duration of 13.1 s for the 8 spectral images. In the plane of the stacks, the image foot-print spans an area of 250×250 m2with a 50 cm sampling.
The data analysis revealed that the images from the sec-ond and fourth doublets were the less noisy because of a larger natural radiance and sensor sensitivity compared to the wavelengths of doublets 1 and 3. Also, due to the plume displacement over time (wind) and the presence of moving and changing inhomogeneities across the plume (puffs, tur-bulent eddies), it was necessary to perform time averaging (Sect. 3.3). Indeed, the 1.3 s between two consecutive im-ages is already a long time for features moving at a typical 5 m s−1speed (corresponding to 10 pixels per second).
Figure 5 shows the NO2SCD field retrieved from the
av-eraging of images taken atλw2,λs2,λw4andλs4(12 of each)
using the method described in Sect. 3.3. For each wave-length, the background signal C0was determined from
im-age areas unaffected by the plume. The relative error onC0
is about 0.5 % (estimated from the standard deviationσC0of
the pixels sample yieldingC0). Within this precision, no
vari-ation ofC0across the FOV could be significantly detected.
The reason is the relatively small FOV of the camera (about 6◦) combined with a high Sun at the time of the measure-ments (making the scene illumination quite homogeneous). In Fig. 5, the background grayscale image is the mean im-age at λw4, whereas the pixels where the SCD is computed
were selected based on the criteriumCij< C0−2σC0.
Inves-tigating the random fluctuations observed in various areas of the SCD field, one can estimate the detection limit to about 5×10¹⁶molecules cm−2.
4.2 NO2emission fluxes and synergies with SO2 cameras
The capability of resolving the NO2SCD field with a high
spatial and temporal resolution provides new possibilities for the understanding of the plume chemistry. Coal combus-tion processes yielding the formacombus-tion of nitrogen and sulfur species are well known (Flagan and Seinfeld, 1988), and sev-eral reactive plume models can simulate the transport, for-mation and removal of these species over different scales. These models are generally validated by in situ air sampling at distances of several kilometers downwind (see for instance Chowdhury et al., 2015). Very few experiments attempted to characterize the reactive content of the early plume, where the reactions are still governed by the combustion products (Hewitt, 2001). In most cases, a DOAS scanning system was used (Lee et al., 2014, 2009; Lohberger et al., 2004). The same technique was also used for SO2, but to a lesser
extent since the introduction of filter-based SO2 cameras
(Smekens et al., 2015). Recently, imaging Fourier transform spectroscopy (IFTS) demonstrated capability for the mea-surement of a number of mid-infrared emitting species such as CO2and SO2(Gross et al., 2010). However, NO, but not
NO2, can be retrieved with this technique.
An undisputed advantage of imaging systems with high temporal resolution is their ability to track the displacement of remarkable features from one image to another. We used the complete time series of spectral images (50 sequences of 8 spectral images at a rate of 0.5 Hz) to determine the vertical speed of the plume. This was done by tracking signal features created by local increase or decrease of the NO2
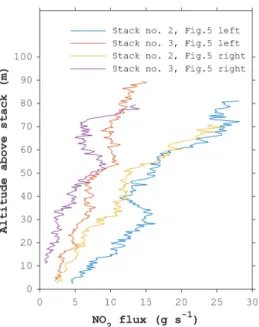
ob-Figure 6.NO2flux computed through the plume horizontal cross section as a function of altitude. Stacks height is 280 m. A sym-metric Gaussian dispersion is assumed up to the region of apparent intersection of the two plumes.
served. Furthermore, assuming a Gaussian dispersion of the plume, one can infer a circular cross section from the ap-parent width of the plume at each detector row (i.e., every 50 cm above the stack outlet). As a result, a profile of emis-sion flux (in g s−1) can be drawn. Figure 6 shows the NO
2
emission flux as a function of altitude up to a height above which the two plumes cannot be discriminated anymore. The fluxes were calculated from the two SCD maps of Fig. 5 and both stacks. The increase is the result of the conversion of NO into NO2 mainly by the reactions 2NO+O2→2NO2
and NO+HO2→NO2+OH (Flagan and Seinfeld, 1988;
Miller and Bowman, 1989), even if these processes are bal-anced by the photodissociation of NO2as soon as it reaches
open air under daylight (NO2+hν→NO+O). Qualitatively,
these results agree well with the increase reported by Lee et al. (2009) in a study of the rate of increase of NO2above
power plant stacks. The analysis of Fig. 6 reveals that within the method approximations, the NO2 concentration in the
plume increases at a rate ranging from 0.75 to 1.25 g s−1 (9.8×10²¹–1.6×10²²molecules s−1) on average for the first
20 s.
The knowledge of the spatial distribution of NO2can also
prove useful to correct measurements marked by interference from NO2. A good example is with SO2cameras where the
SO2SCD field is retrieved by comparing the plume
trans-mittance around 310 and 330 nm. In this range, NO2is also
absorbing and its cross section roughly doubles from 310 to 330 nm. Therefore, if both molecules are present in the plume, the SO2 camera alone cannot distinguish their
re-spective signatures. So far, this interference has been
over-tage of the similar spatial resolution of both instruments, the NO2camera can provide a complete correction map for the
SO2data. On the temporal resolution side, however, the NO2
camera is, at the moment, not capable of following the pace of SO2cameras (1 Hz typical), such that the correction maps
would have to be applied to temporally averaged SO2data.
5 Conclusions
We have described a new passive atmospheric remote sens-ing instrument for the measurement of NO2 SCDs above
strong sources. It is based on an AOTF which offers a suf-ficient acceptance angle to be placed in an imaging system and the necessary resolution for taking advantage of the fine structures of the NO2absorption cross section. The AOTF is
electrically driven, such that fast synchronized acquisitions of spectral images are possible.
The measurement principle is similar to the filter-based SO2camera: SCDs are retrieved from at least two spectral
images taken at wavelengths where absorption by the target molecule is significantly different. Wavelengths are picked in the range 440–470 nm. Thanks to its higher spectral resolu-tion, the AOTF-based NO2camera can perform its
measure-ments within a few nanometers. This makes the sensitivity to aerosols negligibly small.
A mathematical framework for data processing has been developed, and the different sources of error have been ad-dressed. In applications focusing on relatively high spa-tiotemporal resolution, the NO2SCD detection limit is about
5×10¹⁶molecules cm−2. Different measurement geometries offering longer integration times or more stable targets would yield a lower limit.
The NO2 camera was successfully tested during the
AROMAT-2 campaign where measurements of NO2 SCD
fields above the flue gas stacks of a coal-fired power plant were performed with a temporal resolution of 3 min and a spatial sampling of 50 cm (for a complete scene of 250× 250 m2). Values up to 4×10¹⁷molecules cm−2 were
ob-served. The quality of the data allowed us to clearly iden-tify the conversion process from NO to NO2 in the early
plume, providing quantitative information on the plume dy-namic chemistry. In another example of application, the mea-surements were used to show how the knowledge of the high-resolution NO2 field can help to correct SO2 camera data.
a significant bias in the retrieved SO2 SCDs. Other
appli-cations range from emission monitoring to volcanic plume chemistry.
While the concept is mature, a number of improvement directions are still being investigated. The most promising ones are the implementation of a temperature feedback loop to reduce the uncertainty on the filtered wavelength and the replacement of the CCD by a CMOS in order to reduce the cooling needs and increase the temporal resolution of the measurements.
6 Data availability
The data are available upon request to the contact author.
Author contributions. Emmanuel Dekemper developed the NO2 camera measurement principle, led the characterization and the par-ticipation in the AROMAT-2 campaign, and processed the data. Bert Van Opstal and Jurgen Vanhamel developed the acquisition software and the AOTF driving electronics and participated in the campaign. Didier Fussen is at the origin of the instrument concept and supported its development in the frame of the ALTIUS project. The authors declare that they have no conflict of interest.
Acknowledgements. This work was funded under PRODEX contract 4000110400. Participation to the AROMAT-2 campaign was funded under ESA contract 4000113511. The authors would like to thank Alexis Merlaud for inviting them to participate in the AROMAT-2 campaign. Emmanuel Dekemper would like to thank Kerstin Stebel for the interesting discussions on SO2cameras and Vitaly Voloshinov for his support in all AOTF-related matters.
Edited by: F. Prata
Reviewed by: C. Kern and J.-F. Smekens
References
Bluth, G. J. S., Shannon, J. M., Watson, I. M., Prata, A. J., and Realmuto, V. J.: Development of an ultra-violet digital camera for volcanic SO2imaging, J. Volcanol. Geoth. Res., 161, 47–56, doi:10.1016/j.jvolgeores.2006.11.004, 2007.
Chang, I. C.: Noncollinear acousto-optic filter with large angular aperture, Appl. Phys. Lett., 25, 370–372, doi:10.1063/1.1655512, 1974.
Chowdhury, B., Karamchandani, P., Sykes, R., Henn, D., and Knipping, E.: Reactive puff model SCICHEM: Model enhance-ments and performance studies, Atmos. Environ., 117, 242–258, doi:10.1016/j.atmosenv.2015.07.012, 2015.
Dekemper, E., Loodts, N., Van Opstal, B., Maes, J., Vanhellemont, F., Mateshvili, N., Franssens, G., Pieroux, D., Bingen, C., Robert, C., De Vos, L., Aballea, L., and Fussen, D.: Tunable acousto-optic spectral imager for atmospheric composition measurements in the visible spectral domain, Appl. Optics, 51, 6259–6267, doi:10.1364/AO.51.006259, 2012.
Flagan, R. C. and Seinfeld, J. H.: Fundamentals of Air Pollution Engineering, Prentice Hall, Englewood Cliffs, USA, 1988. Fussen, D., Dekemper, E., Errera, Q., Franssens, G., Mateshvili,
N., Pieroux, D., and Vanhellemont, F.: The ALTIUS mission, Atmos. Meas. Tech. Discuss., doi:10.5194/amt-2016-213, in re-view, 2016.
Gross, K. C., Bradley, K. C., and Perram, G. P.: Remote identifi-cation and quantifiidentifi-cation of industrial smokestack effluents via imaging fourier-transform spectroscopy, Environ. Sci. Technol., 44, 9390–9397, doi:10.1021/es101823z, 2010.
Heue, K.-P., Wagner, T., Broccardo, S. P., Walter, D., Piketh, S. J., Ross, K. E., Beirle, S., and Platt, U.: Direct observation of two dimensional trace gas distributions with an airborne Imag-ing DOAS instrument, Atmos. Chem. Phys., 8, 6707–6717, doi:10.5194/acp-8-6707-2008, 2008.
Hewitt, C. N.: The atmospheric chemistry of sulphur and nitro-gen in power station plumes, Atmos. Environ., 35, 1155–1170, doi:10.1016/S1474-8177(02)80012-2, 2001.
Kern, C., Kick, F., Lübcke, P., Vogel, L., Wöhrbach, M., and Platt, U.: Theoretical description of functionality, applications, and limitations of SO2 cameras for the remote sensing of volcanic plumes, Atmos. Meas. Tech., 3, 733–749, doi:10.5194/amt-3-733-2010, 2010.
Lee, H., Kim, Y. J., and Lee, C.: Estimation of the rate of increase in nitrogen dioxide concentrations from power plant stacks us-ing an imagus-ing-DOAS, Environ. Monit. Assess., 152, 61–70, doi:10.1007/s10661-008-0296-4, 2009.
Lee, H., Ryu, J., Jeong, U., Noh, Y., Shin, S. K., Hong, H., and Kwon, S.: Improvement in plume dispersion formulas for stack emissions using ground-based imaging-DOAS data, B. Korean Chem. Soc., 35, 3427–3432, doi:10.5012/bkcs.2014.35.12.3427, 2014.
Lohberger, F., Hönninger, G., and Platt, U.: Ground-based imag-ing differential optical absorption spectroscopy of atmospheric gases, Appl. Optics, 43, 4711–4717, doi:10.1364/AO.43.004711, 2004.
Lübcke, P., Bobrowski, N., Illing, S., Kern, C., Alvarez Nieves, J. M., Vogel, L., Zielcke, J., Delgado Granados, H., and Platt, U.: On the absolute calibration of SO2cameras, Atmos. Meas. Tech., 6, 677–696, doi:10.5194/amt-6-677-2013, 2013.
Miller, J. A. and Bowman, C. T.: Mechanism and modeling of ni-trogen chemistry in combustion, Prog. Energy Combust. Sci., 15, 287–338, doi:10.1016/0360-1285(89)90017-8, 1989.
Mori, T. and Burton, M.: The SO2camera: A simple, fast and cheap method for ground-based imaging of SO2in volcanic plumes, Geophys. Res. Lett., 33, L24804, doi:10.1029/2006GL027916, 2006.
Ohmachi, Y. and Uchida, N.: Temperature Dependence of Elastic, Dielectric, and Piezoelectric Constants in TeO2Single Crystals, J. Appl. Phys., 41, 2307–2311, doi:10.1063/1.1659223, 1970. Platt, U.: Differential Optical Absorption Spectroscopy (DOAS), in:
Air Monitoring By Spectroscopic Techniques, edited by: Sigrist, M. W., John Wiley & Sons, Ltd., New York, USA, 1994. Seinfeld, J. H. and Pandis, S. N.: Atmospheric chemistry and
physics, 2nd edn., Wiley, Hoboken, New Jersey, USA, 2006. Smekens, J.-F., Burton, M. R., and Clarke, A. B.: Validation of