AMTD
3, 863–889, 2010Novel SO2 spectral evaluation scheme
N. Bobrowski et al.
Title Page
Abstract Introduction
Conclusions References
Tables Figures
◭ ◮
◭ ◮
Back Close
Full Screen / Esc
Printer-friendly Version
Interactive Discussion
Atmos. Meas. Tech. Discuss., 3, 863–889, 2010 www.atmos-meas-tech-discuss.net/3/863/2010/ © Author(s) 2010. This work is distributed under the Creative Commons Attribution 3.0 License.
Atmospheric Measurement Techniques Discussions
This discussion paper is/has been under review for the journal Atmospheric Measure-ment Techniques (AMT). Please refer to the corresponding final paper in AMT
if available.
Novel SO
2
spectral evaluation scheme
using the 360–390 nm wavelength range
N. Bobrowski1, C. Kern1, U. Platt1, C. H ¨ormann1,2, and T. Wagner2 1
Institute for Environmental Physics, University of Heidelberg, Germany
2
Max-Planck Institute for Chemistry, Mainz, Germany
Received: 13 January 2010 – Accepted: 22 January 2010 – Published: 3 March 2010 Correspondence to: N. Bobrowski ([email protected])
AMTD
3, 863–889, 2010Novel SO2 spectral evaluation scheme
N. Bobrowski et al.
Title Page
Abstract Introduction
Conclusions References
Tables Figures
◭ ◮
◭ ◮
Back Close
Full Screen / Esc
Printer-friendly Version
Interactive Discussion
Abstract
Differential Optical Absorption Spectroscopy (DOAS) is a well established spectro-scopic method to determine trace gases in the atmosphere. During the last decade, passive DOAS, which uses solar radiation scattered in the atmosphere as a light source, has become a standard tool to determine SO2column densities and emission
5
fluxes from volcanoes and other large sources by ground based as well as satellite measurements. For the determination of SO2column densities, the structured absorp-tion of the molecule in the 300–330 nm region (due to the A1B1←X1A1 transition) is
used. However, there are several problems limiting the accuracy of the technique in this particular application. Here we propose to use an alternative wavelength region
10
(360–390 nm) due to the spin-forbidden a3B2←X1A1transition for the DOAS evaluation
of SO2in conditions where high SO2 column densities prevail. We show this range to
have considerable advantages in such cases, in particular when the particle content of the plume is high and when measurements are performed at large distances from the area of interest.
15
1 Introduction
Developed since the mid-seventies (Noxon, 1975; Perner et al., 1976; Platt et al., 1979), today Differential Optical Absorption Spectroscopy (DOAS) is a well established spectroscopic method to determine trace gases in the atmosphere. DOAS is typically applied in the UV-visible wavelength region and uses the narrow band absorption
fea-20
tures of molecules for their identification; a detailed description can e.g. be found in Platt and Stutz (2008). During the last decade, the passive DOAS technique, which uses solar radiation scattered in the atmosphere as a light source (see e.g. H ¨onninger et al., 2004a; Platt and Stutz, 2008), has become a standard tool to determine SO2
emission fluxes from volcanoes world wide (e.g. Galle et al., 2003, 2010; Horton et
25
AMTD
3, 863–889, 2010Novel SO2 spectral evaluation scheme
N. Bobrowski et al.
Title Page
Abstract Introduction
Conclusions References
Tables Figures
◭ ◮
◭ ◮
Back Close
Full Screen / Esc
Printer-friendly Version
Interactive Discussion
(COSPEC) developed in the 1960ties, (e.g. Millan et al., 1969). Moreover, DOAS of-fers the possibility to analyse for other volcanic gases, like BrO (see e.g. Bobrowski et al., 2003), as well. This was possible due to the technological development of cheaper and smaller spectrometers, sensitive and fast multichannel array detectors, powerful computers, and efficient algorithms for the analysis of differential absorption spectra.
5
The DOAS method is usually applied to weak absorbers with optical densities be-low approximately 0.05. However, when measuring SO2absorption in volcanic plumes and considering the commonly used evaluation range between 300 and 325 nm, optical densities can exceed unity. Such strong absorbers can complicate the DOAS retrieval algorithm when using high resolution reference spectra from literature, which have to
10
be convoluted with the instrumental line-shape of the employed spectrometer. This well known phenomenon (see e.g. Platt and Stutz, 2008) is caused by a non-linearity in the relationship between the measured optical density and the column density occurring at high optical densities when the spectral resolution of the instrument is insufficient to fully resolve the absorption bands, as is usually the case with the compact
spec-15
trometers employed for volcanic surveillance. The problem can be solved by using an iterative approach like the Iterative Maximum A Posteriori DOAS technique (IMAP-DOAS, see Frankenberg et al., 2005 for more detailed information), but such methods require high computation power and are rarely applied today.
A further problem associated with the commonly evaluated wavelength range below
20
330 nm, where the strong absorptions due to the A1B1←X 1
A1 transition of the SO2
molecule are located, is caused by the rather low intensity of scattered sunlight (mostly due to ozone absorption in the stratosphere) and therefore unfavourably high photon shot noise. Additionally for this UV wavelength region where the measured intensities are generally low, compared to the longer wavelength UV also entering the instrument,
25
AMTD
3, 863–889, 2010Novel SO2 spectral evaluation scheme
N. Bobrowski et al.
Title Page
Abstract Introduction
Conclusions References
Tables Figures
◭ ◮
◭ ◮
Back Close
Full Screen / Esc
Printer-friendly Version
Interactive Discussion
Apart from the above mentioned spectroscopic issues, it has only recently been shown that the accuracy of remote sensing techniques measuring volcanic SO2 in the UV-visible wavelength region using scattered solar radiation as a light source is often largely dependent on our knowledge of the radiative transfer in and around the measured volcanic plume (Kern et al., 2009). The results show that this especially
5
applies to situations in which SO2is a strong absorber, as the optical path of incident
radiation is significantly influenced by absorption in the plume in such cases. There are three problems related to radiation transport:
1) Radiation is scattered in the atmosphere both, by air molecules (mostly Rayleigh scattering) and by aerosol particles. While aerosol scattering is only weakly
depen-10
dent on the wavelengthλ(approximately proportional toλ−1.3), Rayleigh scattering is
proportional toλ−4
. This fact leads to a wavelength dependent mean free photon path in the atmosphere. Photons of shorter wavelengths travel significantly shorter mean paths between scattering events than photons of longer wavelengths. Thus, radiation of shorter wavelengths is more likely to be scattered between instrument and plume
15
than radiation of longer wavelengths. This so-called “radiation dilution” effect was first observed in DOAS measurements by Mori et al. (2006), who realized that the SO2 column density (CD) retrieved from measured spectra depended on the wavelength range in which the evaluation took place. Especially for long distances between in-strument and plume (i.e. several km), evaluations at shorter wavelengths yielded lower
20
SO2column densities than those performed at longer wavelengths.
2) Aside from the reduction of the apparent SO2CD due to radiation dilution, multiple
scattering inside the plume can also enhance the SO2CD. Depending on the particular situation (i.e. amount and properties of aerosols in the plume and in the air surrounding the plume), the enhancement of the effective photon path due to multiple scattering
25
can be of the same order of magnitude as the above described dilution. Therefore, the measured CD can be either over- or underestimated in any particular measurement.
AMTD
3, 863–889, 2010Novel SO2 spectral evaluation scheme
N. Bobrowski et al.
Title Page
Abstract Introduction
Conclusions References
Tables Figures
◭ ◮
◭ ◮
Back Close
Full Screen / Esc
Printer-friendly Version
Interactive Discussion
plume can become essentially zero (AMF∼0 leading to a strong underestimation of
the true CD), because at the wavelength where the SO2absorptions are observed the plume is completely dark. In reality, this effect is, however, typically reduced due to the presence of aerosols, and a small fraction of the observed light is scattered by aerosols inside the plume. Then the SO2absorption signal is still weak but not zero.
5
In fact, the effect that not all of the detected radiation has passed through the region of interest in a straight line is a well known issue in optical remote sensing. Typically, the concept of air mass factor (AMF) is used to describe the phenomenon. The AMF gives the ratio of the measured column density to the theoretical column density along a straight line through the region of interest (see Kern et al., 2009 for a more specific
10
definition). Therefore, an AMF of less than unity indicates that the average light path inside the region of interest (in this case the volcanic plume) is shorter than the column along a straight path through the plume.
Here we propose a new approach to the problem using an alternative wavelength region for the DOAS evaluation of SO2, which can have considerable advantages
un-15
der certain conditions, in particular when high SO2 column densities prevail or when
measurements at large distances from the area of interest are necessary.
2 The new approach
In cases of high SO2 column densities, the relatively weak system of absorption lines
corresponding to the spin-forbidden a3B2←X1A1 transition of the SO2 molecule can
20
be used to quantitatively detect this species. Compared to the standard evaluation range of approximately 310 to 325 nm (due to the A1B1←X
1
A1 transition), which has
been used by all hitherto reported UV-spectroscopic SO2measurements, the absorp-tion lines of this system are found in the longer UV wavelength region of about 350 to 390 nm, which can have a number of advantages. In the following we refer to the
25
AMTD
3, 863–889, 2010Novel SO2 spectral evaluation scheme
N. Bobrowski et al.
Title Page
Abstract Introduction
Conclusions References
Tables Figures
◭ ◮
◭ ◮
Back Close
Full Screen / Esc
Printer-friendly Version
Interactive Discussion
magnitude lower in the long wave UV window, therefore the above mentioned problems of non-linearity are avoided. While the weaker absorption cross section also leads to a lower sensitivity for SO2, this effect is in part compensated by a higher light intensity
at longer wavelengths, which leads to considerably better signal/noise ratios. In the fol-lowing, two examples of the SO2evaluation in the proposed long wave UV window of
5
360–390 nm are presented in comparison to an evaluation between 315 and 325 nm. As one example, we discuss a spectrum recorded by a ground based instrument at Mt. Etna Volcano in June 2008, as the other we report satellite measurements of the eruption of Kasatochi volcano in August 2008.
Also a theoretical model study was performed, which investigates the influence of
10
radiation dilution on remote sensing measurements in the proposed long wave UV wavelength region around 375 nm in comparison to the standard range around 320 nm using the backward Monte-Carlo radiative transfer model McArtim (Deutschmann et al., 2008) to simulate the propagation of radiation between the sun and a simulated instrument located on the ground at various distances from the volcanic plume or of the
15
backscattered sun-light to a satellite instrument. The results show that the transition from short wave UV to long wave UV leads to a decrease in the radiation dilution effect, and that the AMF is typically closer to unity for the new retrieval window if the distance between instrument and plume is larger than approximately 1 km. Also in the case of satellite remote sensing, the new proposed fit region prevents underestimation of SO2
20
column densities in cases of high SO2loads.
3 Sample measurements and evaluations in the short wave UV and long wave
UV windows
3.1 Ground based measurement example
For the ground based measurement example, a Miniature MultiAxis-DOAS
(Mini-MAX-25
AMTD
3, 863–889, 2010Novel SO2 spectral evaluation scheme
N. Bobrowski et al.
Title Page
Abstract Introduction
Conclusions References
Tables Figures
◭ ◮
◭ ◮
Back Close
Full Screen / Esc
Printer-friendly Version
Interactive Discussion
et al., 2007; Bobrowski and Platt, 2007) was set up on the North East crater rim of Mt. Etna volcano (Italy) on 10 June 2008. The miniaturised MAX-DOAS system consists of an airtight aluminium box containing a temperature stabilized commercial miniature spectrometer (OceanOptics Inc., USB2000) covering the spectral range from 289 nm to 442 nm, a small telescope (fused silica lens,f=40 mm, d=20 mm, field of
5
view approximately 0.6◦) coupled to the spectrometer by a quartz fibre bundle (4 fibres with 200 µm core diameter), and electronics for temperature regulation and stepper motor control. A geared stepper motor is attached to one side of the box and turns it to point the telescope at different elevation angles between 0 and 150◦. Automatic data acquisition was performed by the DOASIS software package (Kraus et al., 2001)
10
running on a notebook computer. The distance to the volcanic plume was about 100 m. The plume visually had a white appearance, probably caused by the large amount of condensation of emitted water vapour. Aside from the plume, a cloudless sky was observed.
The wavelength to pixel mapping (WPM) as well as the instrumental line shape
(in-15
strument function) were determined by taking a spectrum of a low-pressure mercury emission lamp. By using the known mercury spectral line positions, a second order polynomial describing the WPM was calculated. The WPM was later adjusted using the Fraunhofer structure of the measured spectra compared to a literature solar emis-sion spectrum (Kurucz et al., 1984).
20
The software WinDoas V2.10 from IASB (Belgium Institute for Space Aeronomy, Fayt and Van Roozendael, 2001) was used to derive the slant column densities (SCD) of SO2 from the recorded spectra using a standard DOAS fit. A background spectrum recorded shortly after each plume measurement was taken as a Fraunhofer reference spectrum (FRS) to remove the Fraunhofer lines. Care was taken to avoid absorption
25
AMTD
3, 863–889, 2010Novel SO2 spectral evaluation scheme
N. Bobrowski et al.
Title Page
Abstract Introduction
Conclusions References
Tables Figures
◭ ◮
◭ ◮
Back Close
Full Screen / Esc
Printer-friendly Version
Interactive Discussion
compensate for the effect of Raman scattering in the atmosphere (Bussemer, 1993). SO2was first analyzed in the typical short wave UV region of 315 to 325 nm. Apart from the SO2 reference spectrum (Bogumil et al., 2003 – 293 K), two O3 reference
spectra measured at 223 and 246 K (Voigt et al., 2001), a Ring spectrum (to remove artefacts caused by inelastic scattering in the atmosphere, Ring effect, see
Busse-5
mer 1993) and the Fraunhofer reference spectrum were included in the fitting process. A 3rd order polynomial was applied to remove broad-band structures, and a shift and 1st order squeeze were allowed for the measured spectra to compensate possible wavelength calibration errors.
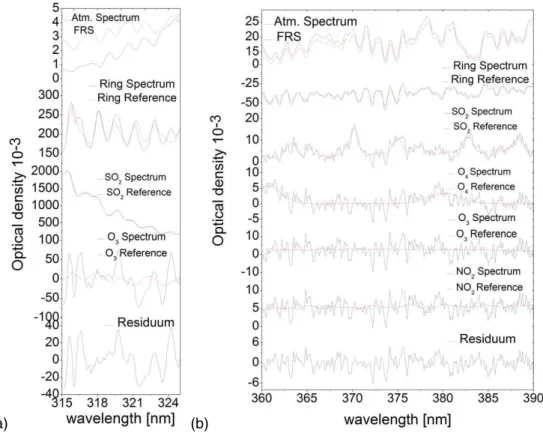
A sample evaluation result is shown in Fig. 1a. The SO2absorption features are
eas-10
ily detectable, but several unexplained structures remain in the residual spectrum, with fairly high amplitudes (2.7×10⁻²RMS) and features that do not appear to be randomly
distributed (as would be expected of pure noise). Also, the Ring spectrum is not very well captured by the fit and might be one of the main causes for the high residual struc-tures. The slant column density of SO2was determined to (1.6±0.1)×10
19
molec/cm2.
15
In a second step, SO2 was evaluated in the long wave UV window between 360
and 390 nm, where 5 weak absorption bands are located. As in the short wave UV evaluation besides SO2 and two O3 reference spectra taken from the same source
and for the same temperatures as above, an O4 reference spectrum (Herman et al.,
1999), NO2at 246 K (Voigt et al., 2002), a Ring spectrum, and a Fraunhofer reference
20
spectrum was included in the DOAS fit. Again, a 3rd order polynomial was applied to remove any broad-band structures, and a shift and 1st order squeeze were allowed for the measured spectra.
The DOAS evaluation results obtained in the long wave UV window for the same spectrum as evaluated before are shown in Fig. 1b. SO2 could also be clearly
identi-25
fied in this wavelength region, and in this case (3.2±0.4)×1019molec/cm2were found.
AMTD
3, 863–889, 2010Novel SO2 spectral evaluation scheme
N. Bobrowski et al.
Title Page
Abstract Introduction
Conclusions References
Tables Figures
◭ ◮
◭ ◮
Back Close
Full Screen / Esc
Printer-friendly Version
Interactive Discussion
and the features appear to be of random nature. The causes for the lower amplitude of the fit residual are (1) elimination of non-linear effects caused by high optical densities (see Frankenberg et al., 2005); (2) reduced influence of spectrometer stray light in this well illuminated region of the detector; (3) the absence of a wavelength dependent air mass factor (see “Model Studies”), and (4) the lower photon noise in the long wave UV
5
window due to more incident radiation (see below).
3.2 Satellite measurement example
As a second example we present the evaluation of satellite data from an overpass of the GOME-2 instrument after the eruption of the Kasatochi volcano (Aleutian Islands) on the 8 August 2008. The GOME-2 (Global Ozone Monitoring Experiment-2) on board
10
of the MetOp satellite is the first of a series of three identical instruments. MetOp-A was launched into a sun synchronous polar orbit at 800 km altitude in October 2006. The satellite crosses the equator at 09:30 LT. GOME-2 is a 4 channel UV/Vis grating spectrometer observing the Earth’s atmosphere in nadir viewing geometry (including up to±50◦ difference to nadir). It measures both the radiance component of the light
15
reflected by the Sun-illuminated Earth’s atmosphere and the direct Sun light, covering the wavelength region of 240–790 nm at moderate spectral resolution of 0.2–0.4 nm. With a pixel size of 80×40 km (240×40 km for the back scan), GOME-2 observes about
4 times smaller ground pixels than its predecessor GOME on ERS-2. By scanning the earth surface with a scan-width of 1920 km, global coverage can be achieved within
20
1.5 days (EUMETSAT, 2005).
As in the first example, WinDoas V2.10 was used to derive the SO2 SCD from the
recorded spectra using a DOAS fit (spectral range 360–390 nm). For the Fraunhofer reference spectrum, the Sun Mean Reference Spectrum (SMR) of GOME-2 for that day was taken (containing no atmospheric absorptions) and again a “Ring” spectrum
25
AMTD
3, 863–889, 2010Novel SO2 spectral evaluation scheme
N. Bobrowski et al.
Title Page
Abstract Introduction
Conclusions References
Tables Figures
◭ ◮
◭ ◮
Back Close
Full Screen / Esc
Printer-friendly Version
Interactive Discussion
312.1–324 nm. Besides the SO2reference spectrum (Bogumil et al., 2003 – 293 K), an O3cross section (221 K, see G ¨ur et al., 2005), the SMR, the Ring spectrum (calculated
from the SMR) and an inverse SMR spectrum were included into the fitting process (the inverse SMR spectrum should compensate the effect of possible spectrograph straylight). Since the atmospheric light paths within the selected fitting window change
5
systematically with wavelength (e.g. Van Roozendael et al., 2006), not only the original ozone absorption cross section but also a second one (the original cross section scaled with a fourth order polynomial in wavelength) was included in the fitting algorithm. It should be noted that, in principle, additional ozone absorption cross sections for other temperatures might be included into the fit. However, for the selected case study, no
10
significant change of the retrieved SO2results and the magnitude of the residual were found if additional temperatures were considered. A 5th order polynomial was applied to remove the broad-band structures and a slight wavelength shift was allowed for the measured spectra.
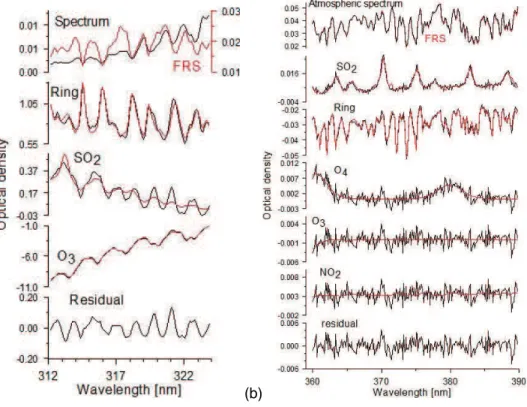
In Fig. 2a, the short wave UV fit results for the evaluation of one of the recorded
15
spectra including the Kasatochi SO2plume are shown. The SO2signal can be clearly
identified with a determined slant column density of (2.2±0.3)×1018molec/cm2. As
in the ground-based example, the residual (5×10⁻²RMS) shows unexplained
system-atic structures that are caused by the fact that the SO2 AMF depends strongly on
wavelength. Thus, the SO2absorption structures can not be well described by simply
20
including a single SO2cross section in such cases.
The long wave UV SO2evaluation of the satellite data included, besides the above
mentioned reference spectra for the short wave UV range, reference spectra for O4 (Burkholder et al., 1990 – 298 K) and NO2(Vandaele, 1997 – 294 K). Again a spectral
shift for the measured spectra was allowed to correct for possibly occurring
instrumen-25
tal changes.
The results for the long wave UV evaluation can be seen in Fig. 2 (left panel), showing a significantly higher SO2slant column density of (4.7±0.1)×10
19
AMTD
3, 863–889, 2010Novel SO2 spectral evaluation scheme
N. Bobrowski et al.
Title Page
Abstract Introduction
Conclusions References
Tables Figures
◭ ◮
◭ ◮
Back Close
Full Screen / Esc
Printer-friendly Version
Interactive Discussion
now quite random looking residual structures are up to 50 times smaller than those obtained in when the short wave fit range (2×10⁻³RMS).
The spatial distribution of the SO2 plume on 8 August for the different evaluation
ranges is presented in Fig. 3a–c. In Fig. 3a the plume can be clearly identified by the significantly enhanced SO2SCD values obtained in the short wave UV evaluation. For
5
the long wave UV fit region, the plume can also be clearly identified in Fig. 3b (notice the SCD values are about a factor of 20 higher), however showing in principle the same shape. However, some interesting discrepancies remain. While the highest SO2 columns are measured in the north-east and south-west regions of the plume when using the short wave UV window, the maximum SO2column is found in the south-east
10
when using the long wave UV range. As we show in the section “Model Studies”, this is likely a result of a decreased sensitivity for high SO2columns that occurs in short wave
UV when SO2 absorption becomes so strong that radiation can no longer penetrate
the volcanic plume (see Fig. 6). In order to illustrate the advantages of the long wave UV evaluation more clearly, the fit results for the previous used short wave region are
15
shown in Fig. 3c on the same scale as used for the long wave results.
4 Discussion
The absolute SO2cross section (Fig. 4a) in the longer wavelength region is about three
orders of magnitude smaller than in the commonly used shorter wavelength range. Nevertheless, SO2 shows a characteristic high frequency structure in both regions,
20
and the narrow band (differential) absorption features used for the DOAS evaluation are only about two orders of magnitude smaller in the long wave UV window (see Fig. 4b, c).
The disadvantage with regard to sensitivity and detection limit that this weaker sys-tem of absorption lines brings with it are largely compensated by a significantly
bet-25
AMTD
3, 863–889, 2010Novel SO2 spectral evaluation scheme
N. Bobrowski et al.
Title Page
Abstract Introduction
Conclusions References
Tables Figures
◭ ◮
◭ ◮
Back Close
Full Screen / Esc
Printer-friendly Version
Interactive Discussion
of magnitude higher in the long wave UV region than in the short wave UV window. As the noise of a DOAS measurement is typically dominated by photon noise (the magnitude of which is proportional to the square root of the measured intensity), mea-surements in the long wave UV window provide a 3 times better signal to noise ratio from photoelectron statistics for a given measurement integration time. Another factor
5
of two is gained by using a wider wavelength region for the long wave UV wavelength evaluation, which adds another factor of 1.4 to the signal to noise ratio. Moreover, the quantum efficiency of typical compact spectrometer detectors is better in the long wave UV and, due to reduced distortion of the band shape (see discussion above), the amplitude of the residuum is lower in the long wave UV range.
10
In summary, the overall loss in sensitivity when switching to the longer wavelength window (long wave UV) can be estimated at about an order of magnitude. While this may seem high, a considerable fraction of volcanic SO2emissions measurements are
conducted under conditions in which the lower sensitivity is not an issue, and the po-tentially improved accuracy of evaluations in the long wave UV region is arguably more
15
important.
5 Model studies
5.1 Ground based geometry
A model study was conducted to investigate the influence of radiation transport on ground-based remote sensing measurements performed in the long wave UV
wave-20
length region around 375 nm in comparison to the standard short wave UV range around 320 nm. In this study, the backward Monte-Carlo radiative transfer model McArtim (Deutschmann et al., 2008) was used to simulate the propagation of radi-ation between the sun and a simulated instrument located on the ground at various distances from the centre of a volcanic plume.
AMTD
3, 863–889, 2010Novel SO2 spectral evaluation scheme
N. Bobrowski et al.
Title Page
Abstract Introduction
Conclusions References
Tables Figures
◭ ◮
◭ ◮
Back Close
Full Screen / Esc
Printer-friendly Version
Interactive Discussion
The geometry of the model run corresponds to the measurements at Mt. Etna on 10 June 2008. A volcanic plume with a 450 m diameter circular cross section was simulated 250 m above the ground, the DOAS instrument, was located 350 m from the plume center and looked towards the plume axis. While the plume contained SO2
and aerosols, an aerosol-free ambient atmosphere was assumed, an assumption that
5
is justified by the observed clear sky conditions above and around the plume on the date of the measurement (see Sect. 3.1). The model atmosphere exhibited a typical stratospheric ozone profile to account for the influence of ozone on radiative transfer in the upper atmosphere.
Using the radiative transfer model as a forward model for the measurement results,
10
an iterative problem inversion was performed in which the SO2 concentration and the aerosol extinction coefficient inside the simulated plume were varied until the modelled spectral intensity, when divided by the modelled spectral intensity in a viewing direction outside the plume and after applying the logarithm, matched the measured optical den-sity. The details of this procedure are subject of a separate manuscript in preparation.
15
The best fit, both, to the measured spectrum between 306 and 324 nm as well as to the measured column density at 375 nm was achieved for a plume SO2concentration of 4.1×10¹¹molec/cm3, which corresponds to a straight column of 1.85×10¹⁹molec/cm2
and an aerosol extinction coefficient of approximately 80 km−1. Therefore, these values are assumed to be the best estimate for the true conditions inside the volcanic plume.
20
However, a standard DOAS evaluation will not necessarily give these values. As described by Kern et al. (2009), a na¨ıve DOAS approach can yield considerable errors, especially if the measurements are conducted at a large distance from the plume or if the plume contains a high aerosol load. As an aerosol extinction coefficient of 80 km−1
corresponds to an approximate visibility of only 50 m, a value that is not unrealistic
25
AMTD
3, 863–889, 2010Novel SO2 spectral evaluation scheme
N. Bobrowski et al.
Title Page
Abstract Introduction
Conclusions References
Tables Figures
◭ ◮
◭ ◮
Back Close
Full Screen / Esc
Printer-friendly Version
Interactive Discussion
The question which of the two evaluation ranges generally gives the better results cannot be answered without taking into account the distance to the plume. In the example measurement at Mt. Etna, the instrument was located next to the active crater and therefore the distance to the plume was exceptionally small (assumed to be 350 m in the model run). In this case, the short wave UV seems to give the better result,
5
as the retrieved CD of 1.6×10¹⁹molec/cm2 is closer to the radiative transfer model
inversion result of 1.85×10¹⁹molec/cm2 than the 3.2×10¹⁹molec/cm2 obtained in the
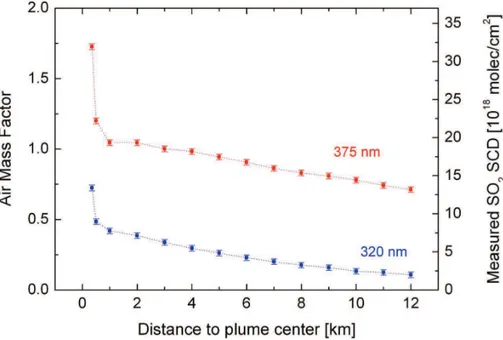
long wave UV range. However, this situation changes rapidly if the measurements are conducted farther away from the plume. Figure 5 shows the simulated air mass factor (AMF) for a measurement of the above described plume as a function of distance
10
between instrument and plume. Both 320 and 375 nm are shown, it should however be noted that the simulations performed at 320 nm are not necessarily indicative of the radiative transfer in the entire region between 300 and 330 nm, as the AMF is strongly dependent on wavelength in this region (see Kern et al., 2009).
The first data points shown in Fig. 5 are the results of model runs conducted for the
15
exact geometry used for the radiative transfer inversion, i.e. the distance to the plume center was 350 m. In this geometry, the long wave UV range yields an AMF of almost 1.75, thus indicating a light path extension by 75% inside the plume due to multiple scattering. At 320 nm, the light path is also enhanced by multiple scattering, but the strong SO2 absorption leads to an AMF of about 0.75. For this geometry, a standard
20
DOAS retrieval in the short wave UV range is therefore expected to slightly underes-timate the true straight CD, while a retrieval in the long wave UV will overesunderes-timate the CD by 75%.
However, as the instrument is moved farther from the plume in the simulation, the AMF rapidly decreases in both cases, an effect that is caused by radiation entering the
25
AMTD
3, 863–889, 2010Novel SO2 spectral evaluation scheme
N. Bobrowski et al.
Title Page
Abstract Introduction
Conclusions References
Tables Figures
◭ ◮
◭ ◮
Back Close
Full Screen / Esc
Printer-friendly Version
Interactive Discussion
of distances from the plume.
The results of this model study show that the novel evaluation range is better suited for DOAS measurements of SO2in volcanic plumes with high SO2 and aerosol loads
when the instruments are located at distances larger than approximately 1 km from the plume. While the exact AMF of such measurements will depend on the conditions
5
inside the plume as well as the aerosol load in the ambient atmosphere, the described example shows that the dilution effect is considerably less prominent for the long wave UV evaluation region than for wavelengths around 315 nm.
5.2 Satellite geometry
The GOME-2 observations of the Kasatochi eruption were also simulated using the full
10
spherical Monte Carlo radiative transfer model McArtim (Deutschmann et al., 2008). To simplify the simulations, fixed values for the viewing geometry were assumed (SZA: 50◦, viewing angle: −90◦). The layer of enhanced SO2 concentrations was assumed
to be between 10 and 11 km (constant SO2concentration within this layer). Below the
SO2 layer, a cloud layer extending from 5 to 6 km (OD: 20, single scattering albedo:
15
1, asymmetry parameter: 0.85) was included in the simulations. Two basic model runs were performed: the first one without aerosols and the second including aerosols within the SO2 layer (aerosol optical depth: 3, asymmetry parameter: 0.68, single scattering albedo: 0.9). For both runs the SO2 concentration was varied from zero
to 5×10¹⁴molec/cm3, and the corresponding SO2 SCDs were calculated for both of
20
the regarded wavelengths (315 and 375 nm).
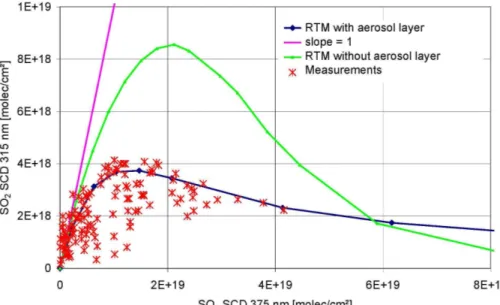
The results are presented in Fig. 6, where the modelled SO2 SCDs for 315 nm
are plotted versus those at 375 nm. In addition to the modelled SO2 SCDs also the
measurements for 8 August 2008 are included in the figure. In both model runs a linear relationship between the SO2 SCDs for both wavelengths is only found for
25
rather small SO2 concentrations (about<1×10 13
AMTD
3, 863–889, 2010Novel SO2 spectral evaluation scheme
N. Bobrowski et al.
Title Page
Abstract Introduction
Conclusions References
Tables Figures
◭ ◮
◭ ◮
Back Close
Full Screen / Esc
Printer-friendly Version
Interactive Discussion
much slower compared to those for 375 nm, and eventually they even decrease if the SO2concentration is further increased. This is a result of the very strong light absorp-tion caused by SO2inside the volcanic plume. If aerosols are present, this effect is less
pronounced (and for very high SO2 concentrations even higher SO2SCDs for 315 nm
are found compared to the non-aerosol case), because more light is scattered back
5
by the aerosol particles to the satellite instrument from the layer of enhanced SO2.
The comparison with the measured SO2SCDs clearly indicates that it is not possible
to describe the satellite observations from 8 August 2008 without aerosols present in the volcanic plume. Good agreement for the upper bound of measured SO2SCDs for
315 nm is found for an assumed aerosol optical depth of about 3. The scatter of the
10
measured data indicates that the aerosol load was different (and mostly higher than 3) in different parts of the observed plume.
6 Conclusions
An alternative evaluation range for the DOAS retrieval of SO2 was proposed. It was shown that using the long wave UV window of 360–390 nm has a number of
advan-15
tages in situations in which high SO2column densities are encountered. In particular,
problems with non-linearity in the DOAS evaluation, stray light in the spectrometer, and signal dilution by scattering could be avoided or at least significantly reduced.
Although the absolute SO2 absorption cross section in the long wave UV range is
about three orders of magnitude smaller than around 320 nm, the high frequency
(dif-20
ferential) absorption features are only about two orders of magnitude smaller. Because the intensity of incident solar radiation on the ground is about an order of magnitude higher in the long wave UV region, the smaller sensitivity towards SO2can in part be compensated by a lower photon noise level (about a factor of 4.2). However, since the quality of volcanic SO2measurements using the DOAS technique are rarely limited
25
AMTD
3, 863–889, 2010Novel SO2 spectral evaluation scheme
N. Bobrowski et al.
Title Page
Abstract Introduction
Conclusions References
Tables Figures
◭ ◮
◭ ◮
Back Close
Full Screen / Esc
Printer-friendly Version
Interactive Discussion
A model study conducted to investigate radiative transfer showed that DOAS evalua-tions in the long wave UV region will give more accurate results in situaevalua-tions where high plume SO2 loads and long distances between the instrument and the volcanic plume
prevail. This is especially true for satellite measurements. The novel evaluation win-dow is less susceptible to radiation dilution and wavelength dependent air mass factors
5
(and column densities). In the ground-based measurement described above, the SO2
column density was overestimated by the retrieval in the long wave UV region, but this effect was ascribed to the close proximity of the volcanic plume. In typical measure-ment geometries in which the plume is located some kilometres from the instrumeasure-ment, the short wave UV region will usually yield AMFs significantly below unity, while the
10
novel evaluation range yields AMFs much closer to one.
The results from the satellite data evaluation example using GOME-2 data empha-sizes the advantages of the long wave UV fit range in cases of high SO2column
densi-ties. In particular, the radiative transfer study showed that evaluation in the short wave UV region can lead to a strong underestimation of the retrieved SO2column densities
15
due to the strongly reduced probability that the observed scattered light has pene-trated the plume. Interestingly, for cases of very strong SO2 absorption, the presence of aerosols within the plume leads to a slight increase of the sensitivity. By assuming an aerosol optical depth of 3 in the radiative transfer simulations the model results are in good agreement with the upper bound of measured SO2 SCDs for the short wave
20
UV region.
The most accurate DOAS SO2measurements in volcanic plumes can be obtained by
fully taking into account the radiative transfer in each performed measurement. Modern radiative transfer models can be used to invert the measurement conditions (including SO2 concentration and aerosol extinction coefficient). However, the complexity of this
25
AMTD
3, 863–889, 2010Novel SO2 spectral evaluation scheme
N. Bobrowski et al.
Title Page
Abstract Introduction
Conclusions References
Tables Figures
◭ ◮
◭ ◮
Back Close
Full Screen / Esc
Printer-friendly Version
Interactive Discussion
spectral region to constrain the radiative transfer calculation in situations where this is possible will greatly improve the retrieval accuracy.
Finally, the implications of this study go beyond the measurement of SO2in volcanic
plumes alone. While somewhat less sensitive, the novel evaluation range can also be applied to data evaluations of industrial plume measurements or urban pollution
5
in general. The long wave UV range could be could, for example, also be applied to satellite data over highly polluted regions like China.
In summary, the proposed long wave UV retrieval range not only represents an ad-ditional, independent retrieval technique that can be used to validate measurements evaluated in the short wave UV, it also gives additional information which, if interpreted
10
correctly, can further increase our understanding of radiative transfer in and around volcanic plumes.
References
Bobrowski, N., H ¨onninger, G., Galle, B., and Platt, U.: Detection of bromine monoxide in a vol-canic plume, Nature, 423, 273–276, 2003.
15
Bobrowski, N. and Platt, U.: SO2/BrO ratios studied in five volcanic plumes, J. Volcanol. Geoth. Res., 166, 147–160, 2007.
Bobrowski, N., von Glasow, R., Aiuppa, A., Inguaggiato, S., Louban, I., Ibrahim, O. W., and Platt, U.: Reactive halogen chemistry in volcanic plumes, J. Geophys. Res., 112, D06311, doi:10.1029/2006JD007206, 2007.
20
Bogumil, K., Orphal, J., Homann, T., Voigt, S., Spietz, P., Fleischmann, O. P., Vogel, A., Hart-mann, M., BovensHart-mann, H., Frerik, J., and Burrows, J. P.: Measurements of molecular absorption spectra with the SCIAMACHY preflight model: instrument characterization and reference data for atmospheric remote-sensing in the 230–2380 nm region, J. Photoch. Pho-tobio. A, 157, 167–184, 2003.
25
Bussemer, M.: Der Ring-Effekt: Ursachen und Einfluß auf die spektroskopische Messung stratosph ¨arischer Spurenstoffe, Diploma Thesis in Physics, University of Heidelberg, 1993. Deutschmann, T.: Atmospheric radiative transfer modelling with Monte Carlo methods, Diploma
AMTD
3, 863–889, 2010Novel SO2 spectral evaluation scheme
N. Bobrowski et al.
Title Page
Abstract Introduction
Conclusions References
Tables Figures
◭ ◮
◭ ◮
Back Close
Full Screen / Esc
Printer-friendly Version
Interactive Discussion
EUMETSAT: GOME-2 Products Guide, http://oiswww.eumetsat.org/WEBOPS/eps-pg/ GOME-2/GOME2-PG-0TOC.htm, 2005.
Fayt, C. and Roozendael, M. V.: WinDOAS 2.1. Software User Manuel, 2001.
Frankenberg, C., Platt, U., and Wagner, T.: Iterative maximum a posteriori (IMAP)-DOAS for retrieval of strongly absorbing trace gases: Model studies for CH4 and CO2 retrieval from 5
near infrared spectra of SCIAMACHY onboard ENVISAT, Atmos. Chem. Phys., 5, 9–22, 2005, http://www.atmos-chem-phys.net/5/9/2005/.
Galle, B., Oppenheimer, C., Geyer, A., McGonigle, A., Edmonds, M., and Horrocks, L.: A minia-turised ultraviolet spectrometer for remote sensing of SO2 fluxes: a new tool for volcano surveillance, J. Volcanol. Geoth. Res., 119, 214–254, 2003.
10
Galle, B., Johansson, M., Rivera, C., Zhang, Y., Kihlman, M., Kern, C., Lehmann, T., Platt, U., Arellano, S., and Hidalgo, S.: Network for Observation of Volcanic and Atmospheric Change: A global network for volcanic gas monitoring, network layout and instrument description, J. Geophys. Res., doi:10.1029/2009JD011823, in press, 2010.
G ¨ur, B., Spietz, P., Orphal, J., and Burrows, J.: Absorption Spectra Measurements with the 15
GOME-2 FMs using the IUP/IFE-UB’s Calibration Apparatus for Trace Gas Absorption Spec-troscopy CATGAS, Final Report, IUP University of Bremen, October 2005, 2005.
Hermans, C., Vandaele, A. C., Carleer, M., Fally, S., Colin, R., Jenouvrier, A., Coquart, B., and Merienne, M.-F.: Absorption cross-sections of atmospheric constituents: NO2, O2, and H2O, Environ. Sci. Pollut. R., 6(3), 151–158, 1999.
20
H ¨onninger, G., von Friedeburg, C., and Platt, U.: Multi axis differential optical absorption spec-troscopy (MAX-DOAS), Atmos. Chem. Phys., 4, 231–254, 2004a,
http://www.atmos-chem-phys.net/4/231/2004/.
H ¨onninger, G., Bobrowski, N., Palenque, E., Torrez, R., and Platt, U.: Reactive bromine and sulfur emissions at Salar de Uyuni, Bolivia, Geophys. Res. Lett., 31, L04101, 25
doi:10.1029/2003GL018818, 2004b.
Horton, K. A., Williams-Jones, G., Garbeil, H., Elias, T., Sutton, A. J., Mouginis-Mark, P., Porter, J. N., and Clegg, S.: Real-time measurement of volcanic SO2 emissions: vali-dation of a new UV correlation spectrometer (FLYSPEC), Bull. Volcanol., 68, 323–327, doi:10.1007/s00445-005-3880014-9, 2006.
30
AMTD
3, 863–889, 2010Novel SO2 spectral evaluation scheme
N. Bobrowski et al.
Title Page
Abstract Introduction
Conclusions References
Tables Figures
◭ ◮
◭ ◮
Back Close
Full Screen / Esc
Printer-friendly Version
Interactive Discussion
Kraus, S.: The DOASIS software, Chapter Presentation at the 1st international DOAS Work-shop, Heidelberg, 2001.
Kromminga, H., Orphal, J., Spietz, P., Voigt, S., and Burrows, J. P.: New measurements of OClO absorption cross sections in the 325–435 nm and their temperature dependence between 213–293 K, J. Photoch. Photobio. A, 157, 149–160, 2003.
5
Kurucz, R. L., Furenlid, I., Brault, J., and Testerman, L.: Solar flux atlas from 296 to 1300 nm, National Solar Observatory, Sunspot, New Mexico, 240 pp., 1984.
McGonigle, A. J. S.: Measurement of volcanic SO2 fluxes with differential optical absorption spectroscopy, J. Volcanol. Geoth. Res., 162, 111–122, doi:10.1016/j.jvolgeores.2007.02.001, 2007.
10
Millan, M., Townsend, S., and Davies, J.: Study of the Barringer refractor plate correlation spectrometer as a remote sensing instrument. Utias rpt. 146, M. Sc. thesis, University of Toronto, Toronto, Ontario, Canada, 1969.
Mori, T., Mori, T., Kazahaya, K., Ohwada, M., Hirabayashi, J., and Yoshikawa, S.: Effect of UV scattering on SO2emission rate measurements, Geophys. Res. Lett., 33, L17315, doi: 15
10.1029/2006GL026285, 2006.
Noxon, J. F.: Nitrogen dioxide in the stratosphere and troposphere measured by ground-based absorption spectroscopy, Science, 189, 547–549, 1979.
Platt, U., Perner, D., and P ¨atz, H.: Simultaneous measurements of atmospheric CH2O, O3and NO2by differential optical absorption, J. Geophys. Res., 84, 6329–6335, 1979.
20
Platt, U. and Stutz, J.: Differential Optical Absorption spectroscopy, Principles and Applications, Springer, XV, Physics of Earth and Space Environments, 597 pp., 272 illustrations, 29 in color, ISBN 978-3-540-21193-8, 2008.
Van Roozendael, M., Loyola, D., Spurr, R., Balis, D., Lambert, J.-C., Livschitz, Y., Valks, P., Ruppert, T., Kenter, P., Fayt, C., and Zehner, C.: Ten years of GOME/ERS-2 total ozone data 25
– the new GOME data processor (GDP) version 4: 1. Algorithm description, J. Geophys. Res., 111, D14311, doi:10.1029/2005JD006375, 2006.
Van Roozendael, M., Pinardi, G., Hermans, C., Fayt, C., and Merlaud, A.: MiniDOAS calibration issues, 2nd NOVAC retrieval workshop, Gothenburg, Sweden, 19 December, 2006.
Voigt, S., Orphal, J., Bogumil, K., and Burrows, J. P.: The temperature dependence (203– 30
AMTD
3, 863–889, 2010Novel SO2 spectral evaluation scheme
N. Bobrowski et al.
Title Page
Abstract Introduction
Conclusions References
Tables Figures
◭ ◮
◭ ◮
Back Close
Full Screen / Esc
Printer-friendly Version
Interactive Discussion
Voigt, S., Orphal, J., and Burrows, J. P.: The temperature and pressure dependence of the absorption cross sections of NO2in the 250–800 nm region measured by Fourier-transform spectroscopy, J. Photoch. Photobio. A, 143, 1–9, 2002.
Wagner, T., Burrows, J. P., Deutschmann, T., Dix, B., von Friedeburg, C., Frie, U., Hendrick, F., Heue, K.-P., Irie, H., Iwabuchi, H., Kanaya, Y., Keller, J., McLinden, C. A., Oetjen, H., 5
Palazzi, E., Petritoli, A., Platt, U., Postylyakov, O., Pukite, J., Richter, A., van Roozendael, M., Rozanov, A., Rozanov, V., Sinreich, R., Sanghavi, S., and Wittrock, F.: Comparison of box-air-mass-factors and radiances for Multiple-Axis Differential Optical Absorption Spectroscopy (MAX-DOAS) geometries calculated from different UV/visible radiative transfer models, At-mos. Chem. Phys., 7, 1809–1833, 2007,
10
http://www.atmos-chem-phys.net/7/1809/2007/.
Wagner, T., Beirle, S., and Deutschmann, T.: Three-dimensional simulation of the Ring effect in observations of scattered sun light using Monte Carlo radiative transfer models, Atmos. Meas. Tech., 2, 113–124, 2009,
http://www.atmos-meas-tech.net/2/113/2009/. 15
Wilmouth, D. M., Hanisco, T. F., Donahue, N. M., and Anderson, J. G.: Fourier transform ultra-violet spectroscopy of the A2Π3/2XΠ3/2transition of BrO, J. Phys. Chem., 103, 8935–8945,
AMTD
3, 863–889, 2010Novel SO2 spectral evaluation scheme
N. Bobrowski et al.
Title Page
Abstract Introduction
Conclusions References
Tables Figures
◭ ◮
◭ ◮
Back Close
Full Screen / Esc
Printer-friendly Version
Interactive Discussion
(a) (b)
Fig. 1. Example of the DOAS SO2-fit. Solid lines: measured spectra, dotted lines: refer-ence spectra, the atmospheric spectrum was taken inside the volcanic cloud of Etna (α=9◦) on
AMTD
3, 863–889, 2010Novel SO2 spectral evaluation scheme
N. Bobrowski et al.
Title Page
Abstract Introduction
Conclusions References
Tables Figures
◭ ◮
◭ ◮
Back Close
Full Screen / Esc
Printer-friendly Version
Interactive Discussion
(a) (b)
AMTD
3, 863–889, 2010Novel SO2 spectral evaluation scheme
N. Bobrowski et al.
Title Page
Abstract Introduction
Conclusions References
Tables Figures
◭ ◮
◭ ◮
Back Close
Full Screen / Esc
Printer-friendly Version
Interactive Discussion
(a) (b)
(c)
AMTD
3, 863–889, 2010Novel SO2 spectral evaluation scheme
N. Bobrowski et al.
Title Page
Abstract Introduction
Conclusions References
Tables Figures
◭ ◮
◭ ◮
Back Close
Full Screen / Esc
Printer-friendly Version
Interactive Discussion
(a) (b)
(c)
Fig. 4. SO2 cross section for 273 K from Bogumil et al. (2003)(a)absolute cross section,(b)
differential cross section high pass filtered for the wavelength range 315–325 nm(c)differential cross section high pass filtered for the wavelength range 360–390 nm. The differential absorp-tion cross secabsorp-tions are≈4.5×10⁻²⁰
cm2/molec and 6×10⁻²²
AMTD
3, 863–889, 2010Novel SO2 spectral evaluation scheme
N. Bobrowski et al.
Title Page
Abstract Introduction
Conclusions References
Tables Figures
◭ ◮
◭ ◮
Back Close
Full Screen / Esc
Printer-friendly Version
Interactive Discussion Fig. 5. Simulated air mass factors (AMF) for remote sensing measurements of a volcanic
AMTD
3, 863–889, 2010Novel SO2 spectral evaluation scheme
N. Bobrowski et al.
Title Page
Abstract Introduction
Conclusions References
Tables Figures
◭ ◮
◭ ◮
Back Close
Full Screen / Esc
Printer-friendly Version
Interactive Discussion Fig. 6. Simulated SO2 SCDs for 315 nm versus SO2 SCDs at 375 nm for satellite remote