www.geosci-model-dev.net/10/223/2017/ doi:10.5194/gmd-10-223-2017
© Author(s) 2017. CC Attribution 3.0 License.
Reinitialised versus continuous regional climate simulations using
ALARO-0 coupled to the land surface model SURFEXv5
Julie Berckmans1,2, Olivier Giot1,2, Rozemien De Troch1,3, Rafiq Hamdi1,3, Reinhart Ceulemans2, and Piet Termonia1,3
1Royal Meteorological Institute, Brussels, Belgium
2Centre of Excellence PLECO (Plant and Vegetation Ecology), Department of Biology,
University of Antwerp, Antwerp, Belgium
3Department of Physics and Astronomy, Ghent University, Ghent, Belgium
Correspondence to:Julie Berckmans ([email protected])
Received: 17 June 2016 – Published in Geosci. Model Dev. Discuss.: 9 August 2016 Revised: 22 December 2016 – Accepted: 23 December 2016 – Published: 16 January 2017
Abstract.Dynamical downscaling in a continuous approach using initial and boundary conditions from a reanalysis or a global climate model is a common method for simulat-ing the regional climate. The simulation potential can be improved by applying an alternative approach of reinitial-ising the atmosphere, combined with either a daily reini-tialised or a continuous land surface. We evaluated the de-pendence of the simulation potential on the running mode of the regional climate model ALARO coupled to the land surface model Météo-France SURFace EXternalisée (SUR-FEX), and driven by the ERA-Interim reanalysis. Three types of downscaling simulations were carried out for a 10-year pe-riod from 1991 to 2000, over a western European domain at 20 km horizontal resolution: (1) a continuous simulation of both the atmosphere and the land surface, (2) a simulation with daily reinitialisations for both the atmosphere and the land surface and (3) a simulation with daily reinitialisations of the atmosphere while the land surface is kept continuous. The results showed that the daily reinitialisation of the atmo-sphere improved the simulation of the 2 m temperature for all seasons. It revealed a neutral impact on the daily precipi-tation totals during winter, but the results were improved for the summer when the land surface was kept continuous. The behaviour of the three model configurations varied among different climatic regimes. Their seasonal cycle for the 2 m temperature and daily precipitation totals was very similar for a Mediterranean climate, but more variable for temper-ate and continental climtemper-ate regimes. Commonly, the sum-mer climate is characterised by strong interactions between
the atmosphere and the land surface. The results for summer demonstrated that the use of a daily reinitialised atmosphere improved the representation of the partitioning of the surface energy fluxes. Therefore, we recommend using the alterna-tive approach of the daily reinitialisation of the atmosphere for the simulation of the regional climate.
1 Introduction
Since the late 1960s, the numerical weather prediction (NWP) community has used high-resolution limited area models. The numerical approach was first used for a regional climate simulation by Dickinson et al. (1989). Their climate simulation used the NWP model in forecasting mode with 3–5 daily reinitialisations of the initial conditions. To be able to run them without these short-term reinitialisations, the re-gional climate community applied monthly to multidecadal simulations, with only a single initialisation of the large-scale fields and frequent updates of the lateral boundary condi-tions (Giorgi and Mearns, 1999). These long-term continu-ous simulations required improvements in the representation of physical processes in the RCMs. The continuous simula-tion is still the most common in the RCM community (Leung et al., 2003). However, by applying the continuous approach, the simulated large-scale fields deviate from the driving lat-eral boundary conditions (von Storch et al., 2000).
The accuracy of the dynamical downscaling has improved by using short-term reinitialisations to reduce systematic er-rors (Kotlarski et al., 2012; Qian et al., 2003; Lo et al., 2008; Lucas-Picher et al., 2013). However, only few in the RCM community adopted this method, mainly because of its higher computational costs. Most studies (Kotlarski et al., 2012; Qian et al., 2003; Lo et al., 2008) dealing with the eval-uation of reinitialised versus continuous climate simulations, examined only short time periods of 1 month to 1 year. Us-ing a daily reinitialisation, Kotlarski et al. (2012) showed improvements in the prediction of precipitation for a case study of a large flooding event in the Elbe river catchment in August 2002. Changing the period of reinitialisation, from monthly to 10 daily, a reduction in systematic errors has been shown for precipitation when using the 10-day reinitialisa-tion (Qian et al., 2003). Even in a 20-year RCM simulareinitialisa-tion forced by reanalysis data, the sequence of events was better preserved by using daily reinitialisations (Lucas-Picher et al., 2013).
A model approach with short-term reinitialisations de-mands additional simulation time at each reinitialisation start. This time is required to reach dynamical equilibrium between the lateral boundary conditions and the internal model physics and dynamics (Giorgi and Mearns, 1999). Be-yond 24 h small perturbations in the initial conditions of the atmosphere have only limited impact on the simulation po-tential (Anthes et al., 1989). In contrast to the atmosphere, the surface takes a longer time to reach dynamical equilib-rium with the overlaying atmosphere, from a few weeks to several seasons, depending on the depth of the soil layer.
The surface interacts with the climate through the soil moisture and soil temperature, by influencing the surface energy budget (Giorgi and Mearns, 1999). The soil mois-ture controls the partitioning of the incoming energy into la-tent and sensible heat flux. The soil moisture limitation on the evapotranspiration is largest during summer (Seneviratne et al., 2010). The availability of soil moisture for evapo-transpiration is determined by the 2 m temperature (Jaeger
et al., 2009). As the land surface–atmosphere interactions play a crucial role in the representation of the current and future climate (Seneviratne et al., 2010), it is important to validate the model with observations. In-site measurements can provide valuable estimates of the surface energy fluxes. More specifically, FLUXNET establishes a global network of eddy-covariance towers measuring these fluxes (Baldoc-chi et al., 2001).
The objective of this study was to evaluate the simulation potential of three regional climate downscaling approaches with different update frequencies of the initial conditions: (1) a continuous simulation of both the atmosphere and the land surface, (2) a simulation with daily reinitialisations for both the atmosphere and the land surface and (3) a simu-lation with daily reinitialisations of the atmosphere while the land surface is kept continuous. We used the ALARO model to dynamically downscale the European Centre for Medium-Range Weather Forecasts (ECMWF) Interim Re-Analysis (ERA-Interim; Dee et al., 2011). Within this study, ALARO was coupled to the Météo-France SURFace EXter-nalisée land surface model (SURFEX; Masson et al., 2013). We evaluated the mean 2 m temperature and mean daily total precipitation by comparing with the 0.22◦ ECA&D E-OBS
dataset (Haylock et al., 2008), and the surface energy fluxes by comparing with the FLUXNET database (Baldocchi et al., 2001). The analysis covered a 10-year period from 1991 to 2000, for a domain encompassing western Europe.
The models, experimental design and observational datasets are described in Sect. 2. The results for the mean surface parameters are covered in Sect. 3. Section 4 demon-strates the results with respect to the surface energy budget. Finally, conclusions are given in Sect. 5.
2 Model and experimental design 2.1 Model definition
BI
IP FR
ME
AL
MD
EA
●
●
Vielsalm
Collelongo
100 200 300 400 500 600 700 800 900 1000 1100 1200 1300 1400 1500 1600 1700 1800 1900 2000 2100 2200 2300
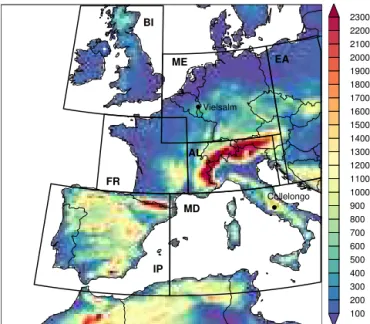
Figure 1.The total domain on 20 km horizontal resolution and the subdomains (BI, IP, FR, ME, AL, MD, EA) based on the subdo-mains selected in the EURO-CORDEX framework. The colour rep-resents the orography (m) in the ALARO+SURFEX set-up. The
two FLUXNET stations focused on in this study are Vielsalm (mar-itime temperate climate) and Collelongo (humid subtropical cli-mate).
operated at the Royal Meteorological Institute of Belgium for its operational numerical weather forecasts since 2010. The new physical parameterisation within the ALARO-0 model was specifically designed to run at convection-permitting scales, with a particular focus on an improved convection and cloud scheme (Gerard and Geleyn, 2005; Gerard, 2007; Ger-ard et al., 2009). The ALARO-0 model domain is centred over western Europe at 46.47◦
N and 2.58◦
E with a dimen-sion of 149×149 horizontal grid points and spacing of 20 km in both horizontal axes, with a Lambert conformal projection (Fig. 1). The model consists of 46 vertical layers with the lowest model level at 17 km and the model top extending up to 72 km.
The parameterisation of the land surface in ALARO-0 was initially made with the land surface scheme Interaction Soil– Biosphere–Atmosphere (ISBA; Noilhan and Planton, 1989; Noilhan and Mahfouf, 1996). This scheme was designed for NWP and climate models, and describes the exchange of en-ergy and water between the low-level atmosphere, vegeta-tion and the soil surface, by using either a diffusion method (Boone and Wetzel, 1999), or a force restore method based on two or three layers (Noilhan and Planton, 1989). Us-ing the initial set-up with ISBA, ALARO-0 has proven its skill for regional climate modelling with daily reinitialisa-tions (Hamdi et al., 2012; De Troch et al., 2013). In addition, this set-up has been validated for continuous climate simula-tions and is now contributing to the EURO-CORDEX project (Giot et al., 2016; Jacob et al., 2014). Meanwhile the more
recent land surface model SURFEX, with additional param-eterisations for urban surface types, has been implemented in the ALARO-0 model (Hamdi et al., 2014). A NWP appli-cation with SURFEXv5 within ALARO-0 has shown neutral effects on the winter 2 m temperature and on the vertical pro-file of the wind speed. However, it has shown positive effects on the summer 2 m temperature, 2 m relative humidity, and resulted in improved precipitation scores compared to the previously used ISBA model (Hamdi et al., 2014). Whereas the validation of the implementation of SURFEXv5 within ALARO-0 has been done in a NWP context, this validation is also required in the context of long-term climate simula-tions. In this study, SURFEX uses the two-layer force re-store method for ISBA. The first layer is the surface superfi-cial layer, that directly interacts with the atmosphere, and the second layer is the combined bulk surface and rooting layer, which is determined at the depth were soil moisture flux be-comes negligible for a period of ca. 1 week and is thus more important as a reservoir for soil moisture during dry periods (Noilhan and Planton, 1989).
SURFEX uses a tiling approach with each tile provid-ing information on the surface fluxes accordprovid-ing to the type of surface: nature, town, inland water and sea. The initial parameterisation ISBA for the nature tile was conserved, and the Town Energy Balance (TEB; Masson, 2000) was added as a parameterisation for the town tile. TEB uses a canopy approach with three urban energy budgets for the lay-ers roof, wall and road. The ISBA and TEB schemes were combined, together with parameterisation schemes for in-land water and seas, and externalised, based on the algo-rithm of Best et al. (2004). In other words, the code can be used inside a meteorological or climate model, or in stand alone mode. Each tile is divided in different patches, accord-ing to the tile type. These patches correspond to the plant functional types described in ECOCLIMAP (Masson et al., 2003). ECOCLIMAP is a 1 km horizontal resolution global land cover database and assigns the tile fraction and corre-sponding physical parameters (leaf area index: LAI, albedo, etc.) to SURFEX.
2.2 Experimental design
01-01 1990
01-03 01-01
1991
01-03 01-06 01-01
2001 Surface spin-up
CON Simulation
DRI
FS
01-06 Simulation
Surface spin-up Simulation 6-hourly LBCs from ERA-Interim
Initial conditions from atmosphere and SST Initial conditions from surface
TIME
Analysis period
01-01 1992
01-03 Simulation
01-06 Surface spin-up Surface spin-up
*
0 6 12 18 24 30 36 42 48 744Simulation duration (h)
Simulation day Simulation day
* * * * * * * * * Monthly update of the Initial conditions from SST
0 6 12 18 24 30 36 42 48 52 56 60Simulation duration (h)
Atmospheric
spin-up time Simulation day
* * * * * * * * * * * *
0 6 12 18 24 30 36 42 48 52 56 60Simulation duration (h)
Atmospheric
spin-up time Simulation day
* * * * * * * * * * * *
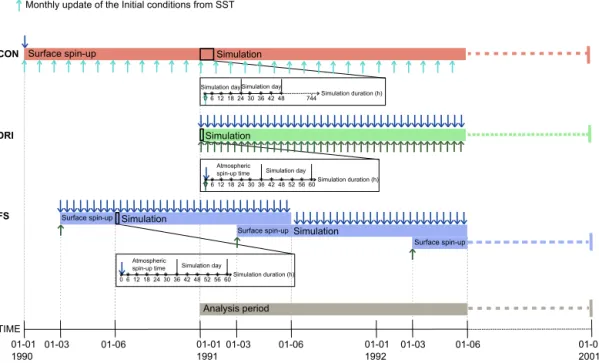
Figure 2.The set-up of the three downscaling approaches CON, DRI and FS used in this study. It represents the spin-up time for the different simulations, the analysis period of the total experiment and the update frequency of the lateral and initial boundary conditions.
an atmospheric spin-up, typically of a few days, and a land surface spin-up, typically of a few months to 1 year. The analysis covered a 10-year period from 00:00 UTC on 1 Jan-uary 1991 to 00:00 UTC on 1 JanJan-uary 2001. Although the 10-year length is arbitrary, it is sufficiently long to include some inter-annual variability and to generate a reasonable sample of extreme events. The use of a NWP model in a long-term climate setting for the performance of extreme precipitation events for a 10-year period was recently demonstrated (Lind-stedt et al., 2015). To evaluate the sensitivity of the model to the update frequency of the initial conditions, three types of downscaling approaches were conducted with ALARO-0 coupled to SURFEXv5 and are detailed below.
The first downscaling approach was done by simulating the model in a continuous mode for both the atmosphere and the land surface (hereafter called CON (“CONtinuous”); Fig. 2). The model was started at 00:00 UTC on 1 uary 1990, and ran continuously until 00:00 UTC on 1 Jan-uary 2001. The first year was treated as both atmospheric and land surface spin-up, and was excluded from the analy-sis. The simulations were interrupted and restarted monthly to allow for only sea surface temperatures (SSTs) to be up-dated. Other surface parameters that were updated monthly using the climatological values from ECOCLIMAP were the vegetation fraction, surface roughness length, surface emis-sivity, surface albedo, sand and clay fractions.
In the second downscaling approach, the model was reini-tialised daily for both the atmosphere and the land surface
(hereafter called DRI (“Daily ReInitialisation”); Fig. 2). The model started at 12:00 UTC on 1 January 1991, and each reinitialisation ran for 60 h. The first 36 h were treated as at-mospheric spin-up, and excluded from the analysis. By ap-plying this downscaling approach, the regional model stays close to the ERA-Interim forcing (von Storch et al., 2000). However, the coarse representation of the land surface by the reanalysis is not able to capture the fine-scale heterogeneity, particularly the soil moisture and soil temperature.
when starting in March (not shown). The simulations were done in parallel to each year from 1990 to 2000, and the 3 monthly spin-up was replaced by the analysis of the pre-vious year.
We use 3-hourly output for the model evaluation pre-sented in the manuscript. The evaluation of atmospheric vari-ables for winter and summer was done for seven subdo-mains across Europe, to cover the spatial variability of the domain (Fig. 1). This was in agreement with the subdomains that were used in the EURO-CORDEX community (Kot-larski et al., 2014) and that were defined earlier in the frame-work of the “Prediction of Regional scenarios and Uncer-tainties for Defining European Climate change risks and Ef-fects” (PRUDENCE) project (Christensen et al., 2007). The subdomains used in this study were the British Isles (BI), the Iberian Peninsula (IP), mid-Europe (ME), France (FR), the Alps (AL), the Mediterranean (MD) and eastern Europe (EA). The subdomains IP, ME and EA were chosen due to their diverse climate regimes to evaluate the yearly cycle of the atmospheric and land surface variables. As land surface processes play an important role primarily during summer, the model output was stored at every hour for the summer period of June–July–August (JJA) during the 10-year pe-riod. We evaluated the partitioning of the sensible and latent heat fluxes by the daily maximum Bowen ratio (BR; Bowen, 1926) for the summer periods from 1996 to 2000 for the total study domain, and compared a subset of FLUXNET stations using the corresponding model grid points. The correspond-ing daily maximum BRs were analysed for the 10-year sum-mer period from 1991 to 2000. When the BR<1, the latent heat flux (LE) is greater than the sensible heat flux (H). Con-versely when BR>1, LE is less than H. The diurnal cycles of all surface energy fluxes were also analysed and validated against observations.
2.3 Observational reference data
The results of the climate simulations were validated against E-OBS, a daily high-resolution gridded observational dataset (Haylock et al., 2008). The dataset consists of the daily mean temperature, the daily maximum and minimum temperature, and the daily precipitation total. The most recent version v12.0 was selected on the 0.22◦ rotated pole grid,
corre-sponding to a 25 km horizontal resolution in Europe. It cov-ers the period 1 January 1950 to 30 June 2015. In order to validate the model data, the ALARO-0 data at 20 km hori-zontal resolution were bilinearly interpolated towards E-OBS at 25 km horizontal resolution and replotted to our study do-main. A careful interpretation of E-OBS is necessary, as this regridded non-homogeneously distributed network applies a smoothing out of extreme precipitation and consequently a large underestimation of the mean precipitation (Haylock et al., 2008).
For the validation of the surface fluxes in the model, we used measurements from the FLUXNET level 3 flux tower
database (Baldocchi et al., 2001). It provides information on the energy exchange between the ecosystem and the atmo-sphere. FLUXNET is a global network, and consists of flux towers using the eddy-covariance method to monitor carbon dioxide and water vapour exchange rates, and energy flux densities. No gap-filling has been done and the comparison to the model output was only done at hours when observa-tional data were available. A number of sites were already part of a separate flux measurement network (Aubinet et al., 1999). The model validation was done using grid cell aver-ages compared to point observations, suggesting large differ-ences in the land cover representation. In total, a subset of seven stations, which cover different biome types (Table 1), were selected to demonstrate the spatial variability of the do-main by the model. However, the do-main focus was on the Viel-salm and Collelongo sites (Fig. 1), as their model grid cells represent more than 50 % of the corresponding land cover, and cover different climate regimes.
3 Validation of the mean model state 3.1 Spatial distribution
3.1.1 Daily mean 2 m temperature
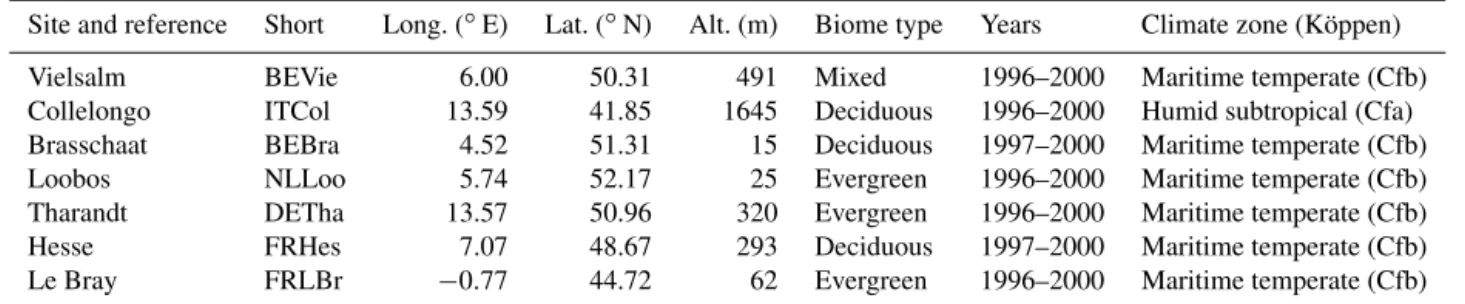
The spatial distributions of the 10-year daily mean temper-ature bias (absolute, (model−observed)) of CON, DRI and FS simulations were compared to E-OBS (Fig. 3), for win-ter (DJF: December–January–February) and summer (JJA). The area-averaged bias during winter and summer for CON, DRI and FS for the entire domain as well as for specific subdomains is presented in Table 2. CON simulated a cold bias in general, except for northern Africa in summer, with a pronounced orographic effect, for both winter and summer (Fig. 3c, d). The cold bias over the entire domain was less pronounced in summer with a value of−0.6◦C compared to
the winter bias of−1.8◦C (Table 2). Moreover, the Iberian
Peninsula, Mediterranean and eastern Europe resulted in a small bias of−0.5◦C during summer as compared to E-OBS
(Fig. 3d). This is due to compensating effects, as the bias rep-resents an average over the subdomain and might be the re-sult of large negative and large positive biases over different parts of the particular subdomain compensating each other. However, the area-averaged bias gives a good impression of the ranking of the experiments (Kotlarski et al., 2014).
Table 1.Overview of the FLUXNET eddy-covariance sites used in this study.
Site and reference Short Long. (◦E) Lat. (◦N) Alt. (m) Biome type Years Climate zone (Köppen)
Vielsalm BEVie 6.00 50.31 491 Mixed 1996–2000 Maritime temperate (Cfb)
Collelongo ITCol 13.59 41.85 1645 Deciduous 1996–2000 Humid subtropical (Cfa)
Brasschaat BEBra 4.52 51.31 15 Deciduous 1997–2000 Maritime temperate (Cfb)
Loobos NLLoo 5.74 52.17 25 Evergreen 1996–2000 Maritime temperate (Cfb)
Tharandt DETha 13.57 50.96 320 Evergreen 1996–2000 Maritime temperate (Cfb)
Hesse FRHes 7.07 48.67 293 Deciduous 1997–2000 Maritime temperate (Cfb)
Le Bray FRLBr −0.77 44.72 62 Evergreen 1996–2000 Maritime temperate (Cfb)
Table 2.The daily mean 2 m temperature bias (◦C) and root mean square error (RMSE) (in brackets) between the downscaled simulations and E-OBS for the total domain and the subdomains (BI, IP, FR, ME, AL, MD, EA) during DJF and JJA for the 10-year period from 1991 to 2000.
Total BI IP FR ME AL MD EA
DJF CON −1.8 (2.5) −1.1 (2.0) −2.2 (2.7) −1.5 (2.2) −1.3 (2.0) −3.0 (3.8) −2.4 (3.1) −1.1 (2.0) DRI −1.2 (2.8) −1.0 (2.7) −1.6 (2.7) −1.2 (2.9) −0.7 (2.6) −1.4 (3.4) −2.1 (3.2) −0.3 (2.8) FS −1.0 (2.8) −0.3 (2.8) −1.3 (2.5) −0.7 (2.8) −0.4 (2.6) −2.1 (3.8) −1.2 (2.7) −0.4 (2.8) JJA CON −0.6 (2.0) −1.7 (2.0) −0.5 (1.7) −1.2 (1.9) −1.3 (1.9) −1.8 (2.6) −0.5 (2.0) −0.5 (1.8) DRI −0.1 (2.3) −0.9 (2.0) −0.3 (2.2) −0.7 (2.4) −0.3 (2.1) −0.8 (2.3) −0.6 (2.3) 0.0 (2.1)
FS 0.9 (2.7) −0.7 (2.2) 0.5 (2.4) 1.0 (3.1) 1.3 (2.8) 0.0 (2.5) 0.7 (2.5) 1.2 (2.8)
of the bias of CON. For summer, the bias decreases further to −0.3◦C (ME) and −0.8◦C (AL); a 1◦C decrease
rela-tive to CON for these subdomains. The frequent reinitialisa-tions keep the large scales closer to the ERA-Interim forc-ing, whereas ALARO and ARPEGE are bound to a cold bias (Voldoire et al., 2013; Giot et al., 2016).
The performance of the FS simulation was different for winter and summer (Fig. 3g, h). The simulation of the 2 m temperature during winter was the best of all three ap-proaches when using FS. Large parts of the domain resulted in biases close to zero for the British Isles, France, mid-Europe and eastern mid-Europe (Fig. 3g). The bias decreased by ca. 1◦C in FS compared to CON for these subdomains
(Ta-ble 2). During summer, the sign of the bias reversed from negative to positive, except for some isolated areas (Fig. 3h). The Alps were characterised by a zero bias on the north-ern flank and mixed cold and warm bias on the southnorth-ern flank compensating each other (Table 2). Large parts of the Iberian Peninsula and the Mediterranean exhibited a warm bias (Fig. 3h), resulting in positive values close to zero (Ta-ble 2). Mid-Europe, France and eastern Europe were mainly characterised by a positive bias of around 1◦
C (Table 2). These positive biases for FS might be related to rapidly decreasing soil moisture values in spring and summer (not shown). The temperature–soil moisture relation is strongest for FS, as this simulation benefits from soil moisture mem-ory by allowing the land surface to be fully interactive with the atmosphere (Koster and Suarez, 2001).
In summary, CON underestimated winter and summer 2 m temperature by 1–2◦C on average. With respect to CON,
DRI showed a general positive effect during winter and sum-mer. Consequently, the use of a daily reinitialised atmosphere improved the representation of the 2 m temperature for both winter and summer compared to a continuous simulation of the atmosphere. The winter bias was further improved for most subdomains for FS compared to CON. For summer, most subdomains experienced a warm bias, in the same or-der of magnitude as CON. The difference might point at the interaction of the land surface and the atmosphere being stronger with FS, because of the soil moisture memory.
3.1.2 Daily accumulated precipitation
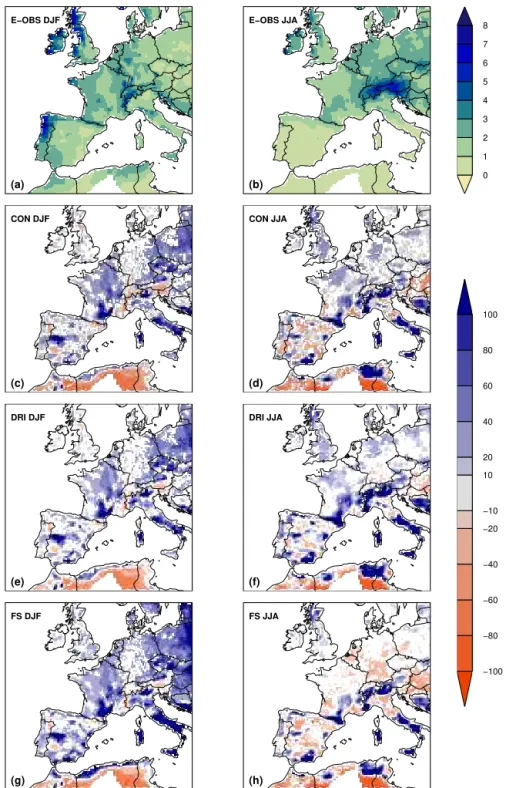
The spatial distributions of the 10-year daily accumulated precipitation bias (relative, (model−observed)/observed) of CON, DRI and FS were compared to E-OBS, for the win-ter and the summer seasons (Fig. 4). The relative biases dur-ing winter and summer for CON, DRI and FS are presented for the entire domain as well as for the specific subdomains in Table 3. The precipitation pattern of E-OBS during win-ter displayed the highest values of>3 mm day−1over
Portu-gal, north-western Spain, western England, Scotland and Ire-land, the Adriatic Coast and the northern flanks of the Alps (Fig. 4a, b). During summer, similar amounts of rainfall were concentrated over the Alps and the Carpathians, whereas the lowest values of<1 mm day−1 were concentrated over the
E−OBS DJF
(a)
E−OBS JJA
(b) −2
1 4 7 10 13 16 19 22 25
CON DJF
(c)
CON JJA
(d)
−5 −4 −3 −2 −1 −0.5 0.5 1 2 3 4 5
DRI DJF
(e)
DRI JJA
(f)
FS DJF
(g)
FS JJA
(h)
Figure 3.Daily mean 2 m temperature (◦C) for E-OBS DJF(a)and JJA(b), and absolute bias (◦C) of the model with E-OBS for CON DJF(c)and JJA(d), for DRI DJF(e)and JJA(f)and for FS DJF(g)and JJA(h), all at a 20 km horizontal resolution for the 10-year period from 1991 to 2000. Only the significant biases are shown, using the Student’sttest at a 5 % level, and non-significant biases are shown in white.
towards the too wet driving fields of ERA-Interim (Lucas-Picher et al., 2013), which can explain part of the overes-timated precipitation. More specifically, the overestimation of winter precipitation was strongest in the Mediterranean and eastern Europe with values from 35.3 to 108.5 % for all
Table 3.The daily accumulated precipitation bias (%) and root mean square error (RMSE) (in brackets) between the downscaled simulations and E-OBS for the total domain and the subdomains (BI, IP, FR, ME, AL, MD, EA) during DJF and JJA for the 10-year period from 1991 to 2000.
Total BI IP FR ME AL MD EA
DJF CON 16.6 (3.8) 4.5 (4.5) 16.1 (4.6) 29.0 (3.6) 25.4 (2.7) 11.2 (4.7) 46.0 (6.2) 35.3 (2.3)
DRI 20.9 (4.8) 6.6 (5.2) 21.2 (5.6) 26.8 (4.8) 27.9 (3.8) 24.1 (6.3) 41.6 (7.1) 45.7 (3.1)
FS 36.3 (5.4) 16.9 (5.5) 31.3 (6.2) 38.2 (5.2) 35.7 (4.0) 26.7 (6.7) 108.5 (9.9) 64.1 (3.5)
JJA CON 12.1 (4.2) 24.7 (4.4) 11.5 (2.9) 12.0 (4.4) 11.9 (5.0) 32.6 (7.3) 60.7 (3.5) −2.6 (5.4)
DRI 22.5 (4.7) 27.0 (4.7) 30.0 (3.4) 18.3 (5.1) 8.8 (5.5) 48.2 (8.9) 84.8 (3.8) 6.8 (5.9)
FS 3.6 (4.5) 17.4 (4.6) 13.0 (3.2) −7.0 (4.6) −13.4 (5.1) 23.5 (8.3) 52.4 (3.6) −8.2 (5.7)
in winter with ca. 36.3 % compared to 16.6 and 20.9 % for CON and DRI. The too wet driving field of ERA-Interim was superimposed on the smaller cold bias of FS, suggest-ing a higher precipitation bias than CON and DRI.
During summer, the simulations showed different spatial variability (Fig. 4d, f, h). In comparison to the winter bias, the summer precipitation bias for CON was reduced over the continental part with positive and negative biases over the southern part of the domain (Fig. 4d). The Mediterranean ex-pressed a high wet bias of 60.7 % for CON, but the absolute values in summer were close to zero, as it is characterised by a climate with dry summers (Fig. 4b). The bias pattern over the continental part was very similar for DRI compared to CON during summer, whereas southern Europe showed in-creased wet biases for DRI (Fig. 4f). The Iberian Peninsula, France and the Mediterranean demonstrated a bias of 30.0, 18.3 and 84.8 % respectively, compared to 11.5, 12.0 and 60.7 % with CON (Table 3). The performance of FS was sim-ilar to CON for southern and eastern Europe (Fig. 4h). This is in contrast to the continental part of the domain, where the precipitation signal reversed relative to CON and DRI and a small dry bias persisted (−7.0 % for France,−13.4 % for mid-Europe and−8.2 % for eastern Europe respectively). Consequently, the summer precipitation was simulated better by FS than by CON and DRI. During summer, the influence of the soil moisture memory on the atmosphere is more im-portant, resulting in an improved representation of the pre-cipitation with FS.
In summary, the model was characterised by a wet bias in winter and summer. The spatial variability during winter was very similar for all simulations; therefore, the use of a daily reinitialised atmosphere had a neutral impact on the winter precipitation. During summer, the precipitation showed a dif-ferent behaviour with the difdif-ferent simulation modes. In sum-mer for the southern part of the domain, precipitation bias ex-perienced a neutral effect with DRI, whereas the precipitation bias increased for the continental part. Frequent reinitialisa-tions did not allow the land surface to build up a soil mois-ture memory, resulting in less skill for the representation of the precipitation. However, the precipitation bias improved with FS for the continental part. Therefore, the combination
of the daily reinitialised atmosphere together with a continu-ous surface is crucial in summer to get the best results.
3.2 Mean annual cycle
3.2.1 Daily mean 2 m temperature
To validate specific subdomains within the larger domain on a monthly scale, the mean annual cycles of the downscaled simulations were compared to the observations (Fig. 5). We focused on the following subdomains (Fig. 1): (1) the Iberian Peninsula at the western boundary of the domain with its warm and dry summer climate, (2) mid-Europe with its tem-perate climate and (3) eastern Europe at the eastern boundary of the domain with its continental climate.
The daily mean 2 m temperature reached 23◦C for the
Iberian Peninsula, and 20◦C for both mid-Europe and
east-ern Europe (Fig. 5a–c). For these selected subdomains, all downscaled simulations presented very similar autumn (SON: September–October–November) temperatures, but underestimated them with respect to E-OBS. Therefore, the autumn temperature is not sensitive to the updated frequency of the initial conditions. Regarding the other seasons, the simulations revealed a different behaviour in the representa-tion of the 2 m temperature with respect to the observarepresenta-tions.
For the Iberian Peninsula, the 2 m temperature was gener-ally underestimated for all seasons (Fig. 5a). Except for au-tumn, FS was closer to the observations as compared to CON and DRI, resulting in a yearly mean temperature of 12.5◦C,
which was closer to the observed yearly mean temperature of 13.7◦C as compared to 11.6 and 11.9◦C by CON and DRI
respectively. Therefore, summer 2 m temperature was well simulated by FS for this subdomain. For mid-Europe, CON and DRI underestimated the 2 m temperature for all seasons, and FS was very close to the observations from February to May (Fig. 5b). However, FS overestimated the summer 2 m temperature and CON and DRI underestimated the summer 2 m temperature. Still, the yearly mean value of 9.0◦
C by FS was very close to the observational mean of 9.3◦C. For
bi-E−OBS DJF
(a)
E−OBS JJA
(b) 0
1 2 3 4 5 6 7 8
CON DJF
(c)
CON JJA
(d)
−100 −80 −60 −40 −20 −10 10 20 40 60 80 100
DRI DJF
(e)
DRI JJA
(f)
FS DJF
(g)
FS JJA
(h)
Figure 4.Daily accumulated precipitation (mm day−1) for E-OBS DJF(a)and JJA(b), and relative bias (%) of the model with E-OBS for
CON DJF(c)and JJA(d), for DRI DJF(e)and JJA(f)and for FS DJF(g)and JJA(h), all at a 20 km horizontal resolution for a 10-year period from 1991 to 2000. Only the significant biases are shown, using theF test at a 5 % level, and non-significant biases are shown in white.
ases (Fig. 5c), whereas CON underestimated the 2 m temper-ature. Similar to mid-Europe, FS overestimated the summer 2 m temperature with ca. 1◦C and CON underestimated the
summer 2 m temperature with ca. 1◦C in eastern Europe. Yet
again, the yearly mean value of 8.5◦C by FS was very
sim-ilar as compared to the observations with a value of 8.6◦C,
while largest differences occurred using CON with a value of 7.5◦C.
● ● ● ● ● ● ● ● ● ● ● ● −5 0 5 10 15 20 25
Jan Mar May Jul Sep Nov
Daily mean temper
ature [°C] IP E−OBS CON DRI FS MEAN SD 13.7 2.8 11.6 3.4 11.9 3.3 12.5 3.5 (a) ● ● ● ● ● ● ● ● ● ● ● ● −5 0 5 10 15 20 25
Jan Mar May Jul Sep Nov ME E−OBS CON DRI FS MEAN SD 9.3 1.2 7.7 1.4 8.4 1.3 9.0 1.5 (b) ● ● ● ● ● ● ● ● ● ● ● ● −5 0 5 10 15 20 25
Jan Mar May Jul Sep Nov EA ● E−OBS CON DRI FS E−OBS CON DRI FS MEAN SD 8.6 1.8 7.5 1.8 8.2 1.7 8.5 1.9 (c) ● ● ● ● ● ● ● ● ● ● ● ● 0 1 2 3 4
Jan Mar May Jul Sep Nov
Time (months)
Daily precipitation [mm da
y −1 ] IP E−OBS CON DRI FS MEAN SD 1.7 1.0 1.9 1.3 2.0 1.4 2.1 1.4 (d) ● ● ● ● ● ● ● ● ● ● ● ● 0 1 2 3 4
Jan Mar May Jul Sep Nov
Time (months) ME E−OBS CON DRI FS MEAN SD 2.0 0.6 2.3 0.6 2.3 0.6 2.3 0.6 (e) ● ● ● ● ● ● ● ● ● ● ● ● 0 1 2 3 4
Jan Mar May Jul Sep Nov
Time (months) EA ● E−OBS CON DRI FS E−OBS CON DRI FS MEAN SD 1.6 0.4 2.0 0.7 2.1 0.7 2.1 0.7 (f)
Figure 5.Mean annual cycle of the daily 2 m temperature (◦C) with E-OBS, CON, DRI and FS for(a)the Iberian Peninsula,(b)mid-Europe, and(c)eastern Europe and daily accumulated precipitation (mm day−1) for(d)the Iberian Peninsula,(e)mid-Europe and(f)eastern Europe,
averaged over the 10-year period from 1991 to 2000. Both the mean and standard deviation (SD) are displayed as text.
bound to a cold bias (Giot et al., 2016). Along the selected subdomains, there were larger differences between the sim-ulations in mid-Europe and eastern Europe compared to the Iberian Peninsula. The dry climate of the Iberian Peninsula is less dominated by land surface–atmosphere interactions, as soil moisture does not impact the evapotranspiration avail-ability (Seneviratne et al., 2010). DRI was able to simulate the 2 m temperature better for mid-Europe and eastern Eu-rope as compared to CON for winter, spring and summer. FS had the best yearly mean 2 m temperature, but the summer 2 m temperature was overestimated by FS for mid-Europe and eastern Europe.
3.2.2 Daily accumulated precipitation
Similar to temperature, the monthly means of the daily accu-mulated precipitation, averaged over the 10-year period, are shown in Fig. 5 for the Iberian Peninsula, mid-Europe and eastern Europe. When comparing the observations, the sea-sonal variability was most pronounced for the Iberian Penin-sula, with minimum precipitation values of ca. 0.5 mm day−1
during summer, and maximum precipitation values of ca. 3 mm day−1during spring, autumn and beginning of the
win-ter (Fig. 5d). The precipitation in mid-Europe reached
high-est values of ca. 3 mm day−1during summer (Fig. 5e). The
continental climate of eastern Europe presented average val-ues of 1 mm day−1for winter and spring, while most rainfall
occurred in the summer of ca. 2.5 mm day−1(Fig. 5f).
In general, the agreement of the simulations was the largest during autumn. For the Iberian Peninsula, the sea-sonal pattern of the downscaled simulations followed the seasonal pattern of E-OBS, despite a general overestima-tion of the precipitaoverestima-tion (Fig. 5d). This overestimaoverestima-tion was stronger in winter and in spring for the Iberian Peninsula, and is in agreement with Lucas-Picher et al. (2013). For these two seasons, E-OBS showed an undercatch of the precipita-tion, which might have amplified the model biases (Rauscher et al., 2010). CON and DRI were closer to the observa-tions than FS in winter and spring, resulting in yearly mean values of 1.9, 2.0 and 2.1 mm day−1 respectively for CON,
DRI and FS, as compared to the observational mean value of 1.7 mm day−1. In mid-Europe, the model overestimated
●
●
●● ●
●
●
CON
(a)
●
●
●● ●
●
●
CON
(d)
−0.5 0 0.5 1 1.5 2 3 4 5
●
●
●● ●
●
●
DRI
(b)
●
●
●● ●
●
●
DRI
(e)
●
●
●● ●
●
●
FS
(c)
●
●
●● ●
●
●
FS
(f)
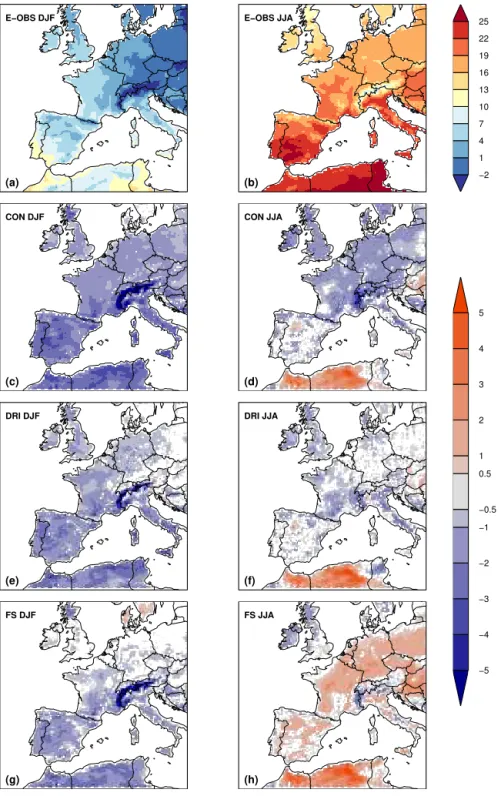
Figure 6.Daily maximum Bowen ratio averaged over the 5-year JJA period from 1996 to 2000 for(a)CON,(b)DRI and(c)FS and averaged over the 10-year JJA period 1991–2000 for(d)CON,(e)DRI and(f)FS. The dots represent the values for the FLUXNET stations Vielsalm, Collelongo, Brasschaat, Loobos, Tharandt, Hesse and Le Bray.
is considerable agreement on the estimation of the summer precipitation. The yearly mean precipitation by CON was lowest with 2.0 mm day−1and highest when using FS with
2.1 mm day−1, as compared to 1.6 mm day−1 by the
obser-vations (Fig. 5f).
In summary, the three downscaling approaches generally overestimated the precipitation over these three regions in all seasons except during JJA. On a yearly basis, the differences between CON, DRI and FS were small; on the other hand, on
00:00 UTC 06UTC 12UTC 18UTC
−100
0
100
200
300
400
Hour
W m−²
Vielsalm CON DRI FS H
(a)
00UTC 06UTC 12UTC 18UTC
−100
0
100
200
300
400
Hour
W m−²
Vielsalm CON DRI FS LE
(b)
00UTC 06UTC 12UTC 18UTC
−100
0
100
200
300
400
Hour
W m−²
Collelongo CON DRI FS H
(c)
00UTC 06UTC 12UTC 18UTC
−100
0
100
200
300
400
Hour
W m−²
Collelongo CON DRI FS LE
(d)
Figure 7.Daily cycle of the energy fluxes (W m−2) in JJA 1996–2000 for Vielsalm in the top row and Collelongo in bottom row for(a, c)H,
and(b, d)LE, for the FLUXNET observations and their corresponding model grid points by CON, DRI and FS. The error bars represent the estimated uncertainties of the observed turbulent fluxes.
4 Validation of surface fluxes
The spatial distributions of the 5-year daily maximum BR, at the time of maximum H and LE, of CON, DRI and FS were compared to FLUXNET observations, for the summer period only (Fig. 6a–c). The corresponding spatial distribu-tions of the 10-year daily maximum BR of CON, DRI and FS were evaluated with respect to the results for the 5-year period (Fig. 6d–f). The mean diurnal cycles of the surface energy fluxes are illustrated over the 5-year summer period from 1996 to 2000 for the FLUXNET stations of Vielsalm and Collelongo and their corresponding model grid points (Fig. 7, Table 4).
The daily maximum BR showed a strong gradient of in-creasing values towards the south of the domain (Fig. 6a–c). Recall that when the value is lower (higher) than 1, the la-tent heat flux (LE) is higher (lower) than the sensible heat flux (H). Southern Europe is characterised by dry summers, with a strong control of the soil moisture on the evapotran-spiration (Jaeger et al., 2009), and thus lower LE than H. Large differences existed between the three downscaling
ap-proaches, particularly for the continental part of the domain. This is in agreement with the larger differences between the simulation modes in 2 m temperature for the continental sub-domains compared to the southern subsub-domains. Therefore, the 2 m temperature is correlated to evapotranspiration by the sensitivity of LE on the soil moisture (Seneviratne et al., 2006).
Table 4.The daily maximum surface energy fluxes (W m−2) averaged over the 5-year JJA period from 1996 to 2000 and the 10-year period
from 1991 to 2000 (in brackets).
RN H LE G BR
Vielsalm OBS 417 151 134 11 1.12
CON 395 (404) 118 (113) 250 (261) 47 (47) 0.47 (0.43)
DRI 388 (398) 151 (159) 195 (193) 57 (58) 0.78 (0.82)
FS 405 (411) 139 (152) 229 (221) 46 (49) 0.61 (0.69)
Collelongo OBS 538 253 192 −1.39 1.32
CON 480 (481) 159 (147) 270 (289) 111 (108) 0.59 (0.51)
DRI 496 (494) 247 (232) 183 (194) 143 (140) 1.35 (1.19)
FS 501 (498) 197 (191) 236 (247) 111 (110) 0.83 (0.77)
sites Vielsalm and Collelongo, DRI indicates the best agree-ment with the observed BR (Fig. 6b), with values of 0.78 and 1.35 compared to 1.12 and 1.32 respectively (Table 4). Despite higher BR values in FS, estimates corresponding to Vielsalm and Collelongo were located in regions where the BR was comparatively low, resulting in average values of 0.61 and 0.83 respectively (Table 4).
The model performed well for the simulation of the daily cycle of the net radiation (RN; not shown), even though the model underestimated the values of RN by ca. 5–10 % (Ta-ble 4). The model generally underestimated H, and overes-timated LE (Fig. 7 and Table 4). The ground heat flux (G) showed improbably high values compared to the observed ones (Table 4). G is dependent on the soil temperature, which was largely overestimated by the land surface model (not shown). The standard version of ISBA, the nature tile of SURFEX, aggregates soil and vegetation properties for each grid cell (Noilhan and Planton, 1989). The net radiation is directly transferred to the ground, causing an inaccurate par-titioning of the incoming energy into turbulent and ground heat fluxes (Napoly et al., 2016). An additional parameteri-sation for the leaf litter on the surface soil impacts this dis-tribution (Wilson et al., 2012). We suggest to include an ex-plicit formulation of the canopy layer (Napoly et al., 2016) and potentially a parameterisation for the forest litter layer (Napoly et al., 2016; Wilson et al., 2012). The implementa-tion of these explicit formulaimplementa-tions in ISBA outperformed the representation of the soil temperature of the original ISBA model (Napoly et al., 2016). They showed that the original ISBA model overestimated the G flux amplitude with sev-eral tens of W m−2during both daytime and nighttime.
How-ever, using the distinct surface energy budgets resolved part of the overestimated G by intercepting most of the downward solar radiation, leaving more energy available for turbulent fluxes. Consequently, less net radiation reaches the forest sur-face, reducing the energy available for the soil conductance Napoly et al. (2016).
For Vielsalm, H was simulated well by DRI and FS dur-ing nighttime and daytime, whereas CON underestimated H during daytime (Fig. 7a). The daily maximum H by CON
was only 118 W m−2, as compared to 151 and 139 W m−2for
DRI and FS respectively (Table 4). This validation was only done for five summer periods from 1996 to 2000, but the cor-responding daily maximum values for the 10-year summer period from 1991 to 2000 indicate that the 5-year period was representative for the validation of the fluxes (Table 4). The LE was overestimated by all simulations, but the difference in the observations was smallest for DRI, due to the frequent land surface reinitialisations, compared to the highest values for CON. The daily maximum BR was lower than 1 for all downscaling approaches (Table 4). This means that they all simulated a higher latent than sensible heat flux. Still, DRI and FS showed higher values for BR than CON. Therefore, the partitioning of the surface energy fluxes was better repre-sented by DRI and FS for the station of Vielsalm.
For Collelongo, the model underestimated H during day-time and overestimated H during nightday-time, except for DRI, which demonstrated a good agreement with the observa-tions. Consequently, the model overestimated LE during day-time, except for DRI. The daily maximum H for DRI of 247 W m−2was close to the observed value of 253 W m−2,
whereas CON and FS simulated much lower values of 159 and 197 W m−2 respectively (Table 4). CON showed the
largest LE bias. Regarding BR, the simulation by DRI with a value of 1.35 was in very good agreement with the ob-servations. The DRI simulation resulted in the least biased partitioning of the surface energy fluxes at Collelongo. How-ever, FS showed that frequent atmospheric reinitialisations can add value.
could not improve the representation of the surface energy fluxes. The high values of G were caused by the large over-estimation of the soil temperature and could be solved by im-plementing additional parameterisations for the canopy layer and soil surface layer. This implementation could alter the energy budget available for the turbulent fluxes, but this lies outside the scope of this study.
5 Conclusions
An assessment of three downscaling approaches has been performed using the regional climate model ALARO-0 cou-pled to the land surface model SURFEXv5, with lateral and initial boundary conditions from ERA-Interim. The sim-ulations were applied for a 10-year period from 1991 to 2000, for a western European domain. The performance of ALARO-0 with SURFEX has already been validated for NWP applications (Hamdi et al., 2014), and here we present an evaluation for long-term climate simulations.
We compared the commonly used approach of a continu-ous climate simulation with two alternative methods of fre-quently reinitialising the RCM boundary conditions, com-bined with either a daily reinitialised or continuous land surface. The use of a daily reinitialised atmosphere outper-formed the continuous (CON) approach for winter and sum-mer 2 m temperature, and deteriorated the sumsum-mer precipita-tion. However, the use of a continuous land surface (FS) with a daily reinitialised atmosphere improved the summer precip-itation relative to the full continuous approach. Furthermore, it improved the winter 2 m temperature, whereas it resulted in a neutral impact on the summer 2 m temperature and the winter precipitation, despite a slight deterioration over the Mediterranean. The SSTs were reinitialised daily together with the atmosphere, as compared to the monthly updated SSTs in the continuous approach.
The seasonal cycle of the 2 m temperature and precipita-tion was different for three selected subdomains that cov-ered large climate variability. Both the temperate climate of mid-Europe and the continental climate of eastern Europe indicated more seasonal variability than the Mediterranean climate of the Iberian Peninsula. The simulation of the 2 m temperature had improved when applying daily reinitialised atmosphere with continuous land surface, despite an overes-timation of the summer 2 m temperature. Precipitation biases were larger and are perhaps associated with the tendency for ERA-Interim to be wetter than E-OBS, and the low spatial coverage by the observations in some regions. It was clear that the agreement for the precipitation between the model and the observations was highest during summer, while other seasons showed stronger deviations.
During summer, the interaction between the land surface and the overlaying atmosphere is largest. The 2 m tempera-ture interacts with the soil moistempera-ture and influences the par-titioning of the surface energy fluxes. The daily
reinitialisa-tion of the atmosphere improved the correct partireinitialisa-tioning of the latent and sensible heat flux, although the biases were still quite large to be conclusive. Still, this approach outper-formed the use of a continuous simulation. For a more com-prehensive analysis, future research will consider including more FLUXNET stations. A more in-depth analysis on the interaction between 2 m temperature, precipitation and sur-face energy fluxes can reveal soil–moisture–temperature cou-pling (Jaeger et al., 2009), but this lies outside the scope of this study.
In conclusion, this study demonstrated that the approach of a daily reinitialised atmosphere was superior over the full continuous approach. The use of a continuous surface next to a daily reinitialised atmosphere improved the winter tem-perature and summer precipitation. We recommend using FS in a set-up with GCM forcing for climate simulations with ALARO-0.
6 Code and data availability
The used ALADIN codes, along with all related intellec-tual property rights, are owned by the members of the AL-ADIN consortium. Access to the ALAL-ADIN System, or el-ements thereof, can be granted upon request and for re-search purposes only. The used SURFEX codes are freely available, together with the ECOCLIMAP database, at http: //www.cnrm-game-meteo.fr/surfex///spip.php?rubrique8.
This study is based on large datasets written in .FA and .lfi format. The relevant output is exported to R datasets. Due to licensing restrictions, this model output is not made pub-licly available. However, for the purpose of the review, the data can be made available for the editor and reviewer upon request by contacting Julie Berckmans.
Author contributions. J. Berckmans performed the model simula-tions CON, DRI, and FS and analysed the results. J. Berckmans drafted the manuscript. O. Giot and R. De Troch designed R tools for the analysis. O. Giot designed the experiment CON. R. Hamdi designed the experiment DRI and FS and developed the model code for the implementation of SURFEX within ALARO-0. P. Ter-monia and R. Ceulemans provided overall guidance during the project. R. Ceulemans and R. Hamdi were the project contractors. All co-authors contributed to the writing and the revising of the manuscript.
Acknowledgement. We acknowledge the E-OBS dataset from
the EU-FP6 project ENSEMBLES (http://ensembles-eu.
(Tharandt), Bernard Longdoz (Hesse) and Denis Loustau (Le Bray) for contributing data to this study. This research was funded by the Belgian Federal Science Policy Office under the BRAIN.be program as MASC contract no. BR/121/A2 and supported by the research project no. BR/132/A1/FORBIOCLIMATE. The authors thank A. L. Hirsch and the anonymous referee for their valuable suggestions to improve the manuscript notably. The authors also like to thank Annelies Duerinckx (Royal Meteorological Institute of Belgium, Brussels) for the fruitful discussions.
Edited by: D. Lawrence
Reviewed by: A. L. Hirsch and one anonymous referee
References
ALADIN International Team: The ALADIN project: Mesoscale modelling seen as a basic tool for weather forecasting and at-mospheric research, WMO Bulletin, 46, 317–324, 1997. Anthes, R. A., Kuo, Y.-H., Hsie, E.-Y., Low-Nam, S., and Bettge, T.
W.: Estimation skill and uncertainty in regional numerical mod-els, Q. J. Roy. Meteor. Soc., 115, 763–806, 1989.
Aubinet, M., Grelle, A., Ibrom, A., Rannik, U., Moncrieff, J., Fo-ken, T., Kowalski, A. S., Martin, P. H., Berbigier, P., Bernhofer, Ch., Clement, R., Elbers, J., Granier, A., Grünwald, T., Morgen-stern, K., Pilegaard, K., Rebmann, C., Snijders, W., Valentini, R., and Vesala, T.: Estimates of the annual net carbon and water exchange of forests: the EUROFLUX methodology, Adv. Ecol. Res., 30, 113–175, 1999.
Baldocchi, D., Falge, E., Lianhong, G., Olson, R., Hollinger, D., Running, S., Anthoni, P., Bernhofer, Ch., Davis, K., Evans, R., Fuentes, J., Goldstein, A., Katul, G., Law, B., Lee, X., Malhi, Y., Meyers, T., Munger, W., Oechel, W., Paw, K. T., Pilegaard, K., Schmid, H. P., Valentini, R., Verma, S., Vesala, T., Wilson, K., and Wofsy, S.: FLUXNET: a new tool to study the temporal and spatial variability of ecosystem-scale carbon dioxide, water va-por and energy flux densities, B. Am. Meteorol. Soc., 82, 2415– 2435, 2001.
Best, M. J., Beljaars, A., Polcher, J., and Viterbo, P.: A proposed structure for coupling tiled surfaces with the planetary boundary layer, J. Hydrometeorol., 5, 1271–1278, 2004.
Boone, A. and Wetzel, P. J.: A simple method for modeling sub-grid soil texture variability for use in an atmospheric climate model, J. Meteorol. Soc. Jpn., 77, 317–333, 1999.
Bowen, I. S.: The ratio of heat losses by conduction and by evap-oration from any water surface, Phys. Rev. Lett., 27, 779–787, 1926.
Bubnová, R., Hello, G., Bénard, P., and Geleyn, J.-F.: Integration of the fully elastic equations cast in the hydrostatic pressure terrain-following coordinate in the framework of the ARPEGE/Aladin NWP system, Mon. Weather Rev., 123, 515–535, 1995. Christensen, J. H., Carter, T. R., Rummukainen, M., and
Amana-tidis, G.: Evaluating the performance and utility of regional cli-mate models: the PRUDENCE project, Clicli-mate Change, 81, 1–6, 2007.
Davies, H. C.: A lateral boundary formulation for multi-level pre-diction models, Q. J. Roy. Meteor. Soc., 102, 405–418, 1976. De Troch, R., Hamdi, R., Van De Vyver, H., Geleyn, J.-F., and
Termonia, P.: Multiscale performance of the ALARO-0 Model
for simulating extreme summer precipitation climatology in Bel-gium, J. Climate, 26, 8895–8915, 2013.
Dee, D. P., Uppala, S. M., Simmons, A. J., Berrisford, P., Poli, P., Kobayashi, S., Andrae, U., Balmaseda, M. A., Balsamo, G., Bauer, P., Bechtold, P., Beljaars, A. C. M., van de Berg, L., Bid-lot, J., Bormann, N., Delsol, C., Dragani, R., Fuentes, M., Geer, A. J., Haimberger, L., Healy, S. B., Hersbach, H., Hólm, E. V., Isaksen, L., Kållberg, P., Köhler, M., Matricardi, M., McNally, A. P., Monge-Sanz, B. M., Morcrette, J.-J., Park, B.-K., Peubey, C., de Rosnay, P., Tavolato, C., Thépaut, J.-N., and Vitart, F.: The ERA-Interim reanalysis: configuration and performance of the data assimilation system, Q. J. Roy. Meteor. Soc., 137, 553–597, 2011.
Dickinson, R. E., Errico, R. M., Giorgi, F., and Bates, G. T.: A regional climate model for the Western United States, Clim. Change, 15, 383–422, 1989.
Faggian, P.: Climate Change Projections for Mediterranean Region with Focus over Alpine Region and Italy, J. Environ. Sci. Eng., 4, 482–500, 2015.
Gerard, L.: An integrated package for subgrid convection, clouds and precipitation compatible with the meso-gamma scales, Q. J. Roy. Meteor. Soc., 133, 711–730, 2007.
Gerard, L. and Geleyn, J.-F.: Evolution of a subgrid deep convection parametrization in a limited area model with increasing resolu-tion, Q. J. Roy. Meteor. Soc., 131, 2293–2312, 2005.
Gerard, L., Piriou, J.-M., Brozková, R., Geleyn, J.-F., and Banciu, D.: Cloud and precipitation parameterization in a meso-gamma-scale operational weather prediction model, Mon. Weather Rev., 137, 3960–3977, 2009.
Giorgi, F.: Regional climate modeling: status and perspectives, J. Physics, 139, 101–118, 2006.
Giorgi, F. and Mearns, L. O.: Introduction to special section: re-gional climate modeling revisited, J. Geophys. Res., 104, 6335– 6352, 1999.
Giot, O., Termonia, P., Degrauwe, D., De Troch, R., Caluwaerts, S., Smet, G., Berckmans, J., Deckmyn, A., De Cruz, L., De Meut-ter, P., Duerinckx, A., Gerard, L., Hamdi, R., Van den Bergh, J., Van Ginderachter, M., and Van Schaeybroeck, B.: Validation of the ALARO-0 model within the EURO-CORDEX framework, Geosci. Model Dev., 9, 1143–1152, doi:10.5194/gmd-9-1143-2016, 2016.
Hamdi, R., Van de Vyver, H., and Termonia, P.: New cloud and mi-crophysics parameterisation for use in high-resolution dynamical downscaling: application for summer extreme temperature over Belgium, Int. J. Climatol., 32, 2051–2065, 2012.
Hamdi, R., Degrauwe, D., Duerinckx, A., Cedilnik, J., Costa, V., Dalkilic, T., Essaouini, K., Jerczynki, M., Kocaman, F., Kull-mann, L., Mahfouf, J.-F., Meier, F., Sassi, M., Schneider, S., Vána, F., and Termonia, P.: Evaluating the performance of SURFEXv5 as a new land surface scheme for the ALAD-INcy36 and ALARO-0 models, Geosci. Model Dev., 7, 23–39, doi:10.5194/gmd-7-23-2014, 2014.
Haylock, M. R., Hofstra, N., Klein Tank, A. M. G., Klok, E. J., Jones, P. D., and New, M.: A European daily high-resolution gridded data set of surface temperature and pre-cipitation for 1950-2006, J. Geophys. Res., 113, D20119, doi:10.1029/2008JD010201, 2008.
G., Georgopoulou, E., Gobiet, A., Menut, L., Nikulin, G., Haensler, A., Hempelmann, N., Jones, C., Keuler, K., Kovats, S., Kröner, N., Kotlarski, S., Kriegsmann, A., Martin, E., van Mei-jgaard, E., Moseley, C., Pfeifer, S., Preuschmann, S., Raderma-cher, C., Radtke, K., Rechid, D., Rounsevell, M., Samuelsson, P., Somot, S., Soussana, J.-F., Teichmann, C., Valentini, R., Vau-tard, R., Weber, B., and Yiou, P.: EURO-CORDEX: new high-resolution climate change projections for European impact re-search, Reg. Environ. Change, 14, 563–578, 2014.
Jaeger, E. B., Stöckli, R., and Seneviratne, S. I.: Analysis of plane-tary boundary layer fluxes and land-atmosphere coupling in the regional climate model CLM, J. Geophys. Res., 114, 1–15, 2009. Koster, R. D. and Suarez, M. J.: Soil moisture memory in climate
models, J. Hydrometeorology, 2, 558–570, 2001.
Kotlarski, S., Hagemann, S., Krahe, P., Podzun, R., and Jacob, D.: The Elbe river flooding 2002 as seen by an extended regional climate model, J. Hydrology, 472–473, 169–183, 2012. Kotlarski, S., Keuler, K., Christensen, O. B., Colette, A., Déqué,
M., Gobiet, A., Goergen, K., Jacob, D., Lüthi, D., van Meij-gaard, E., Nikulin, G., Schär, C., Teichmann, C., Vautard, R., Warrach-Sagi, K., and Wulfmeyer, V.: Regional climate model-ing on European scales: a joint standard evaluation of the EURO-CORDEX RCM ensemble, Geosci. Model Dev., 7, 1297–1333, doi:10.5194/gmd-7-1297-2014, 2014.
Leung, L. R., Mearns, L. O., Giorgi, F., and Wilby, R. L.: Regional climate research, B. Am. Meteorol. Soc., 84, 89–95, 2003. Lindstedt, D., Lind, P., Kjellström, E., and Jones, C.: A new regional
climate model operating at the meso-gamma scale: performance over Europe, Tellus, 67, 1–23, 2015.
Lo, J. C.-F., Yang, Z.-L., and Pielke Sr., R. A.: Assessment of three dynamical climate downscaling methods using the Weather Re-search and Forecasting (WRF) model, J. Geophys. Res., 113, 1– 16, 2008.
Lucas-Picher, P., Boberg, F., Christensen, J. H., and Berg, P.: Dy-namical downscaling with reinitializations: a method to generate finescale climate datasets suitable for impact studies, J. Hydrom-eteorol., 14, 1159–1174, 2013.
Masson, V.: A physically-based scheme for the urban energy bud-get in atmospheric models, Bound.-Lay. Meteorol., 94, 357–397, 2000.
Masson, V., Champeaux, J.-L., Chauvin, F., Meriguet, C., and La-caze, R.: A global database of land surface parameters at 1 km resolution in meteorological and climate models, J. Climate, 16, 1261–1282, 2003.
Masson, V., Le Moigne, P., Martin, E., Faroux, S., Alias, A., Alkama, R., Belamari, S., Barbu, A., Boone, A., Bouyssel, F., Brousseau, P., Brun, E., Calvet, J.-C., Carrer, D., Decharme, B., Delire, C., Donier, S., Essaouini, K., Gibelin, A.-L., Giordani, H., Habets, F., Jidane, M., Kerdraon, G., Kourzeneva, E., Lafaysse, M., Lafont, S., Lebeaupin Brossier, C., Lemonsu, A., Mahfouf, J.-F., Marguinaud, P., Mokhtari, M., Morin, S., Pigeon, G., Sal-gado, R., Seity, Y., Taillefer, F., Tanguy, G., Tulet, P., Vincendon, B., Vionnet, V., and Voldoire, A.: The SURFEXv7.2 land and ocean surface platform for coupled or offline simulation of earth surface variables and fluxes, Geosci. Model Dev., 6, 929–960, doi:10.5194/gmd-6-929-2013, 2013.
Napoly, A., Boone, A., Samuelsson, P., Gollvik, S., Martin, E., Se-ferian, R., Carrer, D., Decharme, B., and Jarlan, L.: The Interac-tions between Soil-Biosphere-Atmosphere (ISBA) land surface model Multi-Energy Balance (MEB) option in SURFEX – Part 2: Model evaluation for local scale forest sites, Geosci. Model Dev. Discuss., doi:10.5194/gmd-2016-270, in review, 2016. Noilhan, J. and Mahfouf, J.-F.: The ISBA land surface
parameteri-sation scheme, Global Planet. Change, 13, 145–159, 1996. Noilhan, J. and Planton, S.: A simple parameterization of land
sur-face processes for meteorological models, Mon. Weather Rev., 117, 536–549, 1989.
Phillips, N. A.: The general circulation of the atmosphere: a numer-ical experiment, Q. J. Roy. Meteor. Soc., 82, 123–164, 1956. Qian, J.-H., Seth, A., and Zebiak, S.: Reinitialized versus
continu-ous simulations for regional climate downscaling, Mon. Weather Rev., 131, 2857–2874, 2003.
Rauscher, S. A., Coppola, E., Piani, C., and Giorgi, F.: Resolution effects on regional climate model simulations of seasonal precip-itation over Europe, Clim. Dynam., 35, 685–711, 2010. Ritter, B. and Geleyn, J.-F.: A comprehensive radiation scheme for
numerical weather prediction models with potential applications in climate simulations, Mon. Weather Rev., 120, 303–325, 1992. Seneviratne, S. I., Lüthi, D., Litschi, M., and Schär, C.: Land-atmosphere coupling and climate change in Europe, Nature, 443, 205–209, 2006.
Seneviratne, S. I., Corti, T., Davin, E. L., Hirschi, M., Jaeger, E. B., Lehner, I., Orlowsky, B., and Teuling, A. J.: Investigating soil moisture-climate interactions in a changing climate: A review, Earth-Sci. Rev., 99, 125–161, 2010.
Voldoire, A., Sanchez-Gomez, E., Salas y Mélia, D., Decharme, B., Cassou, C., Sénési, S., Valcke, S., Beau, I., Alias, A., Cheva-lier, M., Déqué, M., Deshayes, J., Douville, H., Fernandez, E., Madec, G., Maisonnave, E., Moine, M.-P., Planton, S., Saint-Martin, D., Szopa, S., Tyteca, S., Alkama, R., Belamari, S., Braun, A., Coquart, L., and Chauvin, F.: The CNRM-CM5.1 global climate model: description and basic evaluation, Clim. Dynam., 40, 2091–2121, 2013.
von Storch, H., Langenberg, H., and Feser, F.: A spectral nudging technique for dynamical downscaling purposes, Mon. Weather Rev., 128, 3664–3673, 2000.
Wilson, K., Goldstein, A., Falge, E., Aubinet, M., Baldocchi, D., Berbigier, P., Bernhofer, C., Ceulemans, R., Dolman, H., Field, C., Grelle, A., Ibrom, A., Law, B. E., Kowalski, A., Meyers, T., Moncrieff, J., Monson, R., Oechel, W., Tenhunen, J., Valentini, R., and Verma, S.: Energy balance closure at FLUXNET sites, Agr. Forest Meteorol., 113, 223–243, 2002.