BGD
12, 12229–12279, 2015
Projected climate change impacts on North Sea and Baltic
Sea
D. Pushpadas et al.
Title Page
Abstract Introduction
Conclusions References
Tables Figures
◭ ◮
◭ ◮
Back Close
Full Screen / Esc
Printer-friendly Version Interactive Discussion
Discussion
P
a
per
|
Discussion
P
a
per
|
Discussion
P
a
per
|
Discussion
P
a
per
Biogeosciences Discuss., 12, 12229–12279, 2015 www.biogeosciences-discuss.net/12/12229/2015/ doi:10.5194/bgd-12-12229-2015
© Author(s) 2015. CC Attribution 3.0 License.
This discussion paper is/has been under review for the journal Biogeosciences (BG). Please refer to the corresponding final paper in BG if available.
Projected climate change impacts on
North Sea and Baltic Sea: CMIP3 and
CMIP5 model based scenarios
D. Pushpadas1,2, C. Schrum1,2, and U. Daewel1,2 1
Geophysical Institute, University of Bergen and Bjerknes Center for Climate Research, Bergen, Norway
2
Nansen Environmental and Remote Sensing Center and Bjerknes Center for Climate Research, Thormøhlens gate 47, Bergen, Norway
Received: 23 June 2015 – Accepted: 10 July 2015 – Published: 6 August 2015
Correspondence to: D. Pushpadas ([email protected])
BGD
12, 12229–12279, 2015
Projected climate change impacts on North Sea and Baltic
Sea
D. Pushpadas et al.
Title Page
Abstract Introduction
Conclusions References
Tables Figures
◭ ◮
◭ ◮
Back Close
Full Screen / Esc
Printer-friendly Version Interactive Discussion
Discussion
P
a
per
|
Discussion
P
a
per
|
Discussion
P
a
per
|
Discussion
P
a
per
Abstract
Climate change impacts on the marine biogeochemistry and lower trophic level dynam-ics in the North Sea and Baltic Sea have been assessed using regional downscaling in a number of recent studies. However, most of these where only forced by physical con-ditions from Global Climate Models (GCMs) and regional downscaling considering the
5
climate change impact on oceanic nutrient conditions from Global Earth System Mod-els (ESMs) are rare and so far solely based on CMIP3-generation climate modMod-els. The few studies published show a large range in projected future primary production and hy-drodynamic condition. With the addition of CMIP5 models and scenarios, the demand to explore the uncertainty in regional climate change projections increased. Moreover,
10
the question arises how projections based on CMIP5-generation models compare to earlier projections and multi-model ensembles comprising both AR4 and AR5 genera-tion forcing models. Here, we investigated the potential future climate change impacts to the North Sea and the Baltic Sea ecosystem using a coherent regional downscaling strategy based on the regional coupled bio-physical model ECOSMO. ECOSMO was
15
forced by output from different ESMs from both CMIP3 and CMIP5 models. Multi-model
ensembles using CMIP3/A1B and CMIP5/RCP4.5 scenarios are examined, where the selected CMIP5 models are the successors of the chosen CMIP3 models. Compar-ing projected changes with the present day reference condition, all these simulations predicted an increase in Sea Surface Temperature (SST) in both North Sea and Baltic
20
Sea, reduction in sea ice in the Baltic, decrease in primary production in the North Sea and an increase in primary production in the Baltic Sea. Despite these largely con-sistent results on the direction of the projected changes, our results revealed a broad range in the amplitude of projected climate change impacts. Our study strengthens the claim that the choice of the ESM is a major factor for regional climate projections.
25
pro-BGD
12, 12229–12279, 2015
Projected climate change impacts on North Sea and Baltic
Sea
D. Pushpadas et al.
Title Page
Abstract Introduction
Conclusions References
Tables Figures
◭ ◮
◭ ◮
Back Close
Full Screen / Esc
Printer-friendly Version Interactive Discussion
Discussion
P
a
per
|
Discussion
P
a
per
|
Discussion
P
a
per
|
Discussion
P
a
per
jected changes among CMIP5 forced model simulations compared to those forced by CMIP3 ESMs, except for salinity. The latter was due to an unexpected salinification observed in one of the CMIP5 model while all other models exhibit freshening in the future. However, for the Baltic Sea substantial differences in inter-model variability in
projected climate change impact to primary production is lacking.
5
1 Introduction
The interconnected coastal seas North Sea and Baltic Sea are surrounded by densely populated highly industrialized countries. Despite being in the same geographic vicinity, their hydrodynamic and biogeochemical processes differ substantially (Rodhe, 1998;
Rodhe et al., 2006). The Baltic Sea is a mediterranean sea, the sea mostly surrounded
10
by land (Sverdrup et al., 1942), with restricted and shallow connection to the North Sea, which limits the exchange of water significantly. Tidal forcing in the Baltic is con-sequently weak. The circulation in the Baltic Sea is of estuarine type and the Baltic Sea is stratified year round with a fresh surface layer and saltier lower layer. In addition to thermal stratification in summer, high freshwater content and low salinities favour the
15
development of a winter thermocline and sea ice. Thermal stratification reverses in win-ter with colder wawin-ter being lighwin-ter than warmer wawin-ter that has implications for the timing of spring bloom in the Baltic Sea (Fennel, 1999). Renewal of Baltic Sea deep water happens only occasionally through so-called Major Baltic Inflows (MBIs) (Gustafsson, 1997; Omstedt et al., 2004) and characteristic exchange time scales of the Baltic Sea
20
are in the order of 2–3 decades (Rodhe et al., 2006; Omstedt and Hansson, 2006). In contrast, the North Sea, an adjacent sea i.e. connected to ocean but semi-enclosed by land (Sverdrup et al., 1942), is strongly controlled by the North Atlantic influence with pronounced co-oscillating tides and substantial inflows, which favour short char-acteristic time scales of a couple of months. The North Sea is only seasonally stratified
25
BGD
12, 12229–12279, 2015
Projected climate change impacts on North Sea and Baltic
Sea
D. Pushpadas et al.
Title Page
Abstract Introduction
Conclusions References
Tables Figures
◭ ◮
◭ ◮
Back Close
Full Screen / Esc
Printer-friendly Version Interactive Discussion
Discussion
P
a
per
|
Discussion
P
a
per
|
Discussion
P
a
per
|
Discussion
P
a
per
frontal system develops (Simpson and Hunter, 1974), which separates stratified from tidally well-mixed coastal areas in the southern North Sea. In the western North Sea these are mainly tidal mixing fronts whereby fronts along the continental coast are combined freshwater and tidal mixing fronts.
The ecosystems in both seas have been shown to be vulnerable to climate
varia-5
tion in the past (Alheit et al., 2005; Beaugrand and Reid, 2003; Daewel and Schrum, 2013) and potential future climate impacts are to be expected. Through the devel-opment of targeted scenarios, global climate models (GCMs) are the major scientific tools to investigate future climate change caused by an anthropogenic increase of CO2 concentrations in the atmosphere. The World Climate Research Program (WCRP)
de-10
velops global climate projections through its Coupled Model Inter-comparison Project (CMIP) around every 5 to 7 years. The projections from CMIP phase 3 (CMIP3) (Meehl et al., 2007), which are using the so called SRES emission scenarios (Special Report on Emission Scenarios) (Nakicenovic et al., 2000), are documented in the Intergov-ernmental Panel on Climate Change (IPCC) Fourth Assessment (AR4) report (IPCC,
15
2007). The CMIP3 scenarios were widely used for a large variety of climate change impact studies on global and regional scales. The most recent projections from CMIP phase 5 (CMIP5) (Taylor et al., 2012) were generated based on a set of new GCMs and a new set of radiative forcing scenarios (RCPs) (van Vuuren et al., 2011; Knutti and Sedlacek, 2013), that reflect varying degrees of advancement in climate science
20
and modelling since CMIP3, and is detailed in the IPCC Fifth Assessment (AR5) report (IPCC, 2013).
Global biogeochemical impacts of climate variations were estimated through Global Earth System Models (ESMs) implemented for the same scenarios (CMIP3 and CMIP5). Based on these simulations, it was found that increasing CO2concentrations
25
im-BGD
12, 12229–12279, 2015
Projected climate change impacts on North Sea and Baltic
Sea
D. Pushpadas et al.
Title Page
Abstract Introduction
Conclusions References
Tables Figures
◭ ◮
◭ ◮
Back Close
Full Screen / Esc
Printer-friendly Version Interactive Discussion
Discussion
P
a
per
|
Discussion
P
a
per
|
Discussion
P
a
per
|
Discussion
P
a
per
plications for higher trophic levels. Although most of the projected changes exhibited a decrease in primary production, a wide range of uncertainties exist in both CMIP3 as well as CMIP5 projections (Steinacher et al., 2010; Bopp et al., 2013) and this demands considerable attention while using these models to force regional impact models. Fu-ture changes in coastal and regional sea ecosystems are of particular interest due to
5
their socio-economic relevance (e.g. Watson and Pauly, 2001). The need for develop-ing downscaled climate projections for the regional seas arises, as the resolution of GCMs is still too coarse to support local impacts assessment.
A number of regional climate downscaling and sensitivity studies have been per-formed for the North Sea and Baltic Sea (a.o. Meier et al., 2006; Ådlandsvik and
10
Bentsen, 2007; Ådlandsvik, 2008; Holt et al., 2010; Neumann, 2010; Skogen et al., 2011; Hordoir and Meier, 2011; Holt et al., 2012, 2014; Gröger et al., 2013; Mathis et al., 2013; Chust et al., 2014). These have been reviewed and are under assess-ment through the Baltic Sea Climate Change Assessassess-ment (BACC, 2008; BACC, 2015; http://www.baltex-research.eu/BACC/) and North Sea Climate Change Assessment
15
(NOSCCA, 2015; http://noscca.hzg.de/). These review attempts highlighted consistent patterns of projected future increase in sea level, ocean acidification and tempera-ture. Projected changes however were sensitive to the forcing global climate model, the regional downscaling model and the downscaling approach employed. Changes in regional primary production, fresh water content and ocean salinity appeared to be
20
more uncertain and the spread in projected changes appeared to be quite large among different projections.
With the addition of CMIP5 models and scenarios that are expected to provide more detailed and more reliable projections, it is vital to use both CMIP3 and CMIP5 models and scenarios for regional downscaling to test the robustness of the results.
Follow-25
BGD
12, 12229–12279, 2015
Projected climate change impacts on North Sea and Baltic
Sea
D. Pushpadas et al.
Title Page
Abstract Introduction
Conclusions References
Tables Figures
◭ ◮
◭ ◮
Back Close
Full Screen / Esc
Printer-friendly Version Interactive Discussion
Discussion
P
a
per
|
Discussion
P
a
per
|
Discussion
P
a
per
|
Discussion
P
a
per
based on CMIP3 and CMIP5 scenarios in the North Sea and Baltic Sea ecosystems, with the objective to provide more reliable and robust regional information on climate change response for North Sea and Baltic Sea based on various ESMs utilizing the regional model ECOSMO. We will further explore the range of uncertainties for both regional seas, identify consistent patterns and detect conflicting results, to serve future
5
studies dealing with regional potential climate change impacts. To our knowledge, this work is the first attempt so far to utilize CMIP5 models and scenarios for the North Sea and Baltic Sea physical-biogeochemical system.
2 Models, scenarios and methods
We will apply a regional downscaling approach to the North Sea/Baltic Sea system and
10
perform regional ensemble simulations for the A1B/CMIP3 and RCP4.5/CMIP5 climate change scenarios. The regional model used, the utilized forcing global models and the downscaling approach applied are in more detailed described in the following.
2.1 Regional Model ECOSMO
The ECOSystem MOdel (ECOSMO) used in this study is a 3-D coupled
bio-physical-15
sea ice model originally developed for the North Sea (Schrum et al., 2006a, b). The hydrodynamic component of the model is based on the nonlinear primitive equation model HAMSOM (HAMburg Shelf Ocean Model, Schrum and Backhaus, 1999). HAM-SOM was applied to the North Sea and Baltic Sea (Schrum, 1997; Fig. 1) and the model performance was assessed for a variety of hydrodynamic parameters (Janssen et al.,
20
2001). Recently, Barthel et al. (2012) further improved the numerical schemes by incor-porating a total variation diminishing (TVD) advection scheme, which is less diffusive
compared to the previously used upwind scheme. Barthel et al. (2012) demonstrated that the TVD advection scheme enables more realistic simulation of frontal structures, thereby resolving better physical and biological ecosystem dynamics. The ecosystem
BGD
12, 12229–12279, 2015
Projected climate change impacts on North Sea and Baltic
Sea
D. Pushpadas et al.
Title Page
Abstract Introduction
Conclusions References
Tables Figures
◭ ◮
◭ ◮
Back Close
Full Screen / Esc
Printer-friendly Version Interactive Discussion
Discussion
P
a
per
|
Discussion
P
a
per
|
Discussion
P
a
per
|
Discussion
P
a
per
component of the model has been further developed by Daewel and Schrum (2013) and was extended to resolve also the relevant biogeochemical processes in the Baltic Sea. The authors assessed the performance of the upgraded model against obser-vations and verified that the model is capable to realistically simulate both temporal and spatial variations in hydrodynamics and biogeochemistry in both seas, and that
5
the model is able to mimic the regime shifts observed in both seas. In the present study, we used the state of the art ECOSMO model to study the future projected cli-mate change impacts on marine ecosystems of both North Sea and Baltic Sea. Further details of the upgraded ECOSMO model are given in Daewel and Schrum (2013).
2.2 ESMs and scenarios
10
In order to project local changes in marine ecosystems, additional to information on future atmospheric changes and oceanic changes in hydrodynamics and circulation, future changes of the ocean biogeochemistry needs to be considered. Such informa-tion is not included in GCMs but is available from global ESMs. ESM simulainforma-tions are performed by a number of independent research groups worldwide on the basis of
15
scenarios generated for the IPCC AR4 and AR5 assessments. To provide boundary conditions to the future simulation of the regional model we selected 6 ESMs, 3 from CMIP3 and 3 from CMIP5. Our selection criteria are the availability of the ocean bio-geochemical components that can provide necessary boundary conditions, and the ability to compare the results with previous downscaling studies for the study region
20
that used these GCMs. The CMIP3 models selected are BCM, ECHAM5-MPIOM and IPSL-CM4. For the CMIP5 we selected NorESM, MPIESM and IPSLCM5, which are the successors of the chosen CMIP3 models in CMIP5. All selected models show com-paratively reasonable correlation of surface air temperature and wind speed with the NCEP data in the North Sea (not shown here). Further information about the selected
25
models is provided in Table 1.
BGD
12, 12229–12279, 2015
Projected climate change impacts on North Sea and Baltic
Sea
D. Pushpadas et al.
Title Page
Abstract Introduction
Conclusions References
Tables Figures
◭ ◮
◭ ◮
Back Close
Full Screen / Esc
Printer-friendly Version Interactive Discussion
Discussion
P
a
per
|
Discussion
P
a
per
|
Discussion
P
a
per
|
Discussion
P
a
per
regional downscaling to the North Sea and Baltic Sea. The A1B scenario represents a medium emissions scenario associated with increasing greenhouse gases through the end of the 21st century (balanced emphasis on all energy sources, CO2 concentra-tion is projected to reach 720 ppm by 2100). For the CMIP5 scenarios we selected the RCP 4.5 scenario (Moss et al., 2010; Van Vuuren et al., 2011), which is slightly weaker
5
in terms of assumed atmospheric CO2 concentration and is consequently slightly less “warm” than the A1B scenario. RCP 4.5 is a stabilization scenario and thus adopts the imposition of emissions mitigation policies and is defined as a scenario of long-term, global emissions of green gases, short-lived species, and land-use, which stabilizes ra-diative forcing at 4.5 W m−2(approximately 650 ppm CO
2-equivalent) in the year 2100
10
without ever exceeding that value (Van Vuuren et al., 2011; Thomson et al., 2011).
2.3 Delta method
We here assume, that the ESMs simulate the future changes reasonably, despite known biases and uncertainties. Similar as done in previous downscaling studies (Chust et al.; 2014; Holt et al., 2014) we utilize the “Delta Method” or “Perturbation
15
Method” (Prudhomme et al., 2002) for the downscaling. The method implies that the mean climatic change between the ESM simulations for future and reference time pe-riod are added to the baseline run (reference simulation) forcing. Applying the Delta Method instead of direct forcing has the advantage that a validated hindcast simula-tion such as the one presented by Daewel and Schrum (2013) serves as the reference
20
state and, that the GCM bias becomes irrelevant. The Delta Method thereby works as a bias correction method (Teutschbein and Seibert, 2013) and several ESMs can relatively easy be used and applied to the regional simulations to produce a range of climate scenarios. Thus, the comparison of ensemble members is not further compli-cated by different GCM bias, which would influence the regional sensitivity to climate
25
BGD
12, 12229–12279, 2015
Projected climate change impacts on North Sea and Baltic
Sea
D. Pushpadas et al.
Title Page
Abstract Introduction
Conclusions References
Tables Figures
◭ ◮
◭ ◮
Back Close
Full Screen / Esc
Printer-friendly Version Interactive Discussion
Discussion
P
a
per
|
Discussion
P
a
per
|
Discussion
P
a
per
|
Discussion
P
a
per
for the latter one, which allowed us a larger number of scenarios. The major limitation of this method is that potential changes in inter-annual variability are not considered and potential changes in the appearance of extreme events are not correctly repre-sented within the future simulations (Diaz-Nieto and Willby, 2005). For our purpose this was less important, since we are mainly interested in climatic mean changes and
inter-5
model variability of these and will not depict changes in variance and extremes. Here we will discuss averages for i.e. 30 years, the classical climate period as defined by the World Meteorological Organization (WMO), with respect to future and past.
We selected 1970–1999 as a reference period and 2070–2099 for future simulations. For the reference simulation we used a setup similar to the one described by Daewel
10
and Schrum (2013) with NCEP Reanalysis data (Kalnay et al., 1996) as atmospheric surface boundary. At the open boundaries to the North Atlantic Ocean the model is dynamically forced using daily sea surface variations from a coarser diagnostic model (Backhaus and Hainbucher, 1987). In addition, tidally induced sea surface variations from the 8 major tidal constituents (M2, S2, N2, K2,µ2, K1, O1, P1) are considered
15
with a 20 min time step. Boundary conditions for salinities are based on the climatology from Janssen et al. (1999) and added annual variations calculated from data available at the ICES database for the reference period. For temperature as well as the remain-ing biological variables a Sommerfeld radiation condition is applied (Orlanski, 1976). At the land–ocean interface time varying (monthly resolution) freshwater runoffand river
20
nutrient loads are prescribed to force the model and atmospheric nitrogen wet depo-sition is considered. Further details about the data used are available in Daewel and Schrum (2013).
For the future scenario simulations we added the monthly averaged climatic mean change (∆Φ(x,y,t∗)) between the two periods to the atmospheric, oceanic and
bio-25
logical boundary variables (∆Φ(x,y,t∗)=[10 mu,v wind speed components, air
BGD
12, 12229–12279, 2015
Projected climate change impacts on North Sea and Baltic
Sea
D. Pushpadas et al.
Title Page
Abstract Introduction
Conclusions References
Tables Figures
◭ ◮
◭ ◮
Back Close
Full Screen / Esc
Printer-friendly Version Interactive Discussion
Discussion
P
a
per
|
Discussion
P
a
per
|
Discussion
P
a
per
|
Discussion
P
a
per
nutrients]) from each of the ESMs such as
Φf(x,y,t)= ΦRef(x,y,t)+ ∆Φ(x,y,t∗) ∆Φ(x,y,t∗)= Φ
A1B/RCP4.5(x,y,t∗)−ΦCNTRL(x,y,t∗)
withx,y =horizontal grid nodes,t=time step. Since the inter-annual time variability is
not related in the ESMs and reference simulation, an appropriate time averagingt∗is
5
considered. Here we apply monthly changes.
For this study, we have kept the initial condition as well as river runoff and river
nutrient loads for the future projection unchanged compared to the reference forcing and we consider only the atmospheric and oceanic boundary change impacts and neglect terrestrial climate change impacts for both the freshwater changes and nutrient
10
loads.
On climatic time scales, the initial condition is of minor relevance for the regions, par-ticularly in the North Sea as its characteristic time scale is very short (Rodhe, 1998), within a couple of months the North Sea adapts to actual forcing conditions; though it is a concern for the Baltic Sea since the Baltic Sea is unbalanced with the climate
15
change forcing due to its longer response time (about 30 years). However, the coarse resolution of the ocean in most of the ESMs lead to a relatively poor representation of the Baltic Sea (Schimanke et al., 2012), therefore we hypothesize that initial conditions from ESMs cannot be considered as an improvement. Daewel and Schrum (2013) in-vestigated the impact of different initial conditions to the response of the Baltic Sea
20
to present day climatic forcing. They found, that the duration of the spinup and actual initial condition had little influence to the total production and its change between 2 different climatic periods. Differences in primary production between the runs with dif-ferent spinup periods disappeared after a few years almost completely. Initial conditions derived from coarse resolution climatology had in contrast larger impacts in form of an
25
BGD
12, 12229–12279, 2015
Projected climate change impacts on North Sea and Baltic
Sea
D. Pushpadas et al.
Title Page
Abstract Introduction
Conclusions References
Tables Figures
◭ ◮
◭ ◮
Back Close
Full Screen / Esc
Printer-friendly Version Interactive Discussion
Discussion
P
a
per
|
Discussion
P
a
per
|
Discussion
P
a
per
|
Discussion
P
a
per
changes in initial condition is small on projected changes in primary production in the North Sea and acceptable for our purpose in the Baltic Sea.
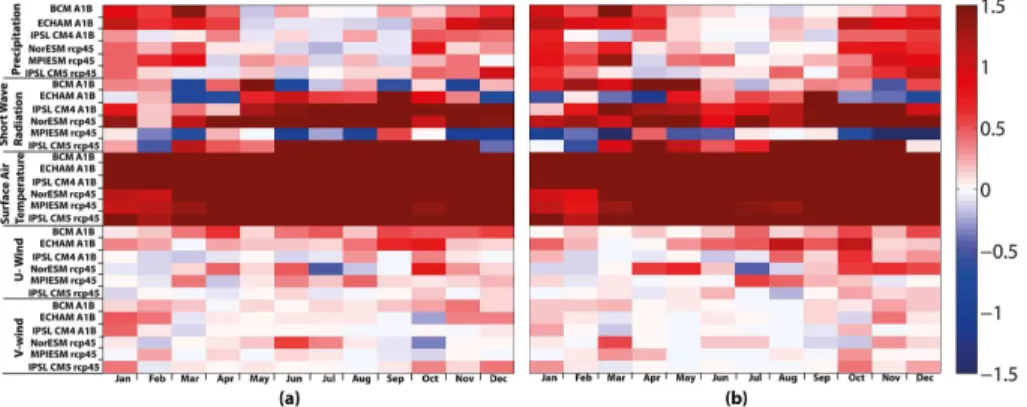
In Fig. 2a and b the estimated monthly climatic mean changes of the atmospheric parameters are displayed expressed in terms of the ratio between the projected at-mospheric change and the standard deviation (reference period, monthly values) for
5
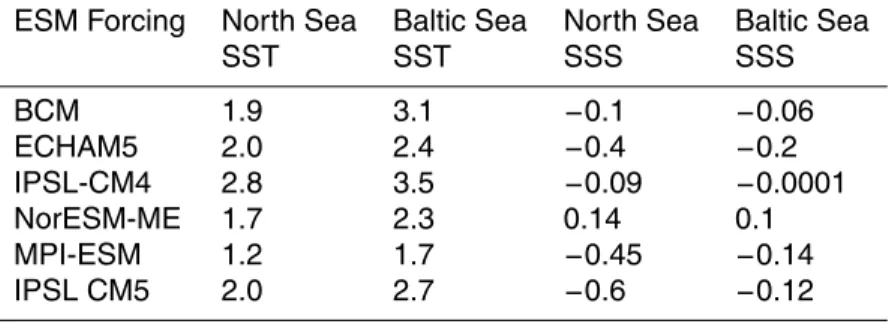
the respective atmospheric parameter. The values are presented as area averages for the North Sea and Baltic Sea in monthly resolution respectively. Table 2 summarizes the annual mean statistically significant changes for both seas. A two-sampleT test is used to investigate the significance of the climatic mean changes. The null hypothesis is rejected at 5 % significance level (p <0.05). All ESM’s show significant and
consis-10
tent changes in surface air temperature and dew point temperature and precipitation. However for the majority of other parameters changes, particularly wind changes are inconsistent or not statistically significant for a number of models. This is consistent to previous results evaluating a larger ensemble of CMIP5 models (Sterl et al., 2015). We found here however, additionally a consistent increase in the westerly wind
com-15
ponent in autumn. Regional changes vary with each parameter and season. There appears to be a slightly higher temperature response in winter in CMIP3 models com-pared to CMIP5 models. This can predominantly be accredited to the slightly higher CO2 concentration in the A1B scenario compared to the RCP 4.5 scenario for the end of the century. Furthermore, both CMIP3 and CMIP5 models project an increase in
20
future winter precipitation for both regions. For the summer precipitation, in contrast, the projections are less consistent and project both a decrease and an increase. Wind speeds show slight positive and negative variation in both regions with respect to indi-vidual ESM projections, while the change in the zonal component is stronger than in the meridional component.
25
discrep-BGD
12, 12229–12279, 2015
Projected climate change impacts on North Sea and Baltic
Sea
D. Pushpadas et al.
Title Page
Abstract Introduction
Conclusions References
Tables Figures
◭ ◮
◭ ◮
Back Close
Full Screen / Esc
Printer-friendly Version Interactive Discussion
Discussion
P
a
per
|
Discussion
P
a
per
|
Discussion
P
a
per
|
Discussion
P
a
per
ancies among the selected models, the CMIP5 models are more consistent in the jected temperature increase. In contrast, the ESMs show a remarkable increase in pro-jected ranges of salinity change from CMIP3 to CMIP5. Salinity decreases in the future projections for all ESM ensemble members except NorESM, which shows a prominent increase in salinity. All ESMs show a substantial decrease in nutrient concentration for
5
both surface layer and deep layer (not shown) for the entire seasonal cycle except the IPSL-CM5 model, which reveal a small increase of nitrate and phosphate after summer (August and September) and a significant increase of silicate during summer and au-tumn (JJASO) (not shown). Large variability in projected regional nutrients and salinity changes among both CMIP3 and CMIP5 models enhances the notion that the increase
10
in robustness of regional projected changes from CMIP5 compared to CMIP3 models for our investigated mini-ensemble is mainly constricted to temperature projections.
3 Results and discussions
In the following section, we present the downscaled climate change impact for the North Sea and the Baltic Sea for the end of the century. We present ensemble mean changes
15
in state variables (temperature, salinity, sea ice), mixed layer depth and primary and secondary production for CMIP3 and CMIP 5 scenarios and assess the spread for both ensembles. The lack of common forcing CO2scenarios makes a direct CMIP3-CMIP5 comparison difficult and the scenario differences should be kept in mind. We structure
the presentation of our results to firstly present the change in physical state variables
20
and their inter-model ranges and present changes in biological production afterwards.
3.1 Projected changes in temperature, salinity, sea ice extend and stratification
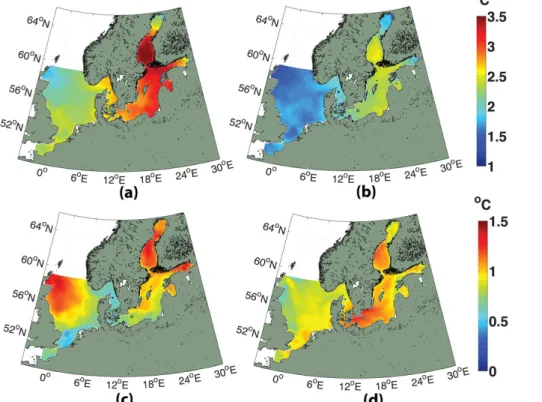
Figure 4 provides the ensemble mean change (Fig. 4a and b) of the annual Sea Surface Temperature (SST) for both CMIP3 and CMIP5 scenarios together with the ensemble spread (Fig. 4c and d) for both scenarios. Using a two-sampleT test, we identified the
BGD
12, 12229–12279, 2015
Projected climate change impacts on North Sea and Baltic
Sea
D. Pushpadas et al.
Title Page
Abstract Introduction
Conclusions References
Tables Figures
◭ ◮
◭ ◮
Back Close
Full Screen / Esc
Printer-friendly Version Interactive Discussion
Discussion
P
a
per
|
Discussion
P
a
per
|
Discussion
P
a
per
|
Discussion
P
a
per
projected change as statistically significant everywhere (p <0.05) when comparing to the present day reference. Similar to the changes in ocean and atmospheric boundary conditions (Figs. 2a, b and 3a), the regional model projects a statistically significant ensemble mean increase in SST. The Baltic Sea exhibits a stronger warming com-pared to the North Sea, which can be explained by the higher surface air temperature
5
changes in that region (Fig. 2a and b). Further, the average increase in SST in the CMIP3 simulations (∼2.3◦C in the North Sea and ∼3.3◦C in the Baltic Sea) is
con-siderably larger than the projected increase for the CMIP5 scenarios (∼1.7◦C in the
North Sea and∼2.3◦C in the Baltic Sea), which is consistent with the slightly lower
ra-diative forcing in the RCP4.5 scenario compared to the A1B scenario. Annual and area
10
averaged SST changes for North Sea and Baltic Sea are provided for all ensemble members in Table 3. Projected changes show a large spread in projected temperature change in dependence of the forcing ESM. Projected SST in the North Sea in CMIP3 projections unveil a larger spread relative to the spread in CMIP5 projections, while in the Baltic Sea both CMIP3 and CMIP5 models show rather similar spread. The
inter-15
model spread varies regionally, with the largest spread in CMIP5 forced projections occurring in the Western Baltic and Bothnian Sea. The regional projections based on CMIP3 forcing show largest spread for the northwestern North Sea, the Gulf of Fin-land and Gulf of Bothnia. The projected increase in North Sea SST by our study is consistent with the results from previous studies for the North Sea (NOSCCA, Schrum
20
et al., 2015), which projected an increase between 1–3◦C for the North Sea for the
A1B scenario using different global and regional models (Holt et al., 2014; Chust et al.,
2014; Mathis, 2013; Gröger et al., 2013; Bülow et al., 2014). From these studies, it was evident that the major contribution to variations in projected changes arises from the choice of the global model (Schrum et al., 2015; Holt et al., 2014). Similar to Holt
25
BGD
12, 12229–12279, 2015
Projected climate change impacts on North Sea and Baltic
Sea
D. Pushpadas et al.
Title Page
Abstract Introduction
Conclusions References
Tables Figures
◭ ◮
◭ ◮
Back Close
Full Screen / Esc
Printer-friendly Version Interactive Discussion
Discussion
P
a
per
|
Discussion
P
a
per
|
Discussion
P
a
per
|
Discussion
P
a
per
the North Sea, this is consistent with the outcome from earlier published studies (Holt et al., 2012, 2014; Gröger et al., 2013; Bülow et al., 2014). Compared to the North Sea, the Baltic Sea is projected to warm more following the projected stronger warming in air temperature in the Baltic (Fig. 2a and b). The somewhat stronger warming for the Baltic Sea compared to the North Sea is comparable to earlier published scenarios
5
for the Baltic Sea based on the A1B scenario (Neumann, 2010; Meier, 2006; BACC, 2006; Holt et al., 2014). The CMIP5 forced scenario simulations (RCP4.5) show similar response to the warming amplitude of the forcing global model. The strongest warming in CMIP5 is simulated in both regions using the IPSL-CM5 forcing, while the weakest warming was simulated using the forcing from MPI-ESM.
10
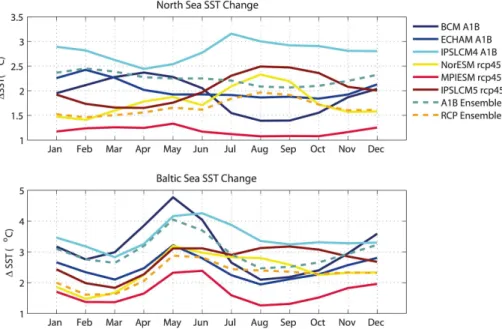
The seasonality of area mean changes in North Sea and Baltic Sea SST is presented in Fig. 5. It is difficult to fathom the seasonality from area-averaged values since the
mean changes in SST vary with season, region and for the ensemble members. The seasonal amplitude of the ensemble mean projected change in CMIP3 ensemble mean is small (<0.4◦C) in the North Sea. Here, the CMIP3-ensemble mean projected SST
15
change is largest in February. The minimum in ensemble mean SST change is simu-lated for August/September. In Contrast to the CMIP3 ensemble mean, seasonal SST changes in the CMIP5 ensemble mean show highest variability in August and lowest in winter in the North Sea.
For the Baltic Sea, the seasonality in projected SST change differs compared to
20
the North Sea for both ensembles. Ensemble mean SST change is highest in May for both, the CMIP3 and CMIP5 ensemble. A second local maximum in SST is mod-elled for December/January for the CMIP3 ensemble mean. For the CMIP3 ensemble mean, the lowest changes in SST are projected for August with a second minimum in February/March. The lowest changes in CMIP5 occur in February/March. Smaller SST
25
BGD
12, 12229–12279, 2015
Projected climate change impacts on North Sea and Baltic
Sea
D. Pushpadas et al.
Title Page
Abstract Introduction
Conclusions References
Tables Figures
◭ ◮
◭ ◮
Back Close
Full Screen / Esc
Printer-friendly Version Interactive Discussion
Discussion
P
a
per
|
Discussion
P
a
per
|
Discussion
P
a
per
|
Discussion
P
a
per
Due to warming of the winter temperature, the maximum sea-ice-extend in the Baltic Sea is expected to decrease. Figure 6 shows projected changes in maximum ice cov-ered area and seasonality of sea ice in the Baltic Sea. As expected all simulations display a significant reduction in sea ice extent, but show discrepancies in the degree of reduction. Projected reduction in sea ice extent with respect to reference simulation
5
range from 49 to 73 % with the strongest decrease projected by the IPSLCM4 model, the model which projects also the strongest warming. Generally, CMIP3 models show a stronger reduction of sea ice compared to CMPI5, which is consistent with the some-what warmer scenarios. However, none of the simulations project an ice-free winter by the end of the century. These results agree in general with earlier studies by Meier
10
(2006) and Neumann (2010).
The North Sea salinity is influenced by the imbalance of precipitation-evaporation, terrestrial runoffand exchange with the North Atlantic and Baltic Sea, while salinity in
the Baltic Sea is controlled by terrestrial runoff, imbalance of precipitation-evaporation
and inflow from North Sea. Projected sea surface salinity (SSS) changes are less
con-15
sistent than that of SST and sea ice extend. The ensemble means show a reduction in salinity for the North Sea and the Baltic Sea for both, the CMIP3 and CMIP5 sce-narios (Fig. 7a and b), A two-sampleT test is used on the annual averages from the 30 years time periods to determine the significance (at the 5 % level). However, the pro-jected changes vary strongly with the parent ESM forcing, and an exceptional increase
20
in SSS is projected while using forcing from the NorESM. This exceptional increase leads to an increasing inter-model spread from CMIP3 to CMIP5 scenarios (Fig. 7c, d and Table 3). Annual and area averaged SSS change for North Sea and Baltic Sea (provided for the individual projections in Table 3) illustrates the wide spread arising from the different parent GCMs. It should be noted that local changes and spread are
25
BGD
12, 12229–12279, 2015
Projected climate change impacts on North Sea and Baltic
Sea
D. Pushpadas et al.
Title Page
Abstract Introduction
Conclusions References
Tables Figures
◭ ◮
◭ ◮
Back Close
Full Screen / Esc
Printer-friendly Version Interactive Discussion
Discussion
P
a
per
|
Discussion
P
a
per
|
Discussion
P
a
per
|
Discussion
P
a
per
Riga. Also parts of the central Baltic Sea changes are not statistically significant, and the respective area is increasing from CMIP3 (Fig. 7a) to CMIP5 (Fig. 7b). Average pre-cipitation in all projections show a consistence increase (Fig. 1a and b) and contribute to a regional freshening. For the North Sea, this freshening is amplified for most sce-narios, through the change in oceanic boundary conditions, by remote North Atlantic
5
salinity changes caused by the intensified hydrological cycle (IPCC, 2007). According to our study, North Sea salinity is primarily controlled by North Atlantic water trans-ported into the area, while local precipitation changes also contribute to the salinity changes in the North Sea. Here we neglected changes in runoff, due to lacking
down-scaled information.
10
Our SSS projections with the CMIP3 models are in the same range as projections from previous studies using the A1B scenario, indicating freshening of North Sea and Baltic Sea. (Gröger et al., 2013; Bülow et al., 2014; Meier, 2006; Neumann, 2010; Mathis; 2013). However, in earlier studies, the projected changes for the North Sea salinity differed substantially, this is the case even for scenarios forced by the same
15
parent global climate model (Gröger et al., 2013; Mathis; 2013; Mathis and Pohlmann, 2014; Bülow et al., 2014). Similarly, the amplitude of projected changes in Baltic Sea salinity varied considerably between different studies (Neumann, 2010; Meier, 2006; Meier et al., 2012), while our regional projections for the Baltic Sea lay within the range of these earlier projected changes. Besides an intensified hydrological cycle, stronger
20
westerly winds were earlier identified as a major driver for decreasing salinities in the Baltic Sea (Zorita and Laine, 2000; Meier and Kauker, 2003; Schrum, 2001) and our projected salinity decrease appears to be consistent with increased westerly winds in autumn (Fig. 2).
The seasonal thermal stratification is a central control on primary production in shelf
25
BGD
12, 12229–12279, 2015
Projected climate change impacts on North Sea and Baltic
Sea
D. Pushpadas et al.
Title Page
Abstract Introduction
Conclusions References
Tables Figures
◭ ◮
◭ ◮
Back Close
Full Screen / Esc
Printer-friendly Version Interactive Discussion
Discussion
P
a
per
|
Discussion
P
a
per
|
Discussion
P
a
per
|
Discussion
P
a
per
layer in winter. In contrast, the Baltic Sea exhibits a permanent halocline, which is su-perimposed by thermal stratification. The vertical stratification is significant to biological production as it is connected to vertical nutrient fluxes and thus determines the intensity of the spring bloom (Hordoir and Meier, 2011). A significant increase in summer MLD is projected in the Central Baltic Sea during the entire season for both CMIP3/A1B and
5
CMIP5/RCP4.5 ensembles, but the area, which shows significant changes is decreas-ing from CMPI3 to CMIP5. For the North Sea a slight decrease of MLD is projected but the change is not significant (Fig. 8), A two-sample T test is used on the annual av-erages from the 30 years time periods to determine the significance (at the 5 % level). Our findings are consistent with earlier findings from A1B scenario realizations in both
10
seas. Also Mathis and Pohlmann (2014) found a slight decrease in mean MLD in the North Sea for one realization for the A1B scenario (forced by ECHAM5-MPIOM) and Neumann (2010) and Hordoir and Meier (2011) projected an increase in MLD for the Baltic Sea. Neumann (2010) suggested that the tendency of deeper mixing in the Baltic Sea might be due to increased wind speed. Hordoir and Meier (2011) suspected that
15
the air temperature increase is mainly responsible for changes in stratification.
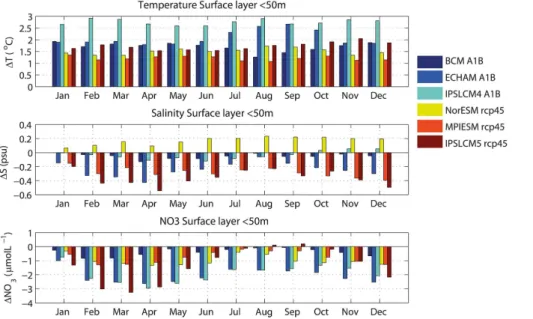
Vertical profiles of projected annual salinity and temperature changes are shown for the Baltic Sea for the monitoring station BY15 (see for location Fig. 1) in Fig. 9. The sea surface layer warming is strongest, but a substantive warming of ∼0.5–1.5◦C is
also projected for the deep layers in the CMIP3 model scenarios. The CMIP5 based
20
model scenarios show for the subsurface a slightly weaker warming and reduced inter-model spread. Both, the more pronounced warming of the surface layer and the more pronounced freshening in lower layers (Fig. 9) are contributing to a weakening of the stability of the permanent halocline. Meier et al. (2006) attributes projected sub-surface freshening to the changes in the wind forcing. Such a mechanisms is also likely here,
25
find-BGD
12, 12229–12279, 2015
Projected climate change impacts on North Sea and Baltic
Sea
D. Pushpadas et al.
Title Page
Abstract Introduction
Conclusions References
Tables Figures
◭ ◮
◭ ◮
Back Close
Full Screen / Esc
Printer-friendly Version Interactive Discussion
Discussion
P
a
per
|
Discussion
P
a
per
|
Discussion
P
a
per
|
Discussion
P
a
per
ings discussed in the AR4-IPCC, 2007), hence the precipitation changes will partly be compensated by increased evaporation.
3.2 Projected changes in primary production
Ensemble mean of projected changes of upper layer (<40 m) nitrate for both CMIP3 and CMIP5 models in winter (January) and the spread among models are shown in
5
Fig. 10. A two-sample T test is used on the annual averages from the 30 years time periods to determine the significance (at the 5 % level) (Fig. 10c and d). A significant consistent general reduction of North Sea nutrients was estimated in all projections, mainly driven by oceanic nutrient supply as already suggested by Holt et al. (2012). However the range of the projected reduction varies vigorously among models and
10
the reduction follows a pattern similar to the applied changes of nutrients at the open ocean boundary (Fig. 3). In the Baltic Sea, a statistically significant reduction in winter nutrients is only modelled for the Bothnian Sea and the Gulf of Finland and a statistically significant increase in surface winter nutrient concentrations is projected in the western Central Baltic. This increase is especially prominent in the upwelling region along the
15
Swedish coast, which supports the hypothesis by Eilola et al. (2012) that this is likely caused by intensified exchange of nutrient between surface and deeper waters in the future scenarios. Such an upwelling is especially supported by an intensification of westerly winds, which is a consistent and significant change in the both the CMIP3 and CMIP5 scenarios (Fig. 2). Unlike the North Sea, the open ocean nutrients are
20
not substantially influencing the Baltic Sea nutrients availability. Note that our study did note consider riverine nutrient changes for future projections. It is interesting to note that the model spread among CMIP3 models is substantially larger compared to CMIP5 models in the North Sea but not in the Baltic Sea.
Winter nutrient availability is a proxy for primary production changes (see also Holt
25
BGD
12, 12229–12279, 2015
Projected climate change impacts on North Sea and Baltic
Sea
D. Pushpadas et al.
Title Page
Abstract Introduction
Conclusions References
Tables Figures
◭ ◮
◭ ◮
Back Close
Full Screen / Esc
Printer-friendly Version Interactive Discussion
Discussion
P
a
per
|
Discussion
P
a
per
|
Discussion
P
a
per
|
Discussion
P
a
per
The projected changes are significant at the 5 % level in the North Sea, except of the well-mixed coastal zone and in the Central Baltic Sea (Fig. 11a and b). The region, which is projected to experience a statistically significant change, is decreasing from CMIP3 to CMIP5. The projected changes vary considerably with various ESM forc-ing. Like for the other parameter except salinity, the spread among CMIP3 models is
5
larger than that among CMIP5 models in the North Sea, in particular in the northern North Sea. In the North Sea, the percentage of reduction in average net primary pro-duction is found to be 2.3 % (BCM), 19 % (ECHAM5-MPIOM), 10 % (IPSL-CM4), 12 % (NORESM), 13 % (MPIESM) and 2.5 % (IPSL-CM5) respectively. The percentage in-crease of net primary production in the Baltic Sea, for projections forced by BCM,
10
ECHAM, IPSL CM4, NorESM, MPIESM and IPSL-CM5 are simulated as 15, 13, 18, 14, 5, and 14 % respectively. Additionally, an immense increase of cyanobacteria pro-duction (not shown here) is projected for the future Baltic Sea, which ranges from 18–67 %, with huge differences among individual simulations. Also Neumann (2010,
CMIP3-A1B) projected an increase in cyanobacteria production and suggested the
pro-15
jected warming favouring the increased cyanobacteria bloom. Correspondingly, Hense et al. (2013) projected more than twofold increase in the mean cyanobacteria biomass and nitrogen fixation for the end of the century using a coupled bio-physical model with an advanced cyanobacteria life cycle model. The increased biological production expected to amplify seasonal pH cycle in the Baltic Sea (Omstedt et al., 2012).
20
Holt et al. (2014) illustrated that expected climate change impacts on primary pro-duction vary spatially in the North Sea. Our study also shows that the northern North Sea exhibits a pronounced decrease in production due to the oceanic inflow. In con-trast, the Southern North Sea experiences an increase in production, which however is not statistically significant (Fig. 12). This increase in production is most likely due to
25
BGD
12, 12229–12279, 2015
Projected climate change impacts on North Sea and Baltic
Sea
D. Pushpadas et al.
Title Page
Abstract Introduction
Conclusions References
Tables Figures
◭ ◮
◭ ◮
Back Close
Full Screen / Esc
Printer-friendly Version Interactive Discussion
Discussion
P
a
per
|
Discussion
P
a
per
|
Discussion
P
a
per
|
Discussion
P
a
per
contributions from temperature effects on production changes tended to cancel out,
which is in agreement with results from perturbation experiments presented by Skogen et al. (2011) and Drinkwater et al. (2009). That makes the nutrient boundary conditions the major source for primary production decrease in the North Sea. Following the ESM forcing differences at the boundary (Fig. 2), we found the same spread in projected
5
production changes.
Previous studies (Holt et al., 2014; Chust et al., 2014; Neumann, 2010; Eilola et al., 2013) already depicted that the increase in future primary production in the Baltic Sea is to a large degree related to sea-ice reduction. For the North Sea, earlier studies identified ocean nutrient controls as a reason for projected decrease in production
10
based on the A1B scenario (Holt et al., 2012, 2014; Gröger et al., 2013). In order to differentiate major controlling factors of future primary projections, we have done
en-semble simulations considering atmospheric boundary changes only (Fig. 12). From these scenarios it is evident, that the main driver for projected changes in the Baltic is the local atmospheric change, while for the North Sea, the reduction of oceanic
nu-15
trient concentration in the inflowing water masses is the main driver for the projected production decrease. Our study signifies the importance of considering oceanic nutri-ent availability as predicted from ESMs (Steinacher et al., 2010; Bopp et al., 2013) to project primary production in the North Sea.
Holt et al. (2012) debated that the North Sea is generally susceptible to the oceanic
20
nutrient changes, though on-shelf processes lessen the actual sensitivity. In a more recent study, Holt et al. (2014) inferred that the North Sea, as shelf seas in general, are likely to be more robust and less affected by the effects of climate change than
the global ocean where the leading process of increasing stratification considerably re-duces primary production (e.g. Steinacher et al., 2010). In contradiction to this
conclu-25
BGD
12, 12229–12279, 2015
Projected climate change impacts on North Sea and Baltic
Sea
D. Pushpadas et al.
Title Page
Abstract Introduction
Conclusions References
Tables Figures
◭ ◮
◭ ◮
Back Close
Full Screen / Esc
Printer-friendly Version Interactive Discussion
Discussion
P
a
per
|
Discussion
P
a
per
|
Discussion
P
a
per
|
Discussion
P
a
per
that regional impacts on primary production are amplified in the North Sea compared to the global ocean and hypothesized that the shelf is more vulnerable than the open ocean, contradicting the findings and conclusions from Holt et al. (2014). Probable reasons for the oppositional findings in the regional studies are different sensitivities
of the cross shelf exchange in the global and regional approach caused by different
5
spatial resolution and sensitivity to the GCM bias (see discussion by Holt et al., 2014), and differences in the regional and global biogeochemical models (see also Schrum
et al., 2015). Here, we also found the largest primary production changes for the North Sea when forced by the ECHAM5-MPIOM (19 % reduction), however, our projected change is still lower than the one estimated by Gröger et al. (2013) using the same
10
global model. This indicates that differences in the regional and global biogeochemical
models are crucial while projecting regional scales. Possible reasons might be uncon-sidered temperature effects on mineralisation in the global biogeochemistry, differences
in the treatment of recycled production and re-suspension of organic material on the shelf.
15
Simulated secondary production follows in general the primary production pattern as earlier discussed e.g. by Daewel and Schrum (2013). Accordingly, projected changes in secondary production show similar sign as of primary production; reduction in the North Sea and increase in the Baltic Sea (not shown here). The amplitude of the rela-tive changes in secondary production is however regionally different and both, negative
20
and positive amplification of the trophic response (according to the concept firstly pre-sented by Chust et al., 2014) is estimated (Fig. 13). We find negative amplification for all scenarios and regions in the North Sea. For the Baltic Sea, we find positive ampli-fication for most scenarios and regions (see for reference of regions Fig. 1). Only for the Central Baltic a weak attenuation in trophic response to climate change is
mod-25
BGD
12, 12229–12279, 2015
Projected climate change impacts on North Sea and Baltic
Sea
D. Pushpadas et al.
Title Page
Abstract Introduction
Conclusions References
Tables Figures
◭ ◮
◭ ◮
Back Close
Full Screen / Esc
Printer-friendly Version Interactive Discussion
Discussion
P
a
per
|
Discussion
P
a
per
|
Discussion
P
a
per
|
Discussion
P
a
per
4 Summary and conclusions
Warming and sea ice reduction are robust and statistically significant features in all ensemble members presented here and the projected change is clearly larger than present day climatic variability (quantified through SD for the reference period). A sim-ilar pattern in projecting SST changes with CMIP3 models and their successors in
5
CMIP5 and the increased consistency compared to their pioneers, adds confidence on regional scale projections in sea temperature and denoting that warming is a robust feature in both mini-ensembles. It also strengthens the point that the mean and spread of both climate sensitivity and climate response of the CMIP5 models are coherent to CMIP3 with respect to ocean warming (Andrews et al., 2012). However, this confidence
10
builds only on two three-member ensembles and it remains unclear whether or not, this finding can be generalized.
Warming is projected to be stronger in the North Sea (between 1.2–2.8◦C for RCP4.5
and A1B scenarios) than in the Baltic Sea (1.7–3.5◦C) in all projections. In both seas,
warming is more pronounced in SST than in depth-averaged mean temperature, which
15
is the ecologically more relevant parameter. In addition to thermal changes, also salinity changes are of high interest for climate change impact studies in particular for the Baltic Sea. Salinity changes might put organisms under physiological stress and may alter the habitat conditions for various species (HELCOM, 2009; Meier, 2006; Neumann, 2010). Our study points out that the projected salinity changes are highly inconsistent (similar
20
to earlier scenario simulations based on the A1B CMIP3 forcing (e.g. Meier et al., 2006; Holt et al., 2012; Schrum et al., 2015). Conflicting to projected SST changes, for SSS the spread among CMIP5 models is larger than in the CMIP3 ensemble, and freshening of North Sea and Baltic Sea is not a robust feature among all CMIP5 models considered here and increased inter-model disagreement in salinity projections for the
25
CMIP5 model scenarios is noticeable.
BGD
12, 12229–12279, 2015
Projected climate change impacts on North Sea and Baltic
Sea
D. Pushpadas et al.
Title Page
Abstract Introduction
Conclusions References
Tables Figures
◭ ◮
◭ ◮
Back Close
Full Screen / Esc
Printer-friendly Version Interactive Discussion
Discussion
P
a
per
|
Discussion
P
a
per
|
Discussion
P
a
per
|
Discussion
P
a
per
decrease, an increase is estimated for the Baltic Sea. The spread in projected changes is large and range from −2.3 to −19 % in the North Sea and from+5 % to +18 % in
the Baltic Sea, with slightly less changes projected for CMIP5. The spread among CMIP3 ensemble members is slightly larger compared to the CMIP5 ensemble for the North Sea, while the model spread is increasing slightly for the Baltic Sea. The
5
estimated changes are statistically significant in the Northern North Sea (decrease) and the Baltic Sea (increase). The decrease in production in the North Sea is attributed to decreasing nutrient concentrations of inflowing oceanic water, while the increasing production in the Baltic is attributed to decreasing severe winters (decreasing sea ice cover) and increased upwelling of nutrient rich deeper water along the Swedish coast
10
and corresponding increased winter nutrient concentration. The latter is likely favoured by intensified westerly winds in the here selected GCMs.
Currently there is no agreement on best practices in climate change downscaling and a great variety of different approaches are in use. Regional downscaling models differ
in the size of the regional ocean model. E.g. Sandø et al. (2014) employed a large
15
scale North Atlantic–Arctic model to downscale climate change to the Barents Sea. Such a model will resolve oceanic processes and exchange across the shelf break much better than GCMs, but it also adds considerable variations to the climate change signal and would, if coupled back to the GCMs have the potential to modify the global change response considerably, and might thereby be dynamically inconsistent with the
20
forcing GCM. Holt et al. (2012) employed a North Sea-shelf break model to downscale climate change impacts to the North Sea, which, in contrast to the here employed on-shelf model, contributes regional variability of the cross on-shelf exchange. Chust et al., 2014 pointed out that the current ECOSMO setup is closer to the GCM forcing, since the region is rather small and pretty much controlled by the forcing GCM. To decide for
25
BGD
12, 12229–12279, 2015
Projected climate change impacts on North Sea and Baltic
Sea
D. Pushpadas et al.
Title Page
Abstract Introduction
Conclusions References
Tables Figures
◭ ◮
◭ ◮
Back Close
Full Screen / Esc
Printer-friendly Version Interactive Discussion
Discussion
P
a
per
|
Discussion
P
a
per
|
Discussion
P
a
per
|
Discussion
P
a
per
and tend therefore to favour a smaller region. However, there are arguments for an extended regional setup too and both approaches have their value.
Another issue relevant for the connected system North Sea and Baltic Sea is that most of the regional downscaling models employed are formulated for one of the re-gions only (for the Baltic Sea: e.g. Meier et al., 2012; Neumann et al., 2010; for the
5
North Sea: e.g. Mathis, 2013; Holt et al., 2012; Skogen et al., 2014; Friocourt et al., 2012; Ådlandsvik, 2008). This is a challenge especially for the system North Sea, since a number of different regional boundary conditions are used to parameterize or neglect
the impact of climate change to the Baltic and its consequences for exchange pro-cesses, which might add substantial uncertainty to projections. An attempt to consider
10
the Baltic Sea with a low resolution is made by Gröger et al. (2013) using a global model with regional zoom over the North Sea, but, because of the low resolution in the Baltic Sea, no attempt is made to resolve the regional climate change impacts in the Baltic Sea. The only other attempt to resolve the climate change impacts to the North Sea-Baltic Sea hydrodynamic system using a consistent downscaling approach was
15
made by Dietrich et al. (2015) (first results presented by Bülow et al., 2014). The only coupled physical-biogeochemical model for both regions used to downscale climate change impacts is the here used ECOSMO model system.
The resolution of global ESMs is in the order of 1–2◦ and quite coarse to be used
as forcing, specifically in the Baltic Sea. This made the employment of a bias
correc-20
tion necessary, and we used the Delta Method and the NCEP re-analysis as reference base. Despite a similar coarse resolution, data assimilation used in the assimilation procedure of NCEP ensures good data quality on the regional scale and NCEP forcing has earlier been used for the both regions as forcing data with good results in regional modelling (Schrum et al., 2003; Daewel and Schrum, 2013). An alternative would be
25
BGD
12, 12229–12279, 2015
Projected climate change impacts on North Sea and Baltic
Sea
D. Pushpadas et al.
Title Page
Abstract Introduction
Conclusions References
Tables Figures
◭ ◮
◭ ◮
Back Close
Full Screen / Esc
Printer-friendly Version Interactive Discussion
Discussion
P
a
per
|
Discussion
P
a
per
|
Discussion
P
a
per
|
Discussion
P
a
per
a regional model with spectral nudging in a hindcast model for the Bothnian Bay and the Gulfs of Finland and Riga, for the Skagerrak, Kattegat area, the Belt Sea and the western Baltic. For the North Sea an improvement was shown only for a narrow coastal region and the English Channel. In contrast, in the Central and northern North Sea and in the Central Baltic, the atmospheric forcing was closer to independent observed data
5
when using the NCEP data directly. Schrum et al. (2003b) compared a coupled re-gional atmosphere–ocean model to a one-way coupled rere-gional modelling approach (the regional atmospheric model is driving the regional ocean model) and to using coarse scale re-analysis forcing directly for the regional ocean model, showing that the one-way coupled regional atmosphere and ocean models resulted in the lowest
per-10
formance for the ocean model. We therefore decided to directly use the ESM forcing together with bias-correcting it. An alternative approach might be the newly developed coupled atmosphere–ocean regional downscalings (Sein et al., 2015; Dietrich et al., 2015, Su et al., 2014). First results presented by Bülow et al. (2014) look promising and a detailed discussion of advantages for using the computationally more expensive
15
coupled downscaling is warranted.
Here we neglect the changes in terrestrial runoff, and thereby postulate similar to
most earlier attempts (e.g. Meier, 2006; Mathis and Pohlmann, 2015; Holt et al., 2014; Eilola et al., 2013; Skogen et al., 2014) that North Atlantic inflow and atmospheric drivers play a major role in salinity and biogeochemical changes in the regions. This is
20
obviously very much oversimplified and for the Baltic Sea and the southeastern coastal North Sea certainly also runoffand natural and anthropogenic river load changes have
to be considered to provide a plausible range of possible future scenarios. This would be possible if a regional hydrological model would be employed for the catchment (e.g. Arheimer et al., 2012). Considering terrestrial coupling adds another dimension of
un-25
certainty and a proper consideration of these is beyond the scope of our study. Un-certainties in the hydrological cycling on global scales are still present (Mauritsen and Stevensen, 2015) and remain considerably large in runoff scenarios on the regional
un-BGD
12, 12229–12279, 2015
Projected climate change impacts on North Sea and Baltic
Sea
D. Pushpadas et al.
Title Page
Abstract Introduction
Conclusions References
Tables Figures
◭ ◮
◭ ◮
Back Close
Full Screen / Esc
Printer-friendly Version Interactive Discussion
Discussion
P
a
per
|
Discussion
P
a
per
|
Discussion
P
a
per
|
Discussion
P
a
per
certainties in future land use and anthropogenic loads (e.g. Arheimer et al., 2012). To our knowledge, no attempt has been undertaken so far to consider terrestrial nutrient changes in a consistent downscaling strategy for the North and Baltic Sea, nor is this standard for global ESMs (Regnier et al., 2013).
Acknowledgements. We would like to thank Ingo Bethke and Jerry Tjiputra for sharing BCM
5
data and Matthias Gröger for ECHAM-MPIOM data and the corresponding ocean biogeochem-istry. We acknowledge the World Climate Research Programme’s Working Group on Coupled Modelling, which is responsible for CMIP and we thank the climate modelling groups (listed in Table 1) for providing and making available their model output. This work was funded by Theme 6 of the EC seventh framework program through the Marine Ecosystem Evolution
10
in Changing Environment (MEECE) Collaborative project, the Norwegian Research Council through the MarinEra project ECODRIVE (NRC-193530/S40), the EU-FP7 SeasERA project SEAMAN (NRC-227779/E40, national funding through the Norwegian Research Council) and by the Centre for Climate Dynamics, Norway through the RegScen project.
References
15
Alheit, J., Mollmann, C., Dutz, J, Kornilovs, G., Loewe, P., Mohrholz, V., and Wasmund, N.: Synchronous ecological regime shifts in the central Baltic and the North Sea in the late 1980s, ICES J. Mar. Sci., 62, 1205–1215, doi:10.1016/j.icesjms.2005.04.024, 2005.
Andrews, T., Gregory, J. M., Webb, M. J., and Taylor, K. E.: Forcing, feedbacks and climate sensitivity in CMIP5 coupled atmosphere–ocean climate models, Geophys. Res. Lett., 39,
20
L09712, doi:10.1029/2012GL051607, 2012.
Arheimer, B., Dahné, J., and Donnelly, C.: Climate change impact on riverine nutrient load and land-based remedial measures of the Baltic Sea Action Plan, Ambio, 41, 600–612, 2012. Ådlandsvik, B.: Marine downscaling of a future climate scenario for the North Sea, Tellus A, 60,
451–458, 2008.
25
Ådlandsvik, B. and Bentsen, M.: Downscaling a twentieth century global climate simulation to the North Sea, Ocean Dynam., 57, 453–466, 2007.