RESEARCH ARTICLE
Signaling Pathways Related to Protein
Synthesis and Amino Acid Concentration in
Pig Skeletal Muscles Depend on the Dietary
Protein Level, Genotype and Developmental
Stages
Yingying Liu1,2,5, Fengna Li1, Xiangfeng Kong1*, Bie Tan1, Yinghui Li1,5, Yehui Duan1,5, François Blachier3, Chien-An A. Hu4, Yulong Yin1,6,7*
1Key Laboratory of Agro-ecological Processes in Subtropical Region, Chinese Academy of Sciences, Changsha, Hunan, China,2Hunan Animal Science and Veterinary Medicine Research Institute, Changsha, China,3INRA, CNRH-IdF, AgroParisTech, UMR 914 Nutrition Physiology and Ingestive Behavior, Paris, France,4Department of Biochemistry and Molecular Biology, University of New Mexico, Albuquerque, United States of America,5University of Chinese Academy of Sciences, Beijing, China,6School of Biology, Hunan Normal Univesity, Hunan, Changsha City, 410018, China,7Changsha Lvye Biotechnology Limited Company, Guangdong Hinapharm Group and WangDa Academician Workstation, Hunan, Changsha City, 41019, P. R. China
*[email protected](XK);[email protected](YY)
Abstract
Muscle growth is regulated by the homeostatic balance of the biosynthesis and degradation of muscle proteins. To elucidate the molecular interactions among diet, pig genotype, and physiological stage, we examined the effect of dietary protein concentration, pig genotype, and physiological stages on amino acid (AA) pools, protein deposition, and related signaling pathways in different types of skeletal muscles. The study used 48 Landrace pigs and 48 pure-bred Bama mini-pigs assigned to each of 2 dietary treatments: lower/GB (Chinese conventional diet)- or higher/NRC (National Research Council)-protein diet. Diets were fed from 5 weeks of age to respective market weights of each genotype. Samples ofbiceps
femorismuscle (BFM, type I) andlongissimus dorsimuscle (LDM, type II) were collected at
nursery, growing, and finishing phases according to the physiological stage of each geno-type, to determine the AA concentrations, mRNA levels for growth-related genes in mus-cles, and protein abundances of mechanistic target of rapamycin (mTOR) signaling pathway. Our data showed that the concentrations of most AAs in LDM and BFM of pigs increased (P<0.05) gradually with increasing age. Bama mini-pigs had generally higher
(P<0.05) muscle concentrations of flavor-related AA, including Met, Phe, Tyr, Pro, and Ser,
compared with Landrace pigs. The mRNA levels for myogenic determining factor, myo-genin, myocyte-specific enhancer binding factor 2 A, and myostatin of Bama mini-pigs were higher (P<0.05) than those of Landrace pigs, while total and phosphorylated protein levels
for protein kinase B, mTOR, and p70 ribosomal protein S6 kinases (p70S6K), and ratios of p-mTOR/mTOR, p-AKT/AKT, and p-p70S6K/p70S6K were lower (P<0.05). There was a
PLOS ONE | DOI:10.1371/journal.pone.0138277 September 22, 2015 1 / 21
OPEN ACCESS
Citation:Liu Y, Li F, Kong X, Tan B, Li Y, Duan Y, et al. (2015) Signaling Pathways Related to Protein Synthesis and Amino Acid Concentration in Pig Skeletal Muscles Depend on the Dietary Protein Level, Genotype and Developmental Stages. PLoS ONE 10(9): e0138277. doi:10.1371/journal. pone.0138277
Editor:Zane Andrews, Monash University, AUSTRALIA
Received:June 23, 2015
Accepted:August 27, 2015
Published:September 22, 2015
Copyright:© 2015 Liu et al. This is an open access article distributed under the terms of theCreative Commons Attribution License, which permits unrestricted use, distribution, and reproduction in any medium, provided the original author and source are credited.
Data Availability Statement:All relevant data are within the paper.
significant pig genotype-dependent effect of dietary protein on the levels for mTOR and p70S6K. When compared with the higher protein-NRC diet, the lower protein-GB diet increased (P<0.05) the levels for mTOR and p70S6K in Bama mini-pigs, but repressed (P<0.05) the level for p70S6K in Landrace pigs. The higher protein-NRC diet increased ratio of p-mTOR/mTOR in Landrace pigs. These findings indicated that the dynamic conse-quences of AA profile and protein deposition in muscle tissues are the concerted effort of distinctive genotype, nutrient status, age, and muscle type. Our results provide valuable information for animal feeding strategy.
Introduction
It is economically important to increase the rate and speed of skeletal muscle growth in animals raised for meat including pigs. The growth of animals is a net result of complicated metabolic and physiological network including synthesis and utilization of amino acids (AA) [1], intra-cellular protein turnover and deposition, as well as their regulation by nutrients, age, endocrine and exocrine secretion and other factors. The skeletal muscle, which accounts for 20–50% of total body mass among the different pig genotypes, is the major metabolic tissue, contributing up to 40% of the resting metabolic rate in adult pigs [2,3]. In addition, muscle cell lineage deter-mination and differentiation require coordinated extracellular and intracellular signaling events that converge upon the nuclear genome to coordinate, depending on the intracellular content composition, specific patterns of gene expression required for normal cellular homeo-stasis [4]. Such programs of gene transcription require cell-specific and more widely expressed DNA binding transcription factors and their attending co-regulators that act on the epigenome for appropriate control of gene expression [5].
Dietary AAs are not only substrates for protein synthesis but also exert signaling effects on muscle protein deposition [6–13]. It is well known that cell signaling via the mechanistic target of rapamycin (mTOR; a highly conserved serine/threonine protein kinase) is a major mecha-nism for regulation of protein synthesis in cells [14]. The mTOR integrates extracellular sig-nals, then phosphorylates the downstream targets, such as p70 ribosomal protein S6 kinases (p70S6K) and eukaryotic initiation factor 4E binding protein 1 (EIF-4EBP1). These coordi-nately affect gene transcription and protein translation, which are involved in the regulation of cell growth, proliferation and differentiation. Recently, mTOR was found to act as a sensor for cell growth regulated by AA [15,16]. Since chronic feeding of a low-protein diet could impair translation initiation activation and reduce protein synthesis through the mTOR signaling pathway in pigs [17], supplementation strategy with crystalline AA to low-protein diet was reported to be efficient for stimulating tissue protein synthesis via the mTOR pathway [8,18]. Thus, dietary protein concentration, especially level of protein or free AA, is very important as a modulator for the protein deposition and muscle growth.
Genetic background can influence growth and nutrient requirements in animals, including pigs. Bama mini-pig (Sus scrofa domestica), a Chinese indigenous mini-pig breed located in Bama County, Guangxi Province of China produces high-quality meat. Landrace is a fast-growing lean genotype with commercial traits. In our previous investigations [10], Landrace pigs showed faster growth rate and better muscle growth than Bama mini-pig. In contrast, Bama mini-pigs presented higher quality meat traits but more fat deposition capacity together with lower growth rate than Landrace pigs. Therefore, finding the optimal balance between economic aspect of pig production and meat nutritional quality is the goal of many researchers.
Dietary Protein Content and Muscle Amino Acid Metabolism
PLOS ONE | DOI:10.1371/journal.pone.0138277 September 22, 2015 2 / 21
Limited Company, Guangdong Hinapharm Group and WangDa Academician Workstation provided support in the form of a salary for YY, but did not have any additional role in the study design, data collection and analysis, decision to publish, or preparation of the manuscript.
Pig skeletal muscle fiber type varies with anatomical location. For example,biceps femoris mus-cle (BFM) andlongissimus dorsimuscle (LDM) mainly contain type I and type II fiber, respec-tively [19]. We hypothesized that the difference between these two genotypes of pigs in their muscle growth, meat quality, and intermuscular adipose deposition [10] may lead to dietary protein-dependent differences in protein deposition and related signaling pathways in different types of skeletal muscles. The main objective of the current study was to evaluate the effects of genotype, diet, and age on protein deposition, and growth of different muscle fiber types as well as the associated regulating signaling pathways.
Materials and Methods
Animals, diets, and treatments
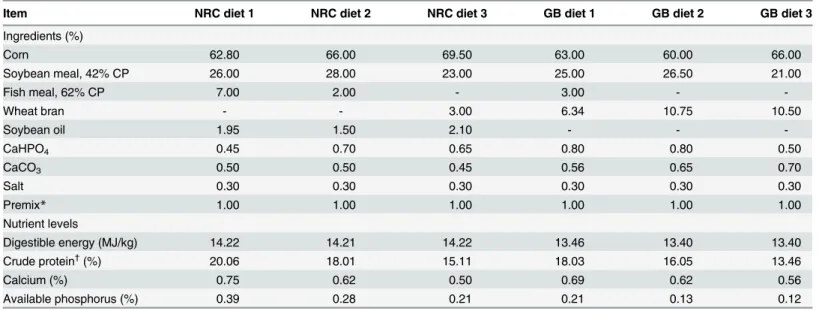
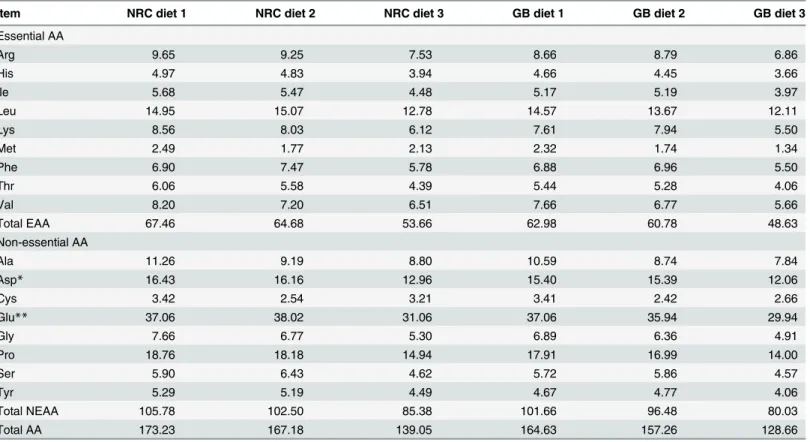
Ninety-six barrows [48 purebred Bama mini-pigs (fatty type; average initial body weight (BW), 3.38 ± 0.96 kg), and 48 Landrace pigs (lean type; average initial BW, 7.68 ± 0.89 kg)] were fed from 5 weeks of age up to market weight. The experiment was a 2 × 2 factorial arrangement, with 2 genotypes (Bama mini-pigsvs. Landrace pigs) and 2 dietary protein levels (NRC dietvs. lower protein-Chinese conventional diet [GB]), resulting 4 different treatments (Table 1). The piglets from each genotype were randomly assigned to one of the two dietary treatments, with 24 piglets in each treatment. The NRC diets were formulated to meet NRC [20] recommended nutrient requirements, whereas the lower protein-GB diets were formulated to meet recom-mendations of Chinese National Feeding Standard for Swine [21], and with a protein level of the latter being lower than the former (Table 2). The AA compositions in each diet which were determined according to our previous method [22] are shown inTable 3. All animals were individually housed in 0.6 m × 1.2 m pens with hard plastic slatted flooring [23]. Each pen was equipped with a stainless-steel feeder and a nipple drinker [24]. The room temperature was maintained at 25–27°C [25]. All pigs hadad libitumaccess to drinking water, and were fed three times daily (0800, 1300, and 1800). Dietary phase was based on the physiological stage of pigs [26].
The experiment was carried out in accordance with the Chinese guidelines for animal wel-fare and experimental protocols, and approved by the Animal Care and Use Committee of the Institute of Subtropical Agriculture, the Chinese Academy of Sciences.
Sample collection
Body weight ranges for nursery, growing, and finishing phases were defined as 7–20, 20–50, and 50–90 kg, respectively, for Landrace pigs, and 3–15, 15–35, and 35–55 kg, respectively, for Bama mini-pigs (Table 1). At the end of each phase, 8 pigs from each treatment were randomly
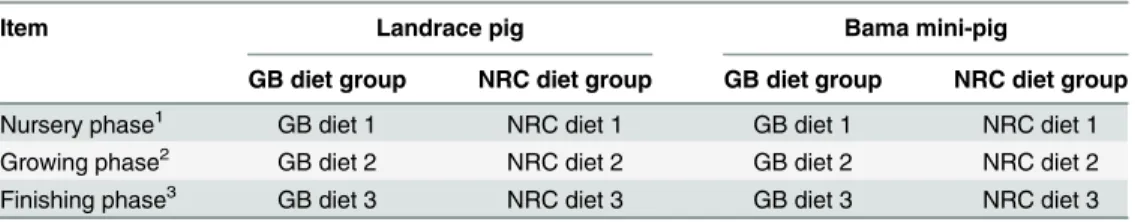
Table 1. Experimental design.
Item Landrace pig Bama mini-pig
GB diet group NRC diet group GB diet group NRC diet group
Nursery phase1 GB diet 1 NRC diet 1 GB diet 1 NRC diet 1
Growing phase2 GB diet 2 NRC diet 2 GB diet 2 NRC diet 2
Finishing phase3 GB diet 3 NRC diet 3 GB diet 3 NRC diet 3
1, 2, 3Body weight ranges for nursery, growing, and
finishing phases were defined as 7–20, 20–50, and 50–
90 kg, respectively, for Landrace pigs, and 3–15, 15–35, and 35–55 kg, respectively, for Bama mini-pigs. GB diet, lower protein-Chinese conventional diet; NRC diet, higher protein-NRC diet.
doi:10.1371/journal.pone.0138277.t001
Dietary Protein Content and Muscle Amino Acid Metabolism
selected for blood collection, and euthanized [27]. Briefly, the pigs were held under general anesthesia and killed by injection of 4% sodium pentobarbital solution (40 mg/kg BW) into the jugular vein. After removing the head, legs, tail, and viscera, the carcass was split longitudinally. Samples of LDM and BFM on the right-side carcass were collected immediately, and the visible intermuscular adipose tissue was carefully removed. The samples were snap-frozen in liquid nitrogen, and stored at -80°C for further analysis [28].
Determination of AA
Approximately 0.1 g freeze-dried muscle was ground and hydrolyzed in 10 ml of 6 mol/L hydrochloric acid solution at 110°C for 24 h. The solution was diluted with water to 100 ml and 1 ml of the supernatant was used for analysis [29,30]. The samples were filtered through a 0.45-μm membrane before analysis [31] by an ion-exchange AA analyzer (L8800, Hitachi, Tokyo, Japan).
RNA extraction and cDNA synthesis
Total RNA was isolated from LDM and BFM tissues using the TRIzol reagent (Invitrogen-Life Technologies, Carlsbad, CA, USA) and treated with DNase I (Invitrogen) according to the manufacturer’s instructions. The RNA quality was checked by 1% agarose gel electrophoresis, and stained with 10μg/ml ethidium bromide [32]. The RNA was shown to have an OD260: OD280 ratio between 1.8 and 2.0. The first-strand cDNA was synthesized with Oligo (dT) 20 and Superscript II reverse-transcriptase (Invitrogen), according to the manufacturers’ instructions.
Table 2. Ingredients and nutrient levels of experimental diets.
Item NRC diet 1 NRC diet 2 NRC diet 3 GB diet 1 GB diet 2 GB diet 3
Ingredients (%)
Corn 62.80 66.00 69.50 63.00 60.00 66.00
Soybean meal, 42% CP 26.00 28.00 23.00 25.00 26.50 21.00
Fish meal, 62% CP 7.00 2.00 - 3.00 -
-Wheat bran - - 3.00 6.34 10.75 10.50
Soybean oil 1.95 1.50 2.10 - -
-CaHPO4 0.45 0.70 0.65 0.80 0.80 0.50
CaCO3 0.50 0.50 0.45 0.56 0.65 0.70
Salt 0.30 0.30 0.30 0.30 0.30 0.30
Premix* 1.00 1.00 1.00 1.00 1.00 1.00
Nutrient levels
Digestible energy (MJ/kg) 14.22 14.21 14.22 13.46 13.40 13.40
Crude protein†
(%) 20.06 18.01 15.11 18.03 16.05 13.46
Calcium (%) 0.75 0.62 0.50 0.69 0.62 0.56
Available phosphorus (%) 0.39 0.28 0.21 0.21 0.13 0.12
*Premix provided for 1 kg of complete diet: Cu (as copper sulfate), 10 mg; Fe (as ferrous sulfate), 100 mg; Se (as sodium selenite), 0.30 mg; Zn (as zinc oxide), 100 mg; Mn (as manganese sulfate), 10 mg; VD3, 9.65μg; VA, 925.8μg; VE, 15.4 mg; VK3, 2.3 mg; VB2, 3.9 mg; D-calcium pantothenate, 15.4 mg;
nicotinic acid, 23 mg; choline, 80 mg; VB12, 0.016 mg. †
Crude protein was determined value, other nutrients were calculated values.
doi:10.1371/journal.pone.0138277.t002
Dietary Protein Content and Muscle Amino Acid Metabolism
Analysis of muscle growth-related gene expression
Primers for myogenic determining factor (MyoD), myogenin (MyoG), myocyte-specific enhancer binding factor 2 A (MEF2A), and myostatin (MSTN) (Table 4) were designed using the Primer 5.0 software. Real-time reverse-transcription polymerase chain reaction (RT-PCR) Table 3. Analyzed AA composition of the experimental diets (mg/g, as-fed basis).
Item NRC diet 1 NRC diet 2 NRC diet 3 GB diet 1 GB diet 2 GB diet 3
Essential AA
Arg 9.65 9.25 7.53 8.66 8.79 6.86
His 4.97 4.83 3.94 4.66 4.45 3.66
Ile 5.68 5.47 4.48 5.17 5.19 3.97
Leu 14.95 15.07 12.78 14.57 13.67 12.11
Lys 8.56 8.03 6.12 7.61 7.94 5.50
Met 2.49 1.77 2.13 2.32 1.74 1.34
Phe 6.90 7.47 5.78 6.88 6.96 5.50
Thr 6.06 5.58 4.39 5.44 5.28 4.06
Val 8.20 7.20 6.51 7.66 6.77 5.66
Total EAA 67.46 64.68 53.66 62.98 60.78 48.63
Non-essential AA
Ala 11.26 9.19 8.80 10.59 8.74 7.84
Asp* 16.43 16.16 12.96 15.40 15.39 12.06
Cys 3.42 2.54 3.21 3.41 2.42 2.66
Glu** 37.06 38.02 31.06 37.06 35.94 29.94
Gly 7.66 6.77 5.30 6.89 6.36 4.91
Pro 18.76 18.18 14.94 17.91 16.99 14.00
Ser 5.90 6.43 4.62 5.72 5.86 4.57
Tyr 5.29 5.19 4.49 4.67 4.77 4.06
Total NEAA 105.78 102.50 85.38 101.66 96.48 80.03
Total AA 173.23 167.18 139.05 164.63 157.26 128.66
*Including aspartate and asparagine;
**Including glutamate and glutamine.
doi:10.1371/journal.pone.0138277.t003
Table 4. Primers used for real-time PCR.
Gene Accession no. Primers Size (bp)
MyoD NM_001002824 F: 5'-CAACAGCGGACGACTTCTATG-3' 383
R: 5'-GCGCAAGATTTCCACCTT-3'
MyoG NM_001012406 F: 5'-AGGCTACGAGCGGACTGA-3' 230
R: 5'-GCAGGGTGCTCCTCTTCA-3'
MEF2A NM_001099698 F: 5'-TGAATACCCAGAGGATAAGCAGTT-3' 133
R: 5'-TAATCGGTGTTGTAGGCGG-3'
MSTN AY448008 F: 5'-GTCCCGTGGATCTGAATG-3' 293
R: 5'-TTCCGTCGTAGCGTGATA-3'
GAPDH NM_001206359 S: 5'-AAGGAGTAAGAGCCCCTGGA-3' 140
A: 5'-TCTGGGATGGAAACTGGAA-3'
MyoD, myogenic differentiation factor; MyoG, myogenin; MEF2A, myocyte specific-enhancer factor-2A; MSTN, myostatin; GAPDH, glyceraldehyde-3-phosphate dehydrogenase.
doi:10.1371/journal.pone.0138277.t004
Dietary Protein Content and Muscle Amino Acid Metabolism
was performed using the SYBR Green detection kit (TaKaRa, Japan), containing MgCl2, dNTP, and HotStar Taq Polymerase. An aliquot (2μl) of a cDNA template (equal to 25 ng of total RNA) solution was added to a total volume of 10μl containing 5μl SYBR Green mix, 0.2μl ROX Reference Dye (50 X), and 0.2μl each of forward and reverse primers. After a pre-dena-turation program (10 s at 95°C), 40 cycles of amplification were performed (95°C for 10 s, 60°C for 20 s), followed by a melting curve program (60–99°C with a heating rate of 0.1°C/s and fluorescence measurement), the fluorescent signal was detected by the ABI Prism 7900HT (Applied Biosystems, Marsiling Industrial Estate Road 3, Singapore). A melting curve was gen-erated for each sample at the end of each run to ensure the purity of the amplified products. The amplification of glyceraldehyde-3-phosphate dehydrogenase (GAPDH) in each sample was used to normalize the mRNA levels for the target genes. The relative expression ratio (R) of mRNA was calculated by the following formula:
R ¼ 2 DDCtðsample controlÞ;
whereΔΔCt(sample—control) = (Cttarget genes—CtGAPDH) for the sample—(Cttarget genes—CtGAPDH) for the control.
Real-time RT-PCR efficiencies were determined by the amplification of a dilution series of cDNA according to the equation 10(-1/slope), as described by Liu et al. [10], and were consistent between target genes and GAPDH. Negative controls were also used, in which cDNA solution was replaced by an equal volume of water.
Analysis of mTOR-pathway proteins
The frozen muscle samples were powdered in liquid nitrogen, and lysed in RIPA buffer (150 mM NaCl, 1% Triton X-100, 0.5% sodium deoxycholate, 0.1% SDS, and 50 mM Tris-HCl at pH 7.4), containing a protease inhibitor cocktail purchased from Roche (Shanghai, China). After centrifugation at 10, 000 ×gand 4°C for 10 min, protein concentration in the supernatant fluid was determined using the Bicinchoninic Acid assay (Beyotime Biotechnology, Haimen, China). All samples were diluted to an equal protein concentration with 2 × loading buffer (0.63 ml of 0.5 M Tris-HCl (pH 6.8), 0.42 ml 75% glycerol, 0.125 g sodium dodecyl sulfate (SDS), 0.25 mlβ-mercaptoethanol, 0.2 ml 0.05% solution of bromphenol blue, and 1 ml water to a final volume of 2.5 ml), and heated in boiling water for 5 min. After cooling on ice, the samples were used for Western blot analysis.
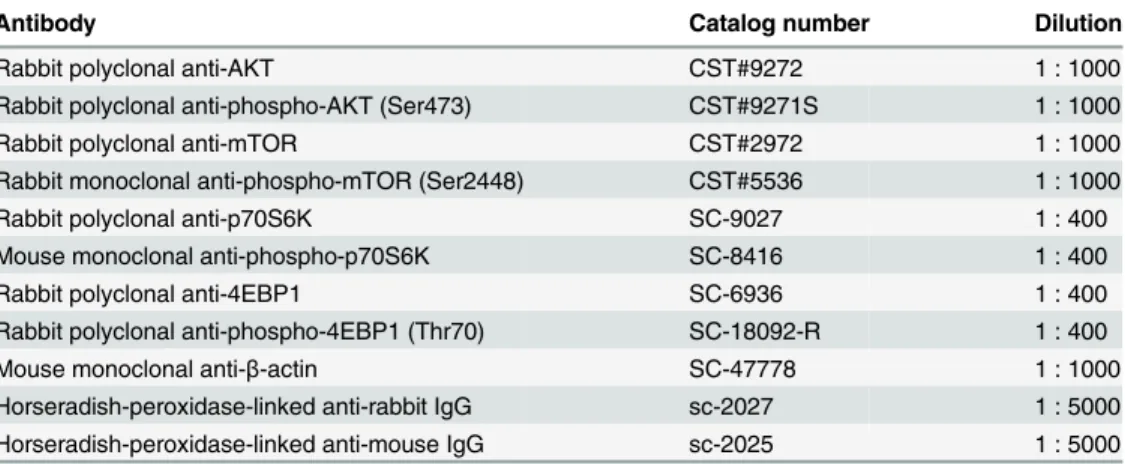
Same amounts of sample aliquots (20μg protein) were subjected to SDS-PAGE (4%–12% gradient gel) and were then transferred to PVDF membranes (Millipore, MA, USA) overnight at 12 V using the Bio-Rad Transblot apparatus (CA, USA). The membranes were blocked in 5% fat-free milk in Tris-Tween buffered saline (TTBS; 20 mM Tris/150 mM NaCl, pH 7.5, and 0.1% Tween-20) for 3 h and then incubated with the primary antibodies (Table 5) at 4°C over-night with gentle rocking. After washing three times with TTBS, the membranes were incu-bated at room temperature for 2 h with horseradish peroxidase-linked secondary antibodies (Santa Cruz, CA, USA). The dilution of secondary antibodies was 1:5, 000. Finally, the mem-branes were washed with TTBS, followed by development using Super-signal West Dura Extended Duration Substrate according to the manufacturer’s instructions (Pierce, Rockford, IL). The images were detected on chemiluminescence (Applygen Technologies Inc., Beijing, China). Multiple exposures of each Western blot were performed to ensure linearity of chemi-luminescence signals. Western blots were quantified by measuring the intensity of bands with correct molecular weight using AlphaImager 2200 software (Alpha Innotech Corporation, CA, USA). The ratio of intensities of a target protein band and housekeeping protein band was
Dietary Protein Content and Muscle Amino Acid Metabolism
calculated for each filter and the ratios from the different Western blot filters were used for analyzing the relative abundances of target proteins.
Statistical analysis
Data were analyzed by multifactor ANOVA using the GLM procedure of SAS 9.1 (SAS Insti-tute Inc., Cary, NC) and means were separated using Tukey’s method. The effects of pig geno-type, diet, physiological stage, and their interactions were taken into consideration. Differences between means were considered as statistically significant atP<0.05 and a trend toward signifi-cance atP<0.10.
Results
Muscle AA concentration
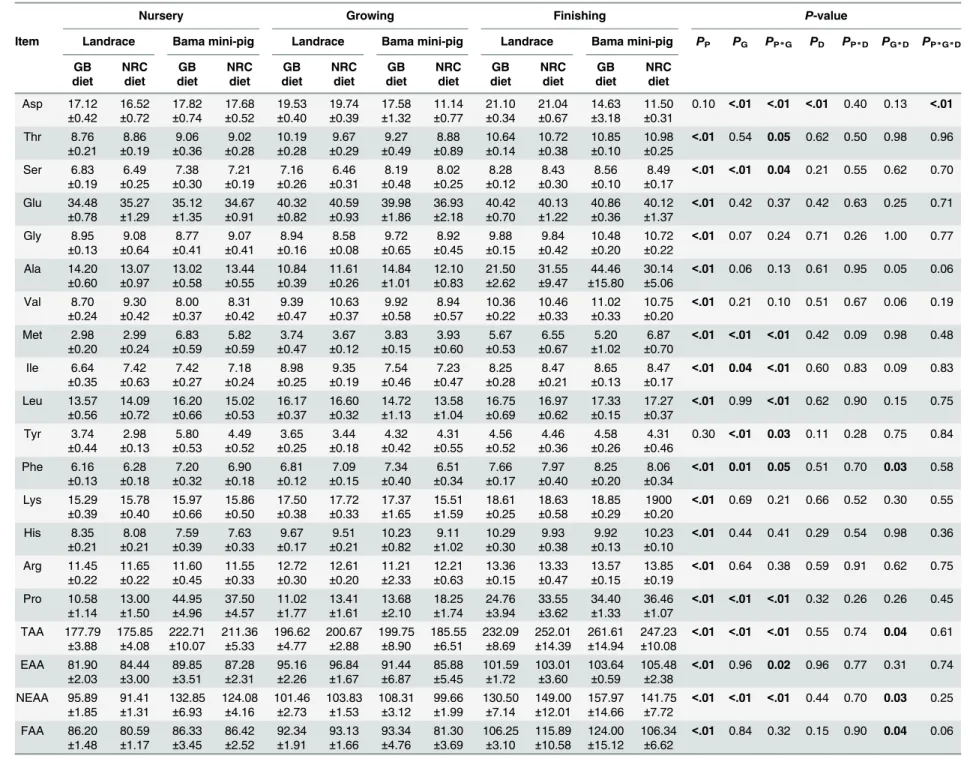
Muscle AA concentrations are shown in Tables6and7. In general, the concentrations of most AA, total AA (TAA), essential AA (EAA), and flavor AA (FAA) in LDM and BFM increased in an age-dependent manner, regardless of pig genotype and dietary protein level. Pig genotype affected most indices of AA pool of different muscle tissues throughout the trial. Diet had sig-nificant effects on several AA.
As shown inTable 6, the concentrations of most AA (except of Asp and Tyr) in the LDM of both genotypes of pigs increased (P<0.05) with age. The concentrations of nonessential AA (NEAA) decreased (P<0.05) in growing phase but increased (P<0.05) in finishing phase. Ratios of EAA/TAA and EAA/NEAA increased (P<0.05) in growing phase but decreased (P<0.05) in finishing phase. The AA of LDM in Landrace pigs and Bama mini-pigs differed (P<0.05), including Asp, Ser, Met, Ile, Tyr, Phe, Pro, TAA, NEAA, and ratios of EAA/TAA and EAA/NEAA. Bama mini-pigs had higher (P<0.05) concentrations of Ser, Met, Ile, Tyr, Phe, and Pro during nursery phase, higher (P<0.05) concentrations of Ser, Met, Tyr, and Pro during growing phase, and higher (P<0.05) concentrations of Ile, Phe, and Pro during finish-ing phase; while lower (P<0.05) concentration of Asp was recorded during growing and finish-ing phases, when compared with Landrace pigs. Furthermore, the concentration of Asp in Bama mini-pigs fed the GB diet was higher (P<0.05) than those fed NRC diet, especially in growing and finishing phases. There were interactions between developmental phases and genotypes notably for Asp, Ser, Met, Ile, Leu, and Tyr. No interaction between developmental phases and diets was observed for any AA. An interaction between genotype and diet was evi-denced for concentrations of Phe, TAA, NEAA, and FAA. In addition, according to the pig Table 5. Antibodies and dilution used for Western blot analyses.
Antibody Catalog number Dilution
Rabbit polyclonal anti-AKT CST#9272 1 : 1000
Rabbit polyclonal anti-phospho-AKT (Ser473) CST#9271S 1 : 1000
Rabbit polyclonal anti-mTOR CST#2972 1 : 1000
Rabbit monoclonal anti-phospho-mTOR (Ser2448) CST#5536 1 : 1000
Rabbit polyclonal anti-p70S6K SC-9027 1 : 400
Mouse monoclonal anti-phospho-p70S6K SC-8416 1 : 400
Rabbit polyclonal anti-4EBP1 SC-6936 1 : 400
Rabbit polyclonal anti-phospho-4EBP1 (Thr70) SC-18092-R 1 : 400
Mouse monoclonal anti-β-actin SC-47778 1 : 1000
Horseradish-peroxidase-linked anti-rabbit IgG sc-2027 1 : 5000 Horseradish-peroxidase-linked anti-mouse IgG sc-2025 1 : 5000
doi:10.1371/journal.pone.0138277.t005
Dietary Protein Content and Muscle Amino Acid Metabolism
Table 6. Effects of genotype, diet, and developmental phase on amino acid concentrations inlongissimus dorsimuscle of pigs (mg/g, as-fresh basis; n = 8).
Nursery Growing Finishing P-value
Item Landrace Bama mini-pig Landrace Bama mini-pig Landrace Bama mini-pig PP PG PP*G PD PP*D PG*D PP*G*D
GB diet NRC diet GB diet NRC diet GB diet NRC diet GB diet NRC diet GB diet NRC diet GB diet NRC diet Asp 17.12 ±0.42 16.52 ±0.72 17.82 ±0.74 17.68 ±0.52 19.53 ±0.40 19.74 ±0.39 17.58 ±1.32 11.14 ±0.77 21.10 ±0.34 21.04 ±0.67 14.63 ±3.18 11.50 ±0.31
0.10 <.01 <.01 <.01 0.40 0.13 <.01
Thr 8.76 ±0.21 8.86 ±0.19 9.06 ±0.36 9.02 ±0.28 10.19 ±0.28 9.67 ±0.29 9.27 ±0.49 8.88 ±0.89 10.64 ±0.14 10.72 ±0.38 10.85 ±0.10 10.98 ±0.25
<.01 0.54 0.05 0.62 0.50 0.98 0.96
Ser 6.83 ±0.19 6.49 ±0.25 7.38 ±0.30 7.21 ±0.19 7.16 ±0.26 6.46 ±0.31 8.19 ±0.48 8.02 ±0.25 8.28 ±0.12 8.43 ±0.30 8.56 ±0.10 8.49 ±0.17
<.01 <.01 0.04 0.21 0.55 0.62 0.70
Glu 34.48 ±0.78 35.27 ±1.29 35.12 ±1.35 34.67 ±0.91 40.32 ±0.82 40.59 ±0.93 39.98 ±1.86 36.93 ±2.18 40.42 ±0.70 40.13 ±1.22 40.86 ±0.36 40.12 ±1.37
<.01 0.42 0.37 0.42 0.63 0.25 0.71
Gly 8.95 ±0.13 9.08 ±0.64 8.77 ±0.41 9.07 ±0.41 8.94 ±0.16 8.58 ±0.08 9.72 ±0.65 8.92 ±0.45 9.88 ±0.15 9.84 ±0.42 10.48 ±0.20 10.72 ±0.22
<.01 0.07 0.24 0.71 0.26 1.00 0.77
Ala 14.20 ±0.60 13.07 ±0.97 13.02 ±0.58 13.44 ±0.55 10.84 ±0.39 11.61 ±0.26 14.84 ±1.01 12.10 ±0.83 21.50 ±2.62 31.55 ±9.47 44.46 ±15.80 30.14 ±5.06
<.01 0.06 0.13 0.61 0.95 0.05 0.06
Val 8.70 ±0.24 9.30 ±0.42 8.00 ±0.37 8.31 ±0.42 9.39 ±0.47 10.63 ±0.37 9.92 ±0.58 8.94 ±0.57 10.36 ±0.22 10.46 ±0.33 11.02 ±0.33 10.75 ±0.20
<.01 0.21 0.10 0.51 0.67 0.06 0.19
Met 2.98 ±0.20 2.99 ±0.24 6.83 ±0.59 5.82 ±0.59 3.74 ±0.47 3.67 ±0.12 3.83 ±0.15 3.93 ±0.60 5.67 ±0.53 6.55 ±0.67 5.20 ±1.02 6.87 ±0.70
<.01 <.01 <.01 0.42 0.09 0.98 0.48
Ile 6.64 ±0.35 7.42 ±0.63 7.42 ±0.27 7.18 ±0.24 8.98 ±0.25 9.35 ±0.19 7.54 ±0.46 7.23 ±0.47 8.25 ±0.28 8.47 ±0.21 8.65 ±0.13 8.47 ±0.17
<.01 0.04 <.01 0.60 0.83 0.09 0.83
Leu 13.57 ±0.56 14.09 ±0.72 16.20 ±0.66 15.02 ±0.53 16.17 ±0.37 16.60 ±0.32 14.72 ±1.13 13.58 ±1.04 16.75 ±0.69 16.97 ±0.62 17.33 ±0.15 17.27 ±0.37
<.01 0.99 <.01 0.62 0.90 0.15 0.75
Tyr 3.74 ±0.44 2.98 ±0.13 5.80 ±0.53 4.49 ±0.52 3.65 ±0.25 3.44 ±0.18 4.32 ±0.42 4.31 ±0.55 4.56 ±0.52 4.46 ±0.36 4.58 ±0.26 4.31 ±0.46
0.30 <.01 0.03 0.11 0.28 0.75 0.84
Phe 6.16 ±0.13 6.28 ±0.18 7.20 ±0.32 6.90 ±0.18 6.81 ±0.12 7.09 ±0.15 7.34 ±0.40 6.51 ±0.34 7.66 ±0.17 7.97 ±0.40 8.25 ±0.20 8.06 ±0.34
<.01 0.01 0.05 0.51 0.70 0.03 0.58
Lys 15.29 ±0.39 15.78 ±0.40 15.97 ±0.66 15.86 ±0.50 17.50 ±0.38 17.72 ±0.33 17.37 ±1.65 15.51 ±1.59 18.61 ±0.25 18.63 ±0.58 18.85 ±0.29 1900 ±0.20
<.01 0.69 0.21 0.66 0.52 0.30 0.55
His 8.35 ±0.21 8.08 ±0.21 7.59 ±0.39 7.63 ±0.33 9.67 ±0.17 9.51 ±0.21 10.23 ±0.82 9.11 ±1.02 10.29 ±0.30 9.93 ±0.38 9.92 ±0.13 10.23 ±0.10
<.01 0.44 0.41 0.29 0.54 0.98 0.36
Arg 11.45 ±0.22 11.65 ±0.22 11.60 ±0.45 11.55 ±0.33 12.72 ±0.30 12.61 ±0.20 11.21 ±2.33 12.21 ±0.63 13.36 ±0.15 13.33 ±0.47 13.57 ±0.15 13.85 ±0.19
<.01 0.64 0.38 0.59 0.91 0.62 0.75
Pro 10.58 ±1.14 13.00 ±1.50 44.95 ±4.96 37.50 ±4.57 11.02 ±1.77 13.41 ±1.61 13.68 ±2.10 18.25 ±1.74 24.76 ±3.94 33.55 ±3.62 34.40 ±1.33 36.46 ±1.07
<.01 <.01 <.01 0.32 0.26 0.26 0.45
TAA 177.79 ±3.88 175.85 ±4.08 222.71 ±10.07 211.36 ±5.33 196.62 ±4.77 200.67 ±2.88 199.75 ±8.90 185.55 ±6.51 232.09 ±8.69 252.01 ±14.39 261.61 ±14.94 247.23 ±10.08
<.01 <.01 <.01 0.55 0.74 0.04 0.61
EAA 81.90 ±2.03 84.44 ±3.00 89.85 ±3.51 87.28 ±2.31 95.16 ±2.26 96.84 ±1.67 91.44 ±6.87 85.88 ±5.45 101.59 ±1.72 103.01 ±3.60 103.64 ±0.59 105.48 ±2.38
<.01 0.96 0.02 0.96 0.77 0.31 0.74
NEAA 95.89 ±1.85 91.41 ±1.31 132.85 ±6.93 124.08 ±4.16 101.46 ±2.73 103.83 ±1.53 108.31 ±3.12 99.66 ±1.99 130.50 ±7.14 149.00 ±12.01 157.97 ±14.66 141.75 ±7.72
<.01 <.01 <.01 0.44 0.70 0.03 0.25
FAA 86.20 ±1.48 80.59 ±1.17 86.33 ±3.45 86.42 ±2.52 92.34 ±1.91 93.13 ±1.66 93.34 ±4.76 81.30 ±3.69 106.25 ±3.10 115.89 ±10.58 124.00 ±15.12 106.34 ±6.62
<.01 0.84 0.32 0.15 0.90 0.04 0.06
(Continued)
Table 6. (Continued)
Nursery Growing Finishing P-value
Item Landrace Bama mini-pig Landrace Bama mini-pig Landrace Bama mini-pig PP PG PP*G PD PP*D PG*D PP*G*D
GB diet
NRC diet
GB diet
NRC diet
GB diet
NRC diet
GB diet
NRC diet
GB diet
NRC diet
GB diet
NRC diet
EAA/ TAA
0.46
±0.002
0.48
±0.006
0.40
±0.007
0.42
±0.009
0.48
±0.004
0.48
±0.004
0.46
±0.017
0.46
±0.014
0.44
±0.010
0.41
±0.015
0.40
±0.023
0.43
±0.009
<.01 <.01 <.01 0.32 0.42 0.12 0.09
EAA/ NEAA
0.85
±0.006
0.92
±0.025
0.68
±0.022
0.71
±0.026
0.94
±0.014
0.93
±0.014
0.84
±0.055
0.86
±0.050
0.79
±0.034
0.71
±0.043
0.67
±0.061
0.75
±0.024
<.01 <.01 <.01 0.35 0.46 0.23 0.09
P, phase; G, genotype; P × G, phase ×genotype interaction; D, diet; P × D, phase × diet interaction; G × D, genotype × diet interaction; P × G × D, phase ×genotype × diet interaction; TAA, total AA; EAA, essential AA, including Arg, His, Ile, Met, Lys, Val, Leu, Phe, and Thr; NEAA, non-essential AA, including Asp, Ser, Glu, Gly, Ala, Tyr, and Pro; FAA,flavor AA, including Asp, Glu, Gly, Ala, and Arg.
Data were means plus pooled SEM. Effects were considered statistically significant whenP<0.05.
doi:10.1371/journal.pone.0138277.t006
Dietary
Protein
Content
and
Muscle
Amino
Acid
Metabolis
m
PLOS
ONE
|DOI:10.137
1/journal.p
one.0138277
September
22,
2015
9/2
Table 7. Effects of genotype, diet, and developmental phase on amino acid concentrations inbiceps femorismuscle of pigs (mg/g, as-fresh basis; n = 8).
Nursery Growing Finishing P-value
Item Landrace Bama mini-pig Landrace Bama mini-pig Landrace Bama mini-pig PP PG PP*G PD PP*D PG*D PP*G*D
GB diet NRC diet GB diet NRC diet GB diet NRC diet GB diet NRC diet GB diet NRC diet GB diet NRC diet Asp 16.13 ±0.55 15.59 ±0.25 16.98 ±0.55 17.51 ±0.49 18.58 ±0.23 17.15 ±1.17 18.70 ±1.55 17.79 ±0.41 20.17 ±0.43 20.80 ±0.33 16.95 ±1.95 21.64 ±1.08
<.01 0.66 0.06 0.26 <.01 0.03 0.23
Thr 8.08 ±0.21 8.06 ±0.10 8.58 ±0.24 8.86 ±0.25 9.63 ±0.22 8.88 ±0.47 10.65 ±0.71 9.15 ±0.22 10.31 ±0.20 10.78 ±0.12 10.14 ±0.35 11.13 ±0.47
<.01 0.01 0.37 0.62 <.01 0.93 0.33
Ser 5.97 ±0.19 6.22 ±0.13 7.06 ±0.23 7.18 ±0.17 6.72 ±0.29 6.11 ±0.27 8.59 ±0.64 7.21 ±0.14 7.99 ±0.17 8.29 ±0.10 7.74 ±0.30 8.74 ±0.45
<.01 <.01 <.01 0.74 <.01 0.83 0.19
Glu 33.65 ±1.54 31.87 ±0.66 33.83 ±1.11 34.12 ±0.92 38.10 ±0.78 35.91 ±2.36 41.34 ±3.09 34.50 ±0.75 38.90 ±0.73 40.42 ±0.49 36.86 ±0.98 41.52 ±2.07
<.01 0.50 0.67 0.38 <.01 0.91 0.13
Gly 8.20 ±0.23 7.93 ±0.09 8.62 ±0.19 8.67 ±0.18 8.27 ±0.14 7.79 ±0.50 10.01 ±0.72 8.74 ±0.22 9.48 ±0.24 9.92 ±0.12 9.57 ±0.34 10.46 ±0.35
<.01 <.01 0.05 0.53 <.01 0.98 0.27
Ala 12.28 ±0.53 12.96 ±0.53 13.61 ±0.64 14.29 ±0.91 10.73 ±0.49 10.10 ±0.89 17.87 ±1.42 13.03 ±0.75 20.32 ±1.84 32.39 ±3.69 28.93 ±5.25 25.14 ±3.05
<.01 0.03 0.22 0.51 0.05 <.01 <.01
Val 8.54 ±0.41 7.92 ±0.24 7.75 ±0.14 8.09 ±0.38 9.21 ±0.53 8.78 ±0.89 9.62 ±0.37 8.58 ±0.21 9.80 ±0.24 10.17 ±0.22 10.00 ±0.11 10.29 ±0.32
<.01 0.94 0.64 0.44 0.20 0.84 0.34
Met 2.66 ±0.12 2.61 ±0.08 5.32 ±0.66 5.76 ±0.25 3.71 ±0.44 3.54 ±0.52 3.72 ±0.39 2.95 ±0.09 5.95 ±0.77 6.56 ±0.52 5.63 ±0.47 5.00 ±0.42
<.01 0.04 <.01 0.72 0.57 0.39 0.39
Ile 7.12 ±0.48 6.42 ±0.32 7.26 ±0.30 7.45 ±0.22 8.23 ±0.20 8.18 ±0.61 8.50 ±0.94 6.89 ±0.23 8.11 ±0.33 8.85 ±0.15 8.24 ±0.46 8.86 ±0.47
<.01 0.84 0.17 0.57 0.05 0.58 0.10
Leu 14.34 ±0.60 13.91 ±0.35 16.50 ±0.85 16.56 ±0.59 15.25 ±0.25 15.67 ±1.03 21.10 ±3.38 15.31 ±0.59 17.07 ±0.90 19.05 ±0.68 17.65 ±1.68 20.77 ±2.07
<.01 <.01 0.63 0.88 0.01 0.27 0.06
Tyr 4.60 ±0.32 5.18 ±0.07 6.30 ±0.45 5.98 ±0.56 3.35 ±0.17 5.26 ±0.29 6.59 ±0.66 5.82 ±0.53 5.17 ±0.79 6.62 ±0.89 5.87 ±1.33 4.84 ±0.33
0.65 <.01 0.01 0.35 0.84 <.01 0.44
Phe 6.11 ±0.23 5.97 ±0.12 7.22 ±0.35 7.17 ±0.20 6.59 ±0.08 6.44 ±0.40 8.14 ±0.83 6.61 ±0.17 7.53 ±0.24 8.17 ±0.13 7.75 ±0.54 8.52 ±0.45
<.01 <.01 0.16 0.68 <.01 0.30 0.18
Lys 14.54 ±0.46 14.16 ±0.23 15.17 ±0.44 15.67 ±0.46 16.57 ±0.25 15.67 ±1.05 18.14 ±1.09 15.91 ±0.39 17.93 ±0.29 18.47 ±0.26 17.67 ±0.51 19.21 ±0.78
<.01 0.02 0.54 0.62 <.01 0.77 0.26
His 6.67 ±0.21 6.39 ±0.15 6.71 ±0.22 7.14 ±0.39 8.82 ±0.22 7.27 ±0.62 9.21 ±0.49 8.57 ±0.22 8.99 ±0.17 9.17 ±0.19 8.61 ±0.19 9.94 ±0.49
<.01 0.01 0.38 0.64 <.01 0.02 0.89
Arg 10.78 ±0.33 10.45 ±0.15 11.10 ±0.32 11.39 ±0.27 11.86 ±0.25 11.33 ±0.75 13.23 ±0.87 11.58 ±0.27 12.84 ±0.19 13.27 ±0.14 12.63 ±0.46 13.82 ±0.54
<.01 0.02 0.53 0.67 <.01 0.85 0.19
Pro 11.69 ±1.43 9.68 ±1.08 41.15 ±5.34 38.48 ±4.33 11.83 ±1.76 10.77 ±2.29 10.54 ±0.76 10.45 ±0.58 28.76 ±4.42 35.81 ±0.52 30.73 ±3.99 21.51 ±4.91
<.01 <.01 <.01 0.50 0.92 0.18 0.16
TAA 171.38 ±6.03 165.31 ±2.85 213.17 ±9.77 214.33 ±5.23 187.45 ±3.59 178.85 ±12.52 215.94 ±16.04 183.08 ±4.52 229.32 ±9.31 258.74 ±5.68 234.96 ±15.57 241.40 ±10.08
<.01 <.01 <.01 0.72 0.01 0.18 0.31
EAA 78.86 ±2.90 75.88 ±1.49 85.61 ±2.96 88.09 ±2.21 89.88 ±1.57 85.76 ±5.91 102.31 ±8.93 85.55 ±2.14 98.52 ±2.68 104.49 ±1.42 98.32 ±4.60 107.54 ±5.28
<.01 <.01 0.30 0.63 <.01 0.76 0.17
NEAA 92.52 ±3.19 89.44 ±1.42 127.56 ±6.98 126.24 ±4.20 97.57 ±2.15 93.09 ±6.74 113.63 ±7.13 97.54 ±2.42 130.80 ±6.72 154.25 ±4.57 136.64 ±11.05 133.86 ±7.37
<.01 <.01 <.01 0.82 0.04 0.06 0.19
FAA 81.04 ±2.40 78.80 ±0.79 84.14 ±1.91 85.99 ±2.29 87.53 ±1.22 82.28 ±5.48 101.14 ±6.40 85.64 ±1.89 101.72 ±2.61 116.80 ±3.24 104.94 ±5.93 112.59 ±4.68
<.01 0.02 0.18 0.89 <.01 0.23 0.24
(Continued)
Table 7. (Continued)
Nursery Growing Finishing P-value
Item Landrace Bama mini-pig Landrace Bama mini-pig Landrace Bama mini-pig PP PG PP*G PD PP*D PG*D PP*G*D
GB diet
NRC diet
GB diet
NRC diet
GB diet
NRC diet
GB diet
NRC diet
GB diet
NRC diet
GB diet
NRC diet
EAA/ TAA
0.46
±0.003
0.46
±0.002
0.40
±0.008
0.41
±0.009
0.48
±0.003
0.48
±0.005
0.47
±0.006
0.47
±0.002
0.43
±0.008
0.40
±0.006
0.42
±0.009
0.45
±0.015
<.01 <.01 <.01 0.91 0.78 0.03 0.02
EAA/ NEAA
0.85
±0.009
0.85
±0.006
0.68
±0.020
0.70
±0.027
0.92
±0.011
0.92
±0.018
0.89
±0.022
0.88
±0.006
0.76
±0.023
0.68
±0.017
0.73
±0.028
0.81
±0.049
<.01 <.01 <.01 0.87 0.86 0.03 0.02
P, phase; G, genotype; P × G, phase ×genotype interaction; D, diet; P × D, phase × diet interaction; G × D, genotype × diet interaction; P × G × D, phase ×genotype × diet interaction; TAA, total AA; EAA, essential AA, including Arg, His, Ile, Met, Lys, Val, Leu, Phe, and Thr; NEAA, non-essential AA, including Asp, Ser, Glu, Gly, Ala, Tyr, and Pro; FAA,flavor AA, including Asp, Glu, Gly, Ala, and Arg.
Data were means plus pooled SEM. Effects were considered statistically significant whenP<0.05.
doi:10.1371/journal.pone.0138277.t007
Dietary
Protein
Content
and
Muscle
Amino
Acid
Metabolis
m
PLOS
ONE
|DOI:10.137
1/journal.p
one.0138277
September
22,
2015
11
genotype, different responses were observed regarding interactions between developmental phases and diets for Asp level.
The BFM concentrations of most AA (except of Tyr) in Landrace pigs and Bama mini-pigs increased (P<0.05) with increasing age, as well as TAA, EAA, NEAA, and FAA of LDM (Table 7). There were marked differences in the concentrations of almost all AA between Land-race pigs and Bama mini-pigs, except for Asp, Glu Val, and Ile. When compared with LandLand-race pigs, Bama mini-pigs had higher concentrations of Thr, Ser, Gly, Ala, Leu, Phe, Lys, His, and Arg throughout the experimental period, as well as Met, Tyr, and Pro in the nursery phase, while lower concentrations of Met and Pro were measured in the finishing phase. Diet did not affect AA pool but there was interaction between pig genotype and developmental age on con-centrations of Ser, Gly, Met, Tyr, Pro, TAA, NEAA, and ratios of EAA/TAA and EAA/NEAA. Interactions between the developmental phases and the diets were noted notably for Asp, Thr, Ser, Glu, Gly, and Ala. Interactions between genotypes and diets for Asp, Ala, Tyr, His, EAA/ TAA and EAA/NEAA ratios, as well as an interaction between the developmental phases, genotypes, and diets was measured for the Ala concentration.
Muscle growth-related genes expression
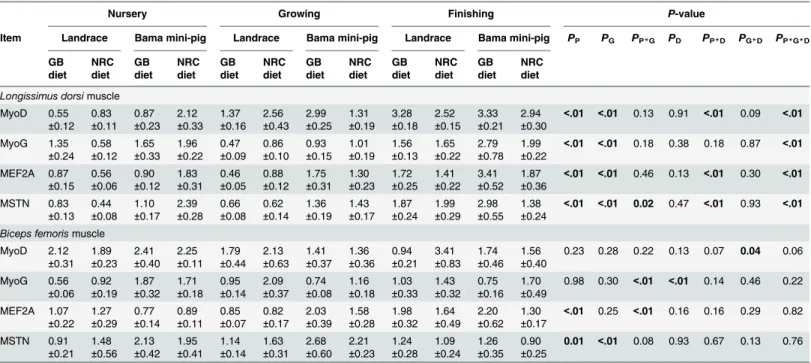
The mRNA levels for MyoD, MyoG, and MEF2A in LDM, and MEF2A in BFM increased (P<0.05) along the pig growth (Table 8). The mRNA levels for MyoD, MyoG, and MEF2A in LDM of Bama mini-pigs were much higher (P<0.05) than those in Landrace pigs. In addition, pigs fed the higher protein-NRC diet had higher (P<0.05) mRNA level for MyoG in BFM than
Table 8. Effects of genotype, diet, and phase on expression of muscle growth-related genes in muscle tissues of pigs (n = 8).
Nursery Growing Finishing P-value
Item Landrace Bama mini-pig Landrace Bama mini-pig Landrace Bama mini-pig PP PG PP*G PD PP*D PG*D PP*G*D
GB diet NRC diet GB diet NRC diet GB diet NRC diet GB diet NRC diet GB diet NRC diet GB diet NRC diet
Longissimus dorsimuscle MyoD 0.55 ±0.12 0.83 ±0.11 0.87 ±0.23 2.12 ±0.33 1.37 ±0.16 2.56 ±0.43 2.99 ±0.25 1.31 ±0.19 3.28 ±0.18 2.52 ±0.15 3.33 ±0.21 2.94 ±0.30
<.01 <.01 0.13 0.91 <.01 0.09 <.01
MyoG 1.35 ±0.24 0.58 ±0.12 1.65 ±0.33 1.96 ±0.22 0.47 ±0.09 0.86 ±0.10 0.93 ±0.15 1.01 ±0.19 1.56 ±0.13 1.65 ±0.22 2.79 ±0.78 1.99 ±0.22
<.01 <.01 0.18 0.38 0.18 0.87 <.01
MEF2A 0.87 ±0.15 0.56 ±0.06 0.90 ±0.12 1.83 ±0.31 0.46 ±0.05 0.88 ±0.12 1.75 ±0.31 1.30 ±0.23 1.72 ±0.25 1.41 ±0.22 3.41 ±0.52 1.87 ±0.36
<.01 <.01 0.46 0.13 <.01 0.30 <.01
MSTN 0.83 ±0.13 0.44 ±0.08 1.10 ±0.17 2.39 ±0.28 0.66 ±0.08 0.62 ±0.14 1.36 ±0.19 1.43 ±0.17 1.87 ±0.24 1.99 ±0.29 2.98 ±0.55 1.38 ±0.24
<.01 <.01 0.02 0.47 <.01 0.93 <.01
Biceps femorismuscle MyoD 2.12 ±0.31 1.89 ±0.23 2.41 ±0.40 2.25 ±0.11 1.79 ±0.44 2.13 ±0.63 1.41 ±0.37 1.36 ±0.36 0.94 ±0.21 3.41 ±0.83 1.74 ±0.46 1.56 ±0.40
0.23 0.28 0.22 0.13 0.07 0.04 0.06
MyoG 0.56 ±0.06 0.92 ±0.19 1.87 ±0.32 1.71 ±0.18 0.95 ±0.14 2.09 ±0.37 0.74 ±0.08 1.16 ±0.18 1.03 ±0.33 1.43 ±0.32 0.75 ±0.16 1.70 ±0.49
0.98 0.30 <.01 <.01 0.14 0.46 0.22
MEF2A 1.07 ±0.22 1.27 ±0.29 0.77 ±0.14 0.89 ±0.11 0.85 ±0.07 0.82 ±0.17 2.03 ±0.39 1.58 ±0.28 1.98 ±0.32 1.64 ±0.49 2.20 ±0.62 1.30 ±0.17
<.01 0.25 <.01 0.16 0.16 0.29 0.82 MSTN 0.91 ±0.21 1.48 ±0.56 2.13 ±0.42 1.95 ±0.41 1.14 ±0.14 1.63 ±0.31 2.68 ±0.60 2.21 ±0.23 1.24 ±0.28 1.09 ±0.24 1.26 ±0.35 0.90 ±0.25
0.01 <.01 0.08 0.93 0.67 0.13 0.76
P, phase; G, genotype; P × G, phase ×genotype interaction; D, diet; P × D, phase × diet interaction; G × D, genotype × diet interaction; P × G × D, phase ×genotype × diet interaction; MyoD, myogenic determining factor; MyoG, myogenin; MEF2A, myocyte-specific enhancer binding factor 2 A; MSTN, myostatin.
Data were means plus pooled SEM. Effects were considered statistically significant whenP<0.05.
doi:10.1371/journal.pone.0138277.t008
Dietary Protein Content and Muscle Amino Acid Metabolism
those fed the lower protein-GB diet. There was interaction between pig genotype and develop-mental age on the mRNA level for MSTN in LDM, and MyoG and MEF2A in BFM.
Abundance of mTOR pathway proteins
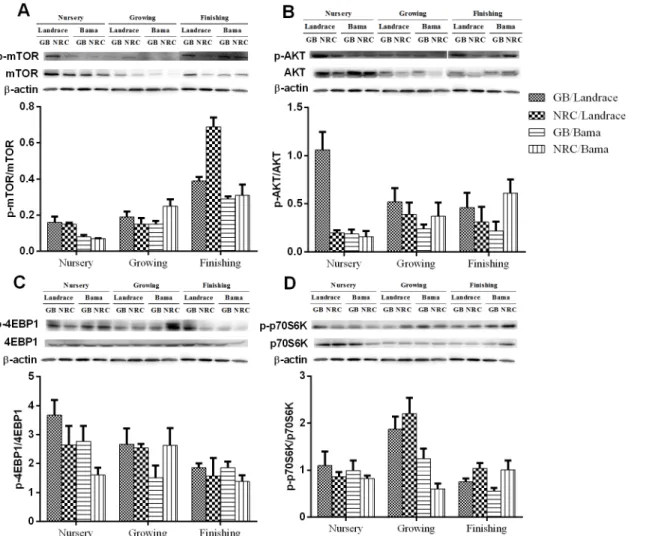
As shown inFig 1andTable 9, the protein abundances of mTOR, p-mTOR, protein kinase B (AKT), and p-AKT in the LDM decreased (P<0.05) in the growing phase and then increased in finishing phase. The protein abundances of 4EBP1 and 4EBP1 decreased, while ratio of p-mTOR/mTOR increased (P<0.05) gradually along the pig development. In addition, according to the pig genotypes, different responses were observed regarding the abundances of the mTOR pathway proteins. The protein abundances of mTOR and p-mTOR in Landrace pigs were greater (P<0.05) than those of Bama mini-pigs, especially in the nursery and growing phases. The protein abundance of p-AKT in the nursery phase of Landrace pigs was greater (P<0.05) than that of Bama mini-pigs, while that of p70S6K in the finishing phase was lower (P<0.05). The ratios of p-mTOR/mTOR and p-AKT/AKT in nursery and finishing phases of Landrace pigs were greater than Bama mini-pigs, as well as p-p70S6K/p70S6K in growing and finishing phases. The lower protein-GB diet increased protein abundances of mTOR and p-mTOR throughout the whole trial, and of AKT in the nursery phase, when compared with the higher-NRC diet. The protein abundance of p70S6K in Landrace pigs fed the greater protein-NRC diet was higher (P<0.05) than in those fed the lower protein-GB diet. In contrast, the protein abundance of p70S6K in Bama mini-pigs fed the GB diet was higher (P<0.05) than those fed the NRC diet.
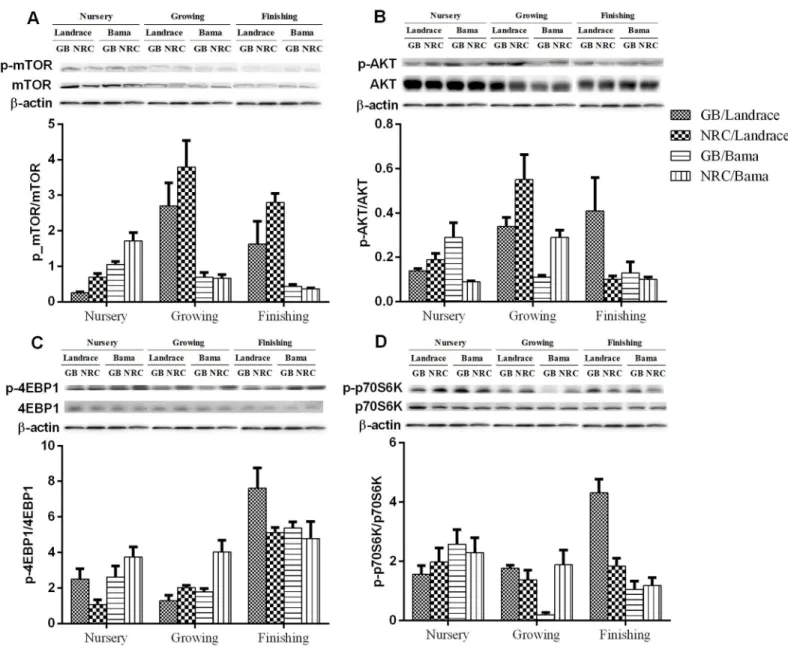
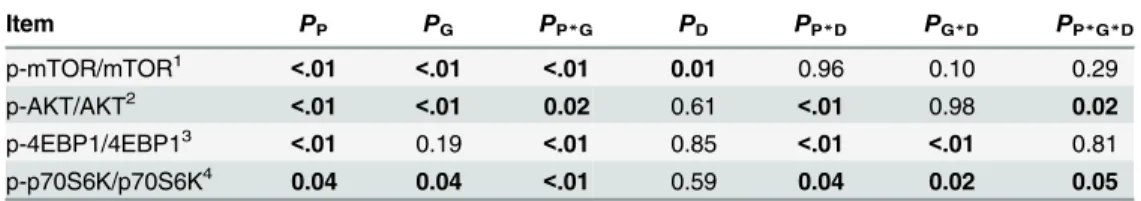
In the BFM, protein abundances of mTOR, mTOR, AKT, AKT, 4EBP1, p70S6K, and p-p70S6K decreased (P<0.05) with increasing age (Fig 2andTable 10). The protein abundance of p-4EBP1, ratios of p-4EBP1/4EBP1 and p-p70S6K/p70S6K decreased in the growing phase, and increased in the finishing phase. Ratios of p-mTOR/mTOR and p-AKT/AKT increased in growing phase, and decreased in finishing phase (P<0.05). The protein abundances of AKT in the nursery and growing phases, and p-AKT in growing phase, were higher in Landrace than in Bama mini-pigs (P<0.05), while that of AKT and p-4EBP1 were lower in Landrace than in Bama mini-pigs (P<0.05) in the finishing phase. Ratios of p-mTOR/mTOR, p-AKT/AKT, and p-p70S6K/p70S6K of Landrace pigs were greater than those of Bama mini-pigs in the growing and finishing phases. The lower protein-GB diet increased (P<0.05) the protein abundance of mTOR in Bama mini-pigs, notably in the nursery and growing phases. The greater protein-NRC diet increased (P<0.05) the ratio of p-mTOR/mTOR of Landrace pigs, when compared with the GB diet.
Discussion
Due to its large mass (representing 40–45% of body weight), skeletal muscle is the largest reser-voir of both peptide-bound and free AA in the body [33]. Based on growth test or nitrogen bal-ance assay, AA have been traditionally classified as nutritionally essential (indispensable) or non-essential (dispensable) for animals [1]. Animals have dietary requirements for both EAA (Met, Lys, Try, Thr, Phe, Ile, Val, Leu, and His) and NEAA to achieve maximum growth and production performance [34,35]. Some amino acids like arginine are considered to be semi-essential as they have to be provided in the diet to achieve optimal performance in the growth phase. According to the ideal model of FAO/WHO, a good balance of AA has to be provided for growing animals. Ratios of WEAA/WTAAin the present study were all above 40%, and ratios of WEAA/WNEAAwere more than 60%. Furthermore, pig muscle AA concentrations in the present study were increased gradually with increasing age, suggesting, as expected an enhanced deposition of muscle protein along the pig development.
Dietary Protein Content and Muscle Amino Acid Metabolism
Fig 1. Representative Western blot analysis of total and phosphorylated (A) mTOR (Ser2448), (B) AKT (Ser473), (C) 4EBP1 (Thr70), (D) p70S6K, andβ-actin in piglongissimus dorsi muscle.GB diet, lower protein-Chinese conventional diet; NRC diet, higher protein-NRC diet.
doi:10.1371/journal.pone.0138277.g001
Table 9. P-values of ratios of phosphorylated- to total-protein abundance of mTOR pathway in longis-simus dorsimuscle of pigs.
Item PP PG PP*G PD PP*D PG*D PP*G*D
p-mTOR/mTOR1 <.01 <.01 <.01 <.01 <.01 0.24 <.01
p-AKT/AKT2 0.97
0.04 0.10 0.24 0.04 <.01 0.43
p-4EBP1/4EBP13 0.07 0.13 0.59 0.36 0.18 0.66 0.63
p-p70S6K/p70S6K4
<.01 <.01 <.01 0.97 0.17 0.38 0.18
1
Ratio of phosphorylated- to total-protein abundance of mechanistic target of rapamycin;
2
ratio of phosphorylated- to total-protein abundance of protein kinase B;
3
ratio of phosphorylated- to total-protein abundance of 4E binding protein 1;
4
ratio of phosphorylated- to total-protein abundance of p70 ribosomal protein S6 kinase.
P, phase; G, genotype; P × G, phase ×genotype interaction; D, diet; P × D, phase × diet interaction; G × D, genotype × diet interaction; P × G × D, phase ×genotype × diet interaction.
doi:10.1371/journal.pone.0138277.t009
Dietary Protein Content and Muscle Amino Acid Metabolism
Meat flavor mainly depends on two aspects: taste and aroma [36,37]. The taste comes from flavor substances such as AA and small peptides, and aroma mainly derives from volatile sub-stances released during meat cooking. Each AA contributes, to different degrees, to the taste of meat [38]. The active compounds in meat not only benefit the tastes as themselves, but also fur-ther react with each ofur-ther, generating some aroma components through several pathways, such as the Maillard reaction [39]. The Maillard reaction between sulfur AA and reducing sugar can produce a meaty aroma [40]. An important observation in the present study is that Bama mini-pigs had higher muscle concentrations of Met, Phe, Tyr, Pro, and Ser in the nursery phase, and of Gly, Ala, and Ser in the growing phase than those of Landrace pigs. According to the above-mentioned rationale, the muscles of Bama mini-pigs can generate more taste-active compounds during the cooking process; a fact that is likely related to its quality in terms of organoleptic characteristics.
Fig 2. Representative Western blot analysis of the expression of the proteins listed inFig 1in pigbiceps femoris muscle.
doi:10.1371/journal.pone.0138277.g002
Dietary Protein Content and Muscle Amino Acid Metabolism
Dietary protein had minimal effect on muscle AA concentration in the current study. How-ever, as the age increased, the AA pool was gradually regulated not only according to the die-tary protein intake, but also according to the muscle type. In the LDM (type II fiber), pig genotype interacted markedly in the finishing phase with dietary protein intake regarding TAA, NEAA, and FAA. In addition, concentrations of the above-mentioned AA in Landrace pigs fed the higher protein-NRC diet were higher than those fed the GB diet. Concentrations of the above-mentioned AA in Bama mini-pigs fed the lower protein-GB diet were higher than those fed the NRC diet. In the BFM (type II fiber), pig genotype remarkably affected the AA pools in the nursery phase; whereas in the finishing phase, diet had a greater effect on most AA measured. Overall, the NRC diet increased concentrations of most AA more than the GB diet. On the other hand, our data suggest that the AA released from protein was highly muscle-dependent. The muscle enzymes, including calpains and cathepsins, are able to degrade myofi-brillar proteins and release small peptides and AA. The different enzyme activities are responsi-ble for the differences in the release of AA among the examined muscles [41]. The AA profiles in the present study may be related, at least in part, to the differences in muscle enzyme activity between LDM and BFM, but further experiments outside the scope of this study are required to test this hypothesis.
Skeletal muscle cells were the first cell type shown to arise through the activity of a single DNA binding transcription factor. This factor, named myogenic determining factor (MyoD), represented a paradigm for cell specification [42,43], and its discovery triggered an increasing interest for the identification of acting transcription factors such as myogenic regulatory factors (MRFs) [44], myocyte-specific enhancer binding factor 2 (MEF2) [45,46], and transforming growth factor beta (TGF-β) [47,48]. Previous studies have indicated that MRFs, including MyoD, MyoG, myogenic factor 5 (Myf5), and myogenic factor 6 (Myf6), function in processing myogenesis, and their expression has been used as an indicator of muscle development [49] and meat quality [50]. In each stage of myogenesis, different MRFs show various functions. In our study, expressions of MyoD, MyoG, and MEF2A in LDM, and MEF2A in BFM increased as the age increased, in association with enhanced muscle growth. In addition, the regulatory effect of MRF on the generation of skeletal muscle also depends on the interaction between cells and other related factors, such as MEF2 family factor interactions [51]. This factor is also involved in the regulation of skeletal muscle growth, by controlling the muscle cell differentia-tion and proliferadifferentia-tion [52]. In the present study, the mRNA levels for MyoD, MyoG, and MEF2A in LDM of Bama mini-pigs were higher than in Landrace pigs, in accordance with the Table 10.P-values of ratios of phosphorylated- to total-protein abundance of mTOR pathway in
biceps femorismuscle of pigs.
Item PP PG PP*G PD PP*D PG*D PP*G*D
p-mTOR/mTOR1 <.01 <.01 <.01 0.01 0.96 0.10 0.29
p-AKT/AKT2
<.01 <.01 0.02 0.61 <.01 0.98 0.02
p-4EBP1/4EBP13
<.01 0.19 <.01 0.85 <.01 <.01 0.81 p-p70S6K/p70S6K4 0.04 0.04
<.01 0.59 0.04 0.02 0.05 1Ratio of phosphorylated- to total-protein abundance of mechanistic target of rapamycin;
2ratio of phosphorylated- to total-protein abundance of protein kinase B; 3ratio of phosphorylated- to total-protein abundance of 4E binding protein 1;
4ratio of phosphorylated- to total-protein abundance of p70 ribosomal protein S6 kinase.
P, phase; G, genotype; P × G, phase ×genotype interaction; D, diet; P × D, phase × diet interaction; G × D, genotype × diet interaction; P × G × D, phase ×genotype × diet interaction.
doi:10.1371/journal.pone.0138277.t010
Dietary Protein Content and Muscle Amino Acid Metabolism
previous study by Wang et al. [53]. These latter authors reported that the expression levels of MyoD and MyoG in the Lantang pigs, another indigenous Chinese pig genotype, were higher than in Landrace pigs. Interestingly, the mRNA levels for MSTN in LDM and BFM of Bama mini-pigs were higher than in Landrace pigs. MSTN, belonging to the superfamily of TGF-β, is a glycoprotein widely expressed with functional specificity in skeletal muscle [54]. Indeed, high expression of MSTN in transgenic animal resulted in muscle atrophy [55], and the mutation of MSTN in cattle caused the so-called "double" muscle phenotype [56,57]. Early studies sug-gested that MEF2 may regulate the muscle fiber type conversion by combining with related sites of MSTN promoter [58]. Based on this notion, although Bama mini-pigs had increased mRNA levels for MyoD, MyoG, and MEF2A, the MSTN expression was however higher than in Landrace pigs. This may explain differences in the muscle growth between Landrace and Bama mini-pigs.
The phosphorylation of p70S6K and 4EBP1 by mTOR and the phosphorylation down-stream of ribosomal protein S6 and EIF-4B stimulate translational initiation and contribute to cell growth. Protein deposition is linked with animal growth periods. In the present study, the expression levels of most proteins of the mTOR signaling pathway decreased with increasing age, including 4EBP1 and p-4EBP1 in LDM, and AKT, p-AKT, mTOR, p-mTOR, 4EBP1, p70S6K, p-p70S6K, and ratios of p-mTOR/mTOR and p-AKT/AKT in BFM of pigs, regardless of pig genotype or dietary protein level. Our data are consistent with a previous study by Kimball et al. (2002) which reported that the fractional rate of protein synthesis in pig skeletal muscle is high at birth and declines with age; meanwhile, the muscle abundance of mTOR decreased by 75% in 26-vs. 7-d-old pigs [59].
Using various technologies of two-dimensional electrophoresis, proteomic and transcrip-tomic analysis, researchers found that the skeletal muscle protein expression profiles were greatly different among pig genotypes [60–62]. In this study, pig genotype had a significant effect on the skeletal muscle protein expression profiles. The protein abundances of p-AKT, mTOR, p-mTOR, and p70S6K, and ratios of p-mTOR/mTOR, p-AKT/AKT, and p-p70S6K/ p70S6K in LDM, and of AKT and p-AKT in BFM were higher in Landrace pigs than in Bama mini-pigs. These results indicate that genotype differences in growth performance and meat quality might be related to various expression levels of protein deposition- and muscle growth-related proteins.
Nutrient-mediated increases in muscle protein synthesis preserve the net muscle protein equilibrium (fasted lossesvs. fed gains), which ensures a constant muscle mass at a given devel-opmental stage. Nutritional factors, such as Gln [63,64], glutamate [65], putrescine [66], and amino acid mixture [67], have direct and/or indirect effects on the mTOR pathway or on the effectors of the mTOR pathway. S6K1 and 4EBP1, two downstream target proteins of mTOR pathway [68], are involved in the regulation of synthesis and metabolism, including synthesis of protein and ribosome, and biosynthesis and catabolism of mitochondria [69]. A previous study found that AA starvation could lead to dephosphorylation of S6K1 and 4EBP1 in cul-tured mammalian cells [70]. In skeletal muscle, physiological levels of AA stimulate the phos-phorylation of mTOR, which, in turn, enhances the phosphos-phorylation of S6K1 and 4EBP1, and leads to an increased synthesis of proteins. Interestingly, the dietary protein level in this study had a significant effect on the mTOR signaling pathway with interaction according to the pig genotype studied. The protein abundances of mTOR and p70S6K in Bama mini-pigs fed the lower protein-GB diet were higher than those fed the NRC diet. In contrast, the protein abun-dance of p70S6K and ratio of p-mTOR/mTOR in Landrace pigs fed the higher protein-NRC diet were higher than those fed the GB diet. These results suggest that high protein intake may not always be positively related to the rate of muscle protein synthesis and increase in the skele-tal muscle mass, challenging the results of several previous studies [71,72]. In Bama mini-pigs,
Dietary Protein Content and Muscle Amino Acid Metabolism
the low-protein diet enhanced the protein translation, which was beneficial regarding the AA pool and protein synthesis. These findings suggest that the utilization of nutrients in Landrace pigs and Bama mini-pigs are different.
In conclusion, our study indicates interactions between genotype and age for most AA regarding their concentration in skeletal muscles and protein synthesis-related signaling path-ways. The concentrations of several AA related to taste and aroma at the early stage in Bama mini-pigs, and mRNA levels for MyoD, MyoG, MEF2A, and MSTN were higher than in Land-race pigs, while protein and phosphorylated levels of AKT, mTOR and p70S6K, and ratios of p-mTOR/mTOR, p-AKT/AKT, and p-p70S6K/p70S6K were lower. In addition, the lower pro-tein-GB diet increased the protein abundances of mTOR and p70S6K in Bama mini-pigs, but decreased the protein abundance of p70S6K in Landrace pigs. The higher protein-NRC diet increased ratio of p-mTOR/mTOR in Landrace pigs. These findings suggest that variations in AA deposition and protein synthesis are greatly regulated by dietary protein level, being differ-ent according to pig genotype, developmdiffer-ental stage, and muscle type. Our study not only pro-vides an important basis for further studies aiming at deciphering the molecular mechanisms responsible for differences in growth rate and meat quality between different pig genotypes, but also contributes to the optimization of animal feeding.
Author Contributions
Conceived and designed the experiments: XK YY. Analyzed the data: YD. Contributed reagents/materials/analysis tools: BT CH. Wrote the paper: FL FB. Ran the whole feed animal trials: YYL YHL.
References
1. Wu GY, Wu ZL, Dai ZL, Yang Y, Wang WW, Liu C, et al. (2013) Dietary requirements of nutritionally non-essential amino acids by animals and humans. Amino Acids 44:1107–1113. doi: 10.1007/s00726-012-1444-2PMID:23247926
2. Dickinson JM, Rasmussen BB (2013) Amino acid transporters in the regulation of human skeletal mus-cle protein metabolism. Curr Opin Clin Nutr Metab Care 16(6):638–644. doi:10.1097/MCO.
0b013e3283653ec5PMID:24100668
3. Matsakas A, Patel K (2009) Skeletal muscle fibre plasticity in response to selected environmental and physiological stimuli. Histol Histopathol 24(5):611–629. PMID:19283669
4. Bizen N, Shimizu T, Inoue T, Kagawa T, Taga T (2010) Cross-talk between growth and differentiation pathways in cell fate determination in the developing brain. Differentiation 80:S8–S8.
5. Imamura T, Uesaka M, Nakashima K (2014) Epigenetic setting and reprogramming for neural cell fate determination and differentiation. Philos Trans R Soc Lond B Biol Sci 369(1652).
6. Yao K, Yin YL, Chu WY, Li ZQ, Deng D, Li TJ, et al. (2008) Dietary arginine supplementation increases mTOR signaling activity in skeletal muscle of neonatal pigs. J Nutr 5:867–872.
7. Yin YL and Tan BE (2010) Manipulation of dietary nitrogen, amino acids and phosphorus to reduce environmental impact of swine production and enhance animal health. J Food Agric Environ 8: 447–
462.
8. Yin YL, Yao K, Liu ZJ, Gong M, Ruan Z, Deng D, et al. (2010) Supplementing L-leucine to a low-protein diet increases tissue protein synthesis in weanling pigs. Amino Acids 39:1477–1486. doi:10.1007/ s00726-010-0612-5PMID:20473536
9. Duan YH, Li FN, Li YH, Tang YL, Kong XF, Feng ZM, et al. (2015) The role of leucine and its metabo-lites in protein and energy metabolism. Amino Acids doi:10.1007/s00726-015-2067-1
10. Liu YY, Li FN, He LY, Tan BE, Deng JP, Kong XF, et al. (2015) Dietary protein intake affects expression of genes for lipid metabolism in porcine skeletal muscle in a genotype-dependent manner. British J Nutr 113, 1069–1077.
11. Kong XF, Wang XQ, Yin YL, Li XL, Gao HJ, Bazer F, et al. (2014) Putrescine stimulates the mTOR sig-naling pathway and protein synthesis in porcine trophectoderm cells. Biol Reprod 91(5):106, 1–10. doi:
10.1095/biolreprod.113.113977PMID:25253735
Dietary Protein Content and Muscle Amino Acid Metabolism
12. Kong XF, Tan B, Yin YL, Gao HJ, Li XL, Jaeger LA, et al (2012) L-Arginine stimulates the mTOR signal-ing pathway and protein synthesis in porcine trophectoderm cells. J Nutr Biochem 9:1178–1183.
13. Li FN, Yin YL, Tan B, Kong XF, Wu GY (2011) Leucine nutrition in animals and humans: mTOR signal-ing and beyond. Amino Acids 5:1185–1193.
14. Shaw RJ (2008) mTOR signaling: RAG GTPases transmit the amino acid signal. Trends Biochem Sci 33(12):565–568. doi:10.1016/j.tibs.2008.09.005PMID:18929489
15. Zhang SH, Ren M, Zeng XF, He PL, Ma X, Qiao SY (2014) Leucine stimulates ASCT2 amino acid transporter expression in porcine jejunal epithelial cell line (IPEC-J2) through PI3K/Akt/mTOR and ERK signaling pathways. Amino Acids 46(12):2633–2642. doi:10.1007/s00726-014-1809-9PMID:
25063204
16. Duan YH, Li FN, Tan KR, Liu HN, Li YH, Liu YY (2015) Key mediators of intracellular amino acids sig-naling to mTORC1 activation. Amino Acids 47(5):857–867. doi:10.1007/s00726-015-1937-xPMID:
25701492
17. Deng D, Yao K, Chu WY, Li TJ, Huang RL, Yin YL (2009) Impaired translation initiation activation and reduced protein synthesis in weaned piglets fed a low-protein diet. J Nutr Biochem 20(7):544–552. doi:
10.1016/j.jnutbio.2008.05.014PMID:18789668
18. Deng HL, Zheng AJ, Liu GH, Chang WH, Zhang S, Cai HY (2014) Activation of mammalian target of rapamycin signaling in skeletal muscle of neonatal chicks: Effects of dietary leucine and age. Poultry Sci 93(1):114–121.
19. Mizunoya W, Iwamoto Y, Shirouchi B, Sato M, Komiya Y, Razin FR (2013) Dietary fat influences the expression of contractile and metabolic genes in rat skeletal muscle. PLoS One 8(11):e80152. doi:10. 1371/journal.pone.0080152PMID:24244634
20. National Research Council (NRC) (2012) Nutrient Requirements of Swine. Washington, DC: National Academy Press.
21. Ministry of Agriculture of the People’s Republic of China (2004) Feeding Standard of Swine (GB, NY/T 65–2004). Beijing: China Agriculture Press.
22. Feng ZM, Zhou XL, Wu F, Yao K, Kong XF, Li TJ (2014) Both dietary supplementation with monoso-dium L-glutamate and fat modify circulating and tissue amino acid pools in growing pigs, but with little interactive effect. PLoS One 9(1):e84533. doi:10.1371/journal.pone.0084533PMID:24465415 23. Tan B, Yin YL, Liu ZQ, Li XG, Xu HJ, Kong XF, et al. (2009) Dietary l-arginine supplementation
increases muscle gain and reduces body fat mass in growing-finishing pigs. Amino Acids 1:169–175.
24. Tan B, Yin YL, Liu ZQ, Tang WJ, Xu HJ, Kong XF, et al. (2011) Dietary L-arginine supplementation dif-ferentially regulates expression of lipid-metabolic genes in porcine adipose tissue and skeletal muscle. J Nutr Biochem 5:441–445.
25. Wu X, Xie C, Yin YL, Li FN, Li TJ, Huang RL, et al. (2013a) Effect of L-arginine on HSP70 expression in liver in weanling piglets. BMC Vet Res, 9:63.
26. Yang CB, Li AK, Yin YL, Huang RL, Li TJ, Li LL, et al. (2005) Effects of dietary supplementation of cys-teamine on growth performance, carcass quality, serum hormones and gastric ulcer in finishing pigs. J Sci Food Agr 85: 1947–1952.
27. Wu X, Shu XG, Xie CY, Li J, Hu JN, Yin YL, et al. (2013b) The acute and chronic effects of monosodium L-glutamate on serum iron and total iron-binding capacity in the jugular artery and vein of pigs. Biol Trace Elem Res 153:191–195.
28. Wu X, Zhang J, Liu ZQ, Li TJ, Yin YL (2012) Effects of oral supplementation with glutamate or combina-tion of glutamate and N-carbamylglutamate on intestinal mucosa in piglets. J Anim Sci 90: 337–339. doi:10.2527/jas.53752PMID:23365372
29. Yin FG, Liu YL, Yin YL, Kong XF, Huang RL, Li TJ, et al. (2009) Dietary supplementation with Astraga-luspolysaccharide enhances ileal digestibilities and serum concentrations of amino acids in early weaned piglets. Amino Acids 2:263–270.
30. Yin FG, Zhang ZZ, Huang J, Yin YL (2010) Digestion rate of dietary starch affects systemic circulation of amino acids in weaned pigs. Br J Nutr 103: 1404–1412. PMID:20102672
31. Kong XF, Yin FG, He QH, Liu HJ, Li TJ, Huang RL, et al. (2009)Acanthopanax senticosusextract as a dietary additive enhances the apparent ileal digestibility of amino acids in weaned piglets. Livest Sci 123(2–3):261–267.
32. Zhang J, Yin YJ, Shu X, Li TJ, Li FN, Tan BE, et al. (2013) Oral administration of MSG increases expression of glutamate receptors and transporters in the gastrointestinal tract of young piglets. Amino Acids 45:1169–1177. doi:10.1007/s00726-013-1573-2PMID:23943043
33. Davis TA, Fiorotto ML (2009) Regulation of muscle growth in neonates. Curr Opin Clin Nutr Metab Care 12(1):78–85. doi:10.1097/MCO.0b013e32831cef9fPMID:19057192
Dietary Protein Content and Muscle Amino Acid Metabolism
34. Phang JM, Liu W, Hancock C (2013) Bridging epigenetics and metabolism role of non-essential amino acids. Epigenetics 8(3):231–236. doi:10.4161/epi.24042PMID:23422013
35. Hou YQ, Yin YL, Wu GY (2015) Dietary essentiality of‘‘nutritionally non-essential amino acids for ani-mals and humans. Exp Biol Med doi:10.1177/1535370215587913
36. Jayasena DD, Ahn DU, Nam KC, Jo C (2013) Flavour chemistry of chicken meat: A review. Asian-Aust J Anim Sci 26(5):732–742.
37. Maughan C, Tansawat R, Cornforth D, Ward R, Martini S (2012) Development of a beef flavor lexicon and its application to compare the flavor profile and consumer acceptance of rib steaks from grass- or grain-fed cattle. Meat Sci 90(1):116–121. doi:10.1016/j.meatsci.2011.06.006PMID:21703775 38. Kato H, Rhue MR, Nishimura T (1989) Role of free amino-acids and peptides in food taste. In: Teranishi
R, Buttery RG, Shahidi F, editors. Flavor chemistry: trends and developments. Washington, D.C.: American Chemical Society. p 158–174.
39. Newton AE, Fairbanks AJ, Golding M, Andrewes P, Gerrard JA (2012) The role of the Maillard reaction in the formation of flavour compounds in dairy products—not only a deleterious reaction but also a rich source of flavour compounds. Food Funct 3(12):1231–1241. doi:10.1039/c2fo30089cPMID:
22948260
40. Yu AN, Tan ZW, Wang FS (2012) Mechanism of formation of sulphur aroma compounds from L-ascor-bic acid and L-cysteine during the Maillard reaction. Food Chem 132(3):1316–1323.
41. Feidt C, Petit A, BruasReignier F, BrunBellut J (1996) Release of free amino-acids during ageing in bovine meat. Meat Sci 44(1–2):19–25. PMID:22060752
42. Cho OH, Mallappa C, Hernandez-Hernandez JM, Rivera-Perez JA, Imbalzano AN (2015) Contrasting roles for MyoD in organizing myogenic promoter structures during embryonic skeletal muscle develop-ment. Dev Dyn 244(1):43–55. doi:10.1002/dvdy.24217PMID:25329411
43. Wood WM, Etemad S, Yamamoto M, Goldhamer DJ (2013) MyoD-expressing progenitors are essential for skeletal myogenesis and satellite cell development. Dev Biol 384(1):114–127. doi:10.1016/j.ydbio. 2013.09.012PMID:24055173
44. Dessalle K, Euthine V, Chanon S, Delarichaudy J, Fujii I, Rome S, et al. (2012) SREBP-1 transcription factors regulate skeletal muscle cell size by controlling protein synthesis through myogenic regulatory factors. PLoS One 7(11):e50878. doi:10.1371/journal.pone.0050878PMID:23226416
45. Liu N, Nelson BR, Bezprozvannaya S, Shelton JM, Richardson JA, Bassel-duby R, et al. (2014) Requirement of MEF2A, C, and D for skeletal muscle regeneration. P Natl Acad Sci USA 111 (11):4109–4114.
46. Tai PWL, Fisher-Aylor KI, Himeda CL, Smith CL, Mackenzie AP, Helterline DL, et al. (2011) Differentia-tion and fiber type-specific activity of a muscle creatine kinase intronic enhancer. Skeletal muscle 1:25. doi:10.1186/2044-5040-1-25PMID:21797989
47. Kubiczkova L, Sedlarikova L, Hajek R, Sevcikova S (2012) TGF-beta—an excellent servant but a bad master. J Transl Med 10:183. doi:10.1186/1479-5876-10-183PMID:22943793
48. Guo X, Wang XF (2009) Signaling cross-talk between TGF-beta/BMP and other pathways. Cell Res 19(1):71–88. doi:10.1038/cr.2008.302PMID:19002158
49. Shi XZ, Garry DJ (2006) Muscle stem cells in development, regeneration, and disease. Genes Dev 20 (13):1692–1708. PMID:16818602
50. Zhao X, Mo DL, Li AN, Gong W, Xiao SQ, Zhang Y, et al. (2011) Comparative analyses by sequencing of transcriptomes during skeletal muscle development between pig breeds differing in muscle growth rate and fatness. PLoS One 6(5):18.
51. Perry RL, Rudnick MA (2000) Molecular mechanisms regulating myogenic determination and differenti-ation. Front Biosci 5:D750–D767. PMID:10966875
52. Bryantsev AL, Baker PW, Lovato TL, Jaramillo MS, Cripps RM (2012) Differential requirements for Myocyte Enhancer Factor-2 during adult myogenesis inDrosophila. Dev Biol 361(2):191–207. doi:10. 1016/j.ydbio.2011.09.031PMID:22008792
53. Wang XQ, Yang WJ, Yang Z, Shu G, Wang SB, Jiang QY, et al. (2012) The differential proliferative abil-ity of satellite cells in Lantang and Landrace pigs. PLoS One 7(3):e32537. doi:10.1371/journal.pone. 0032537PMID:22427853
54. Huang ZQ, Chen XL, Chen DW (2011) Myostatin: A novel insight into its role in metabolism, signal path-ways, and expression regulation. Cell Signal 23(9):1441–1446. doi:10.1016/j.cellsig.2011.05.003
PMID:21609762
55. McFarlane C, Plummer E, Thomas M, Hennebry A, Ashby M, Ling N, et al. (2006) Myostatin induces cachexia by activating the ubiquitin proteolytic system through an NF-kappa B-independent, FoxO1-dependent mechanism. J Cell Physiol 209(2):501–514. PMID:16883577
Dietary Protein Content and Muscle Amino Acid Metabolism