Intake of Meat Proteins Substantially
Increased the Relative Abundance of Genus
Lactobacillus
in Rat Feces
Yingying Zhu, Xisha Lin, He Li, Yingqiu Li, Xuebin Shi, Fan Zhao, Xinglian Xu, Chunbao Li*, Guanghong Zhou*
Key Laboratory of Meat Processing and Quality Control, MOE; Key Laboratory of Animal Products Processing, MOA; Jiang Synergetic Innovation Center of Meat Processing and Quality Control; Nanjing Agricultural University; Nanjing 210095, P.R. China
*[email protected](GZ);[email protected](CL)
Abstract
Diet has been shown to have a critical influence on gut bacteria and host health, and high levels of red meat in diet have been shown to increase colonic DNA damage and thus be harmful to gut health. However, previous studies focused more on the effects of meat than of meat proteins. In order to investigate whether intake of meat proteins affects the composi-tion and metabolic activities of gut microbiota, feces were collected from growing rats that were fed with either meat proteins (from beef, pork or fish) or non-meat proteins (casein or soy) for 14 days. The resulting composition of gut microbiota was profiled by sequencing the V4-V5 region of the 16S ribosomal RNA genes and the short chain fatty acids (SCFAs) were analyzed using gas chromatography. The composition of gut microbiota and SCFA levels were significantly different between the five diet groups. At a recommended dose of 20% protein in the diet, meat protein-fed rats had a higher relative abundance of the benefi-cial genusLactobacillus, but lower levels of SCFAs and SCFA-producing bacteria including Fusobacterium,BacteroidesandPrevotella, compared with the soy protein-fed group. Fur-ther work is needed on the regulatory pathways linking dietary protein intake to gut
microbiota.
Introduction
Meat has exerted a crucial role in human evolution and is an important component of a healthy and balanced diet because of its high abundance of proteins, fatty acids, minerals and vitamins. Meat proteins are composed of more balanced essential amino acids than plant proteins and
have diverse biological functions [1]. However, the global transition towards an increasing
pro-portion of red meat in human diets may be associated with metabolic disorders [2]. Numerous
epidemiological studies have shown that excessive intake of red meat results in the
develop-ment of cardiovascular disease and colorectal cancer [3–5]. The possible association between
red meat intake and colorectal cancer is commonly explained by production of carcinogens
a11111
OPEN ACCESS
Citation:Zhu Y, Lin X, Li H, Li Y, Shi X, Zhao F, et al. (2016) Intake of Meat Proteins Substantially Increased the Relative Abundance of Genus
Lactobacillusin Rat Feces. PLoS ONE 11(4): e0152678. doi:10.1371/journal.pone.0152678
Editor:Brenda A Wilson, University of Illinois at Urbana-Champaign, UNITED STATES
Received:November 23, 2015
Accepted:March 17, 2016
Published:April 4, 2016
Copyright:© 2016 Zhu et al. This is an open access article distributed under the terms of theCreative Commons Attribution License, which permits unrestricted use, distribution, and reproduction in any medium, provided the original author and source are credited.
Data Availability Statement:All relevant data are within the paper and its Supporting Information files.
Funding:The work was supported by grant of 31471600 and 31530054 (National Natural Science Foundation of China;http://www.nsfc.gov.cn/), 20110097110024 and NCET-11-0668 (Ministry of Education of China;http://www.moe.edu.cn/). Authors GZ and CL received the funding. The funders had no role in study design, data collection and analysis, decision to publish, or preparation of the manuscript.
during cooking or processing of meat products [6]. Recently, the International Agency for Research on Cancer, a branch of the World Health Organization, issued a report in which red
meat and processed meat were listed as carcinogenic agents (
http://www.iarc.fr/en/media-centre/pr/2015/pdfs/pr240_E.pdf), but the conclusions of this report have been debated world-wide. However, it is the case that excessive intake of red meat or any other foods may have a detrimental effect on human health, probably inducing some kinds of metabolic disorders. Meat proteins have been distinguished by its richness in all the essential amino acids with no limiting amino acids, but few data are available on the physiological responses of our bodies to different types of dietary protein. A previous study indicated that substitution of red meat by other healthy protein sources such as nut, soy, fish or chicken, decreased the incidence of
car-diovascular disease and colorectal cancer [7]. However, the underlying mechanism for this is
not clear.
Foods are mainly digested in the stomach and the small intestine, but indigestible food com-pounds and endogenous proteins secreted in the small intestine enter into the large intestine
for microbial fermentation and putrefaction, which shape a diverse gut microbiota [8,9]. The
bacteria residing in the gut are recognized as an essential "organ" and a crucial factor in human
physiology and nutrition [10–13]. This organ may protect the host against pathogens and
enhance metabolic capabilities [14]. Previous studies focused mostly on the nutritional
rele-vance of dairy and plant proteins to meat proteins [15–17]. Protein level and source (e.g., milk
or soy) may affect the intestinal microbial balance [18]. Limited studies have been conducted
to investigate the effect of meat, rather than meat proteins, on gut health. [19,20]. In vitro
incu-bation of cooked beef, chicken or fish meat with human feces led to a significant difference in
the numbers ofBifidobacteriumspp. andBacteroides[21]. It is not known whether short-term
dietary intake of different meat proteins affects the composition of gut microbiota and their activities.
In the present study, AIN-93G rat diets were prepared using proteins from beef, casein, fish, pork and soy, and then growing rats were fed these diets at the recommended level of 20% pro-tein for 14 days. The composition of gut bacteria and short-chain fatty acids (SCFAs) in feces were analyzed to compare differences as a response to dietary protein intake.
Materials and Methods
Animals and diets
Fifty-five male 4-week-old Sprague-Dawley rats were obtained from a commercial
experimen-tal animal center (Zhejiang, China, SCXK9<Zhejiang>2008–00) and reared in a specific
path-ogen-free facility (SYXK<Jiangsu>2011–0037). The protocol was approved by the Ethical
Committee of Experimental Animals of Nanjing Agricultural University. Animals were
han-dled as we previously described [22]. After 7 days acclimatization, animals were divided into
five diet groups, fed pork protein, beef protein, fish protein, soy protein or casein (n = 11 each
group). The animals were individually housed in plastic cages and given water and foodad
libi-tumfor 14 days.
The formulation of animal diets referred to the AIN-93 standard for growing rats [23] and
diets were prepared as we previously described [22]. Briefly, dietary proteins were extracted
from beeflongissimus dorsimuscle, porklongissimus dorsimuscle and fish muscle. Scales,
fats in meat were removed by extracting for three time in 3 volumes of methylene chloride/ methanol mixture (V/V = 2:1). Isoflavones in soy protein were removed by 80% methanol (W/ V = 1kg: 6.25L). The protein percents were 87%, 89.25%, 92.48%, 94.18% and 93.42% in casein, soy, fish, pork and beef proteins, and the other nutrients included water, and small amounts of
minerals, fat and fibers. More details of the composition of protein powders can be seen inS1
Table. Meanwhile, we detected the composition of amino acids (S1 Fig) and minerals (S2 Table) in different dietary proteins. The AIN-93G mineral mixture (S3 Table) of diet is based on the results of mineral composition of dietary proteins. The diet composition can be seen in
Table 1.
Sample collection
Fresh feces were collected after rats were fed for 14 days. Normally, the animals excrete feces when they are hung by their tails. The fecal samples were immediately frozen in liquid nitrogen
and then stored at−80°C until further analyses.
Bacterial community analysis
Total microbial DNA was extracted from fecal samples using a commercial stool DNA
extrac-tion kit (Qiagen, Germany, No. 51504) as the manufacturer’s protocol. All DNA samples were
kept at−20°C until sequencing. The V4-V5 hypervariable region of the 16S ribosomal RNA
gene was selected for amplification from DNA samples. The universal primers used were F515 (50-GTGCCAGCMGCCGCGG-30) and R907 (50-CCGTCAATTCMTTTRAGTTT-30) which also
car-ried an eight-base unique sequence (a so called barcode) for each sample [24]. PCR reactions
were run and amplicons sequenced as described previously [22].
SCFA determination
SCFAs, including acetic, propionic, butyric, isobutyric, isovaleric and valeric acids were
detected by gas chromatography (GC) according to a previous protocol [25]. Briefly, 200 mg of
a fecal sample were suspended and homogenized in 1 mL ddH2O, and then centrifuged (4°C,
13,000 ×g) for 10 min. Five hundred microliters of the supernatants were mixed with 100μL
of solution in which 0.65 g of crotonic acid was dissolved in 100 mL 25% metaphosphoric acid; crotonic acid was used as an internal standard. The samples were analyzed on a GC system (Thermo Fisher Scientific, USA) and SCFAs were detected with a flame ionization detector
under the following conditions: injection volume, 1μL; oven temperature, 130°C; inlet and
out-let temperatures, 180°C; runtime 10 min.
Bioinformatics and Statistical analysis
Bioinformatics analysis referred to our previous study [22]. Raw fastq files were demultiplexed,
quality-filtered using QIIME (version 1.17): (1) the 250 bp reads were truncated at any site
receiving an average quality score<20 over a 10 bp sliding window. (2) the truncated reads
shorter than 50bp were removed. (3) exact barcode matching was defined that not more than 2 bp mismatching with primer. (4) reads containing ambiguous characters were removed. (5) the sequences that overlap longer than 10 bp were assembled according to their overlap sequence. (6) Reads which could not be assembled were discarded. Operational Taxonomic Units
(OTUs) were clustered with 97% similarity cutoff using UPARSE (version 7.1http://drive5.
com/uparse/) and chimeric sequences were identified and removed using UCHIME. The
phy-logenetic affiliation of each 16S rRNA gene sequence was analyzed by RDP Classifier (http://
of 70%. Rarefaction analysis and alpha diversities were performed using Mothur. Community diversity was evaluated by Shannon index and Simpson index. Community richness was evalu-ated by Chao and ACE. The heatmap and clustering analysis was preformed by R package (R 3.0.2).
One-way analysis of variance was performed to evaluate the differences in SCFAs and the
relative abundance of fecal bacteria among the five diet-groups. Duncan’s multiple comparison
was applied to compare averages between any two groups. Differences were considered
signifi-cant if p values were<0.05. All analyses were performed using SAS software (version 9.2).
Results
Richness and diversity analyses
We obtained 1,469,231 usable raw reads from 49 fecal samples (S2a Fig), corresponding to 793
OTUs with an average of 371 ± 60 per biological sample at a similarity level of 97% (S2b Fig).
Six fecal samples could not be obtained during the course of feeding, including three from the beef protein-fed group, two from the pork protein group and one from the fish protein group. The pork protein group had a greater number of usable raw reads than the soy protein group
(p<0.05), but there was no significant difference in the number of OTUs between any two
diet groups. Rarefaction analysis (S2c Fig), Shannon-Wiener diversity (S2d Fig) and Good’s
coverage index (99.74% ± 0.07%) indicated that the sequencing methodology was appropriate
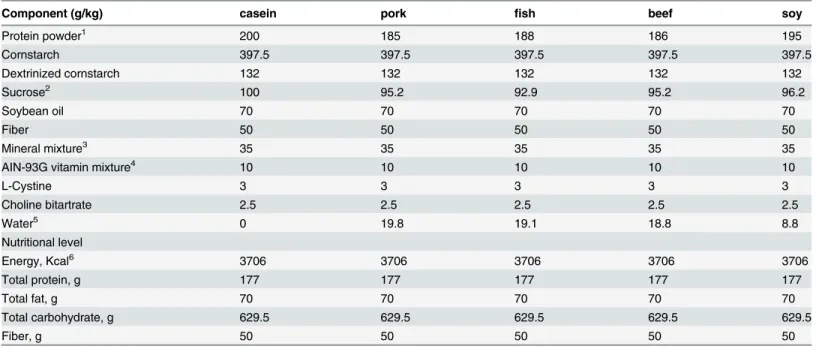
Table 1. The composition of five formulated diets.
Component (g/kg) casein pork fish beef soy
Protein powder1 200 185 188 186 195
Cornstarch 397.5 397.5 397.5 397.5 397.5
Dextrinized cornstarch 132 132 132 132 132
Sucrose2 100 95.2 92.9 95.2 96.2
Soybean oil 70 70 70 70 70
Fiber 50 50 50 50 50
Mineral mixture3 35 35 35 35 35
AIN-93G vitamin mixture4 10 10 10 10 10
L-Cystine 3 3 3 3 3
Choline bitartrate 2.5 2.5 2.5 2.5 2.5
Water5 0 19.8 19.1 18.8 8.8
Nutritional level
Energy, Kcal6 3706 3706 3706 3706 3706
Total protein, g 177 177 177 177 177
Total fat, g 70 70 70 70 70
Total carbohydrate, g 629.5 629.5 629.5 629.5 629.5
Fiber, g 50 50 50 50 50
1Protein powders contain certain quantities of moisture, minerals and fats/lipids (seen inS1 Table). 174g protein was from protein powder, the actual
protein content was 177 g/kg (protein powder and L-cystine) for all the diets.
2Sucrose was applied for the preparation of mineral mixtures. And thus sucrose was balanced to a
final content 100g/kg.
3The minerals were balanced by mixing different compounds although protein powders contained different amounts of them. Mineral mixtures were list in
S3 Table.
4The formulation of vitamin mixtures as described by Reeves et. al [22]. 5Water was added to balanced other nutrients.
6
The energy of diets was calculated based on the contents of protein, fats and sugars.
to evaluate the microbial diversity in the present study. Diet did not affect ACE, Chao,
Shan-non, Simpson, and Good’s coverage indices for gut bacteria (S4 Table).
Composition of gut bacteria in feces
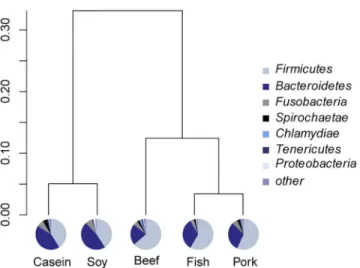
At the phylum level, Firmicutes and Bacteroidetes were predominant in all samples. Rats fed with proteins from beef, pork and fish had a higher average relative abundance of Firmicutes
(p<0.05,Fig 1), but rats fed with casein and soy protein had a higher abundance of
Bacteroi-detes (p<0.01). The relative abundance of Spirochaetae was the highest in the casein group
(p<0.05). Clustering analysis indicated that gut microbiota from the beef, pork and fish
groups could be classified into one category and those from the casein and soy protein groups
could be considered another category (Fig 1).
At the family level, the composition of gut bacteria varied greatly with diet (p<0.05,Fig
2a). The casein group had the lowest relative abundance of Lactobacillaceae (p<0.05) but the
highest of Lachnospiraceae (p<0.05), and the soy protein group had the lowest abundance of
Prevotellaceae (p<0.05). However, these two groups showed higher abundances of
Bacteroi-daceae than the beef, pork and fish protein groups (p<0.05).
At the genus level, rats fed with pork and beef proteins had higher relative abundances of Allobaculumbut lowerLachnospiraceaeuncultured andLachnospiraceaeincertae sedis than
the casein group (p<0.05;Fig 2b).Blautiawas more abundant in the soy, beef and fish
pro-tein-fed groups compared to the casein group (p<0.05). Casein and soy protein groups had
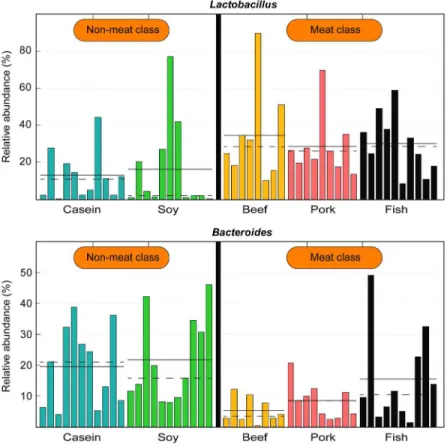
higher relative abundances ofBacteroidesbut lowerLactobacillusthan the other three groups
(p<0.05). No significant difference existed in the relative abundances ofBacteroidesand
Lac-tobacillusbetween the casein and soy protein groups. If the five diet groups were classified into "meat" (including beef, pork and fish protein groups) and "non-meat" (including casein and
soy protein groups), the meat category showed a higher relative abundance ofLactobacillusbut
a lower relative abundance ofBacteroidesthan the non-meat category (p<0.05;Fig 3).
The above observations indicated that gut bacteria in feces differed depending on the dietary proteins. To characterize specific bacteria related to diet, linear discriminant analysis effect size
(LefSe) analyses were performed on those OTUs with relative abundances>0.1% in any given
group. The overall profiles of gut bacteria differed significantly between the casein group and
all the other groups (p<0.05;Fig 4andS5 Table). Ninety-nine OTUs were significantly
differ-ent between the casein group and other groups (at least one group). Ninety-three of these OTUs belong to the phyla Firmicutes and Bacteroidetes. The beef and soy protein-fed groups
had a much lower abundance of OTU476 (genusBacteroides) than the casein group (averages
11.08%, 0.89% and 1.28% for casein, beef and soy protein groups, respectively; p<0.001), but
no significant difference was observed among the casein, pork and fish protein groups.
OTU628 (genusLactobacillus) was higher in three meat protein groups than in the casein and
soy groups (averages 6.11%, 3.42%, 8.60%, 1.05% and 1.06% for beef, pork, fish, casein and soy
protein groups, respectively; p<0.01). OTU620 (genusLactobacillus) was more abundant in
the fish and pork protein groups than in the casein group (averages 17.23%, 21.25% and 4.94%
for fish, pork and casein groups, respectively; p<0.01).
SCFA profiling
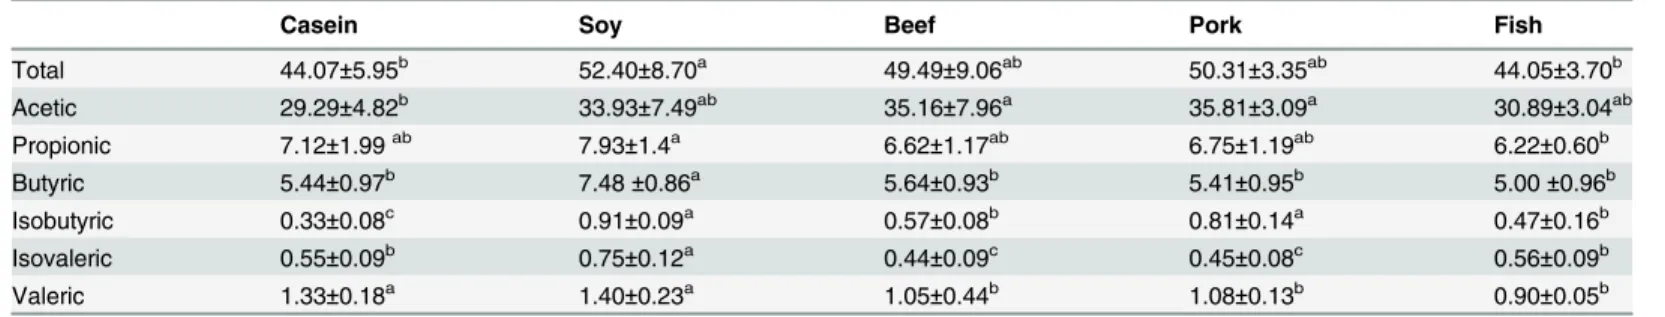
In general, total fatty acids showed significant differences among the five diet groups (p<0.05;
Table 1). Acetic acid accounted for 64.75% to 71.18% of the total fatty acids varying with diet,
ranging from 29.29 to 35.81μmol/g feces. Propionic and butyric acids also had relatively high
concentrations, ranging from 6.22 to 7.93μmol/g feces and from 5.00 to 7.48μmol/g feces,
composition in rat feces. The soy protein-fed group had the highest levels of total SCFAs and
of individual SCFAs except acetic acid (p<0.05;Table 2). The casein group had the lowest
lev-els of total SCFAs, acetic acid and isobutyric acid. Of the three meat protein-fed groups, the
fish group had the highest level (p<0.05) of isovaleric acid, while the pork protein group had
the highest level of isobutyric acid.
Growth performance and food intake
There was no significant difference in body weight between any two groups on day 0 (Table 3).
After 14 days feeding, the fish protein group showed the highest body weight and body weight
gain; the lowest values were found for the soy protein group (p<0.05). Meanwhile, the soy
protein group had the lowest food intake in five groups numerically, although there was no
sig-nificant difference between any two groups (p>0.05).
Discussion
The gut has been considered a moving bioreactor that provides undigested food compounds
and endogenous compounds for maintaining a highly diverse chemostat culture [9,10,26]. It
is not surprising that the composition of gut bacteria may be shaped by diet. For example, a
high-fat diet decreases the relative abundance ofBacteroidesandBifidobacteriumin feces [27].
However, it was difficult to draw any conclusion whether the diet-induced difference should be attributed to long-term or short-term effects. We showed previously that long-term intake of different meat proteins at the recommended level led to different composition of gut bacteria
in the rat caecum [22]. The present study provided further evidence that it was protein source
but not feeding time that affected the composition gut bacteria. Fourteen days might be enough for gut microbiota to reach a stable state after a change in diet.
SCFAs are the end products of carbohydrates and proteins fermentation in the large intes-tine. Butyrate is mainly utilized by enterocytes. The majority of acetate and propionate are uti-lized by other tissues. Different gut bacteria have different preferences for substrate and produce different SCFAs. The composition of SCFAs varies with dietary carbohydrates, dietary proteins and endogenous proteins. There were substantial undigested fibers, glycans and
Fig 1. Relative abundance of gut bacteria at the phylum level.Pie charts show the composition of gut
bacteria at the phylum level. Bray-Curtis similarity cluster analysis shows that the composition of gut bacteria in feces from the beef, pork and fish protein-fed groups could be separated from those of the casein and soy protein-fed groups.
Fig 2. Relative abundance of gut bacteria in rat feces at the family and genus levels.a) At the family level. b) At the genus level.
undigested resistant starch can enter into large intestine for the utilization of gut bacteria [28]. Dietary proteins that are not completely digested and absorbed in the small intestine can also
enter into the large intestine and are used by gut bacteria [8,9]. According to the manufacturer
(Linyi Ltd. Co.), there was less than 0.5% crude fiber in soy protein powder, which accounted for 0.00975 g/kg in diet. Normally, daily diet intake of rats in the present study is about 17.5 g, and the amount of fiber from soy protein is less than 0.00975 g. And thus we think that such a small amount of fiber may hardly affect the composition of gut bacteria as compared to other kinds of components in diets. The differences in the levels of SCFAs among dietary groups could mainly be ascribed to dietary proteins and the composition of gut bacteria. There are at least 81 different glycoside hydrolase families in gut bacteria involved in starch and sucrose
metabolism, which lacked in the host [29]. For example,Bacteroidescan use a series of
multi-enzyme systems, named the Sus-like systems, to produce SCFAs [30]. Rat feces from the soy
protein group had the highest level of total SCFAs. This result indicates that meat proteins intake could reduce the fermentation of non-digested fibers in rat. The composition of amino acids in different dietary proteins may also affect SCFA profiling. In gut bacteria, acetic acid can be produced from glycine, alanine, threonine, glutamate, lysine and aspartate, while butyric acid may be produced from glutamate and lysine, propionic acid from alanine and threonine,
and isobutyric and isovaleric acid from valine and leucine [31]. The composition of amino
acids in five dietary proteins was significantly different (S2 Fig). These differences maybe
Fig 3. Relative abundance ofBacteroidesandLactobacillusin different diet groups.The mean and
median relative abundances are indicated with solid and dashed lines respectively. Each column represents one biological sample and there are 49 biological samples in total, including 11 from the casein group, 11 from the soy protein group, 8 from the beef protein group, 9 from the pork protein group and 10 from the fish protein group. The samples were classified into "non-meat" (casein and soy protein) and "meat" (beef, pork and fish proteins).
Fig 4. Differences in bacterial communities at the OTU level.The figure includes three parts: 1) The right panel shows the relative abundance (log 10 transformation) of OTUs. Each column represents one biological sample and each row represents one OTU; 2) the middle panel shows the fold-changes of OTUs that changed significantly (p<0.05) compared to the casein group. Red denotes an increase, blue denotes a decrease. S, soy protein group; B, beef
protein group; P, pork protein group; F, fish protein group; 3) the left panel lists significantly changed OTUs and the corresponding phyla, families and genera.
course cause different levels of SCFAs. Soy protein contains relatively low levels of threonine, valine, leucine and lysine, but samples from the rats fed with soy protein showed higher levels of propionic, butyric, isobutyric and isovaleric acids than the other diet groups. This could be explained by two factors: (1) the bioavailability of soy protein in the small intestine may be lower than that of casein and meat proteins, resulting in the passage of more undigested
pro-teins and peptides into the large intestine [32]. In addition, soy protein was shown to be able to
stimulate epithelial cells in the small intestine to excrete more endogenous proteins [33]. These
undigested and endogenous proteins can enter the large intestine for microbial fermentation and thus more SCFAs may be produced. (2) The higher level of SCFAs in the soy protein
group may also be associated with the higher relative abundance ofBacteroidesandPrevotella
in this group (S6 Table).BacteroidesandPrevotellahave the capability to use a wide range of
substrates and are the major propionate and other SCFAs producers [34].
Compared with casein and soy protein diets, the intake of meat proteins was shown to
increase the abundance of the genusLactobacillus. Members of this genus have been proposed
to be key players in host metabolic homeostasis because they can protect the gut barrier against
disruption by pathogens and can reduce inflammation [35–38]. The high abundance of
Lacto-bacillusin meat protein groups may be beneficial for the host.
Previous studies have shown that excessive intake of red meat may be associated with a high
risk of mortality from colorectal cancer [5,8], The underlying mechanisms may be as follows
[3,39–41]: (1) nitroso-compounds formed by gut bacteria in the gastrointestinal tract by
N-nitrosation of peptide-derived amines or nitrosylation reactions are toxic. (2) Heterocyclic amines formed during high-temperature roasting have cytotoxicity in the gut. (3) The high level of heme iron in red and processed meats can increase the redox level and induce
inflam-mation. (4) An unbalanced composition of gut bacteria characterized by highFusobacterium
Table 2. Effect of the type of dietary protein on SCFA levels (μmol/g, means±standard deviations).
Casein Soy Beef Pork Fish
Total 44.07±5.95b 52.40±8.70a 49.49±9.06ab 50.31±3.35ab 44.05±3.70b
Acetic 29.29±4.82b 33.93±7.49ab 35.16±7.96a 35.81±3.09a 30.89±3.04ab
Propionic 7.12±1.99ab 7.93±1.4a 6.62±1.17ab 6.75±1.19ab 6.22±0.60b
Butyric 5.44±0.97b 7.48±0.86a 5.64±0.93b 5.41±0.95b 5.00±0.96b
Isobutyric 0.33±0.08c 0.91±0.09a 0.57±0.08b 0.81±0.14a 0.47±0.16b
Isovaleric 0.55±0.09b 0.75±0.12a 0.44±0.09c 0.45±0.08c 0.56±0.09b
Valeric 1.33±0.18a 1.40±0.23a 1.05±0.44b 1.08±0.13b 0.90±0.05b
The data were analyzed by one-way analysis of variance and means were compared by Duncan’s multiple comparison. a,b,cMeans with different superscripts differed signi
ficantly (p<0.05).
doi:10.1371/journal.pone.0152678.t002
Table 3. Effect of the type of dietary protein on growth performance and food intake of rats.
Group Casein Soy Beef Pork Fish
Body weight (0d, g) 167±15a 168±12a 169±15a 168±15a 171±12a
Body weight (14d, g) 329±22ab 298±20c 318±29bc 320±22b 343±24a
Body weight gain (g) 162±13ab 130±13c 149±17b 152±22b 172±23a
Food intake (g/day) 20.5±1.2a 17.5±0.8a 20±1.3a 20.1±1.4a 20±1.2a
The data were analyzed by one-way analysis of variance and means were compared by Duncan’s multiple comparison. a,b,cMeans with different superscripts differed signi
ficantly (p<0.05).
andBacteroidesbut lowLactobacillus. In the present study, N-nitroso-compounds and hetero-cyclic amines may not be formed because nitrate or nitrite were not added to the diet formula-tions and meat samples were cooked at low temperatures. Although heme was shown to affect the composition of gut bacteria, the changes in microbiota did not play a causal role in the
observed hyperproliferation and hyperplasia [42]. In the present study, the difference in gut
bacteria should be attributed to protein source. Although the iron level in diet was balanced, plant material and animal tissues contain different forms of iron with different bioavailability, which may have a certain influence on the gut bacteria. No significant difference was observed
in the relative abundance ofFusobacteriumamong the five diet groups. However, the meat
pro-tein groups showed higher levels ofLactobacillusbut lowerBacteroidesthan the non-meat
groups. Therefore, cooking method, dose and feeding period may be the critical factors that should be considered when we evaluate associations between the intake of meat proteins, meta-bolic disorders and other kinds of cytotoxicity.
In summary, in this short-term study, we fed rats with five different protein types, from casein, soy, beef, pork and fish. The type of dietary proteins had a substantial influence on the composition of gut bacteria and SCFAs in rat feces. The five diet groups could be clustered into two subgroups at the level of the phyla of the observed gut bacteria, "meat class" and "non-meat class". This was in accordance with our long-term results. Meanwhile, the relative abundance
of the genusLactobacilluswas higher in rats fed protein from the meat class than the non-meat
class. Specific bacteria sensitive to dietary proteins might play a critical role in the maintenance of a healthy body. Our findings suggest that the intake of meat proteins at a recommended
level may increaseLactobacilluscompared to casein and soy protein diets and thus may benefit
gut health. However, rats fed soy protein had the highest level of SCFAs, accompanied by more SCFA-producing bacteria. The underlying mechanism of the regulation of gut microbiota by dietary protein requires further study.
Supporting Information
S1 Fig. The composition of amino acids in different dietary proteins.
(TIF)
S2 Fig. Diversity estimation of fecal microbial community.a) The average number of usable raw reads (mean and standard deviation); b) The average number of OTU (mean and standard
deviation); c) Rarefaction curves. Each curve represents one rat; d) Shannon—Wiener diversity
index curves. Each curve represents one rat; Note: there are totally 49 biological samples, of which 11 from casein group (light blue color), 11 from soy protein group (green color), 8 from beef protein group (yellow color), 9 from pork protein group (pink color) and 10 from fish pro-tein group (black color).
(TIF)
S1 Table. The composition of five dietary protein powder (g/100g).
(DOC)
S2 Table. Minerals content of the protein powder.
(DOC)
S3 Table. Composition levels of mineral premix.
(DOC)
S4 Table. Richness and diversity indexes relative to each sample (OTUs at 97% similarity).
S5 Table. The differentially fecal bacterial communities between casein group and any other protein group on OTU level using LEfSe.
(DOC)
S6 Table. Correlation of fecal bacteria with SCFAs concentration.
(DOC)
Acknowledgments
We thank Weihua Chen, Mengjie Li, Qiayu Wu, Siying Wen, Li Li, Hedong Lu, Huixing Lin from the Nanjing Agricultural University for their help during animal feeding and sampling. We thank Elixigen Corporation (Huntington Beach, California, USA) for helping in proofread-ing and editproofread-ing the English of final manuscript.
Sequence information: all sequence data have been deposited in the NCBI Sequence Read Archive under accession code SRP059401.
Author Contributions
Conceived and designed the experiments: YZ CL GZ. Performed the experiments: YZ XL HL YL XS. Analyzed the data: YZ. Contributed reagents/materials/analysis tools: YZ FZ. Wrote the paper: YZ. Gave critical revision of this manuscript: XX.
References
1. Pereira P, Vicente A. Meat nutritional composition and nutritive role in the human diet. Meat Sci. 2013; 93: 586–92. doi:10.1016/j.meatsci.2012.09.018PMID:23273468
2. Tilman D, Clark M. Global diets link environmental sustainability and human health. Nature. 2014; 515 (7528): 518–22. doi:10.1038/nature13959PMID:25383533
3. Bastide N, Chenni F, Audebert M, Santarelli R, Tache S, Naud N, et al. A central role for heme iron in colon carcinogenesis associated with red meat intake. Cancer Res. 2015; 75(5): 870–879 doi:10. 1158/0008-5472.CAN-14-2554PMID:25592152
4. Corpet DE. Red meat and colon cancer: Should we become vegetarians, or can we make meat safer? Meat Sci. 2011; 89(3): 310–316. doi:10.1016/j.meatsci.2011.04.009PMID:21558046
5. Pham NM, Mizoue T, Tanaka K, Tsuji I, Tamakoshi A, Matsuo K, et al. Meat consumption and colorectal cancer risk: an evaluation based on a systematic review of epidemiologic evidence among the Japa-nese population. Jap J Clin Oncol. 2014; 44(7): 641–650.
6. Ollberding NJ, Wilkens LR, Henderson BE, Kolonel LN, Le Marchand L. Meat consumption, heterocy-clic amines and colorectal cancer risk: the Multiethnic Cohort Study. Int J Cancer. 2012; 131(7): E1125–E1133. doi:10.1002/ijc.27546PMID:22438055
7. Pan A, Sun Q, Bernstein AM, Schulze MB, Manson JE, Stampfer MJ, et al. Red meat consumption and mortality: results from 2 prospective cohort studies. Arch. Intern. Med. 2012; 172(7):555–63. doi:10. 1001/archinternmed.2011.2287PMID:22412075
8. van Hylckama Vlieg JE, Veiga P, Zhang C, Derrien M, Zhao L. Impact of microbial transformation of food on health-from fermented foods to fermentation in the gastro-intestinal tract. Curr. Opin. Biotech. 2011; 22(2): 211–219.
9. Rist V, Weiss E, Eklund M, Mosenthin R. Impact of dietary protein on microbiota composition and activ-ity in the gastrointestinal tract of piglets in relation to gut health: a review. Animal. 2013; 7(07): 1067–
1078.
10. Backhed F, Ley RE, Sonnenburg JL, Peterson DA, Gordon JI. Host-bacterial mutualism in the human intestine. Science. 2005; 307(5717): 1915–1920. PMID:15790844
11. Clemente JC, Ursell LK, Parfrey LW, Knight R. The impact of the gut microbiota on human health: an integrative view. Cell. 2012; 148(6): 1258–1270. doi:10.1016/j.cell.2012.01.035PMID:22424233
12. Ramakrishna BS. Role of the gut microbiota in human nutrition and metabolism. J. Gastroen. Hepatol. 2013; 28(S4):9–17.
14. O Ann M., S Fergus. The gut flora as a forgotten organ. EMBO Rep. 2006; 7(7): 688–693. PMID: 16819463
15. Geypens B, Claus D, Evenepoel P, Hiele M, Maes B, Peeters M, et al. Influence of dietary protein sup-plements on the formation of bacterial metabolites in the colon. Gut. 1997; 41(1):70–6. PMID:9274475
16. Qi HW, Xiang ZT, Han GQ, Yu B, Huang ZQ, Chen DW. Effects of different dietary protein sources on cecal microflora in rats. Afr J Biotechnol. 2011; 10(19): 3704–3708.
17. Day L. Proteins from land plants—potential resources for human nutrition and food security. Trends Food Sci Tech. 2013; 32(1): 25–42.
18. Rist VT, Weiss E, Sauer N, Mosenthin R, Eklund M. Effect of dietary protein supply originating from soy-bean meal or casein on the intestinal microbiota of piglets. Anaerobe. 2014; 25: 72–79. doi:10.1016/j. anaerobe.2013.10.003PMID:24176945
19. Toden S, Bird AR, Topping DL, Conlon MA. Resistant starch prevents colonic DNA damage induced by high dietary cooked red meat or casein in rats. Cancer Biol Ther. 2014; 5(3): 267–272.
20. Toden S, Bird AR, Topping DL, Conlon MA. High red meat diets induce greater numbers of colonic DNA double-strand breaks than white meat in rats: attenuation by high-amylose maize starch. Carcino-genesis. 2007; 28(11): 2355–2362. PMID:17916911
21. Shen Q, Chen YA, Tuohy KM. A comparative<i>in vitro investigation into the effects of cooked meats on the human faecal microbiota. Anaerobe. 2010; 16(6): 572–577. doi:10.1016/j.anaerobe.2010.09. 007PMID:20934523
22. Zhu YY, Lin XS, Zhao F, Shi XB, Li H, Li YQ, et al. Meat, dairy and plant proteins alter bacterial compo-sition of rat gut bacteria. Sci Rep. 2015; 5:15220. doi:10.1038/srep15220PMID:26463271
23. Reeves PG, Nielsen FH, Fahey GC Jr. AIN-93 purified diets for laboratory rodents: final report of the American Institute of Nutrition ad hoc writing committee on the reformulation of the AIN-76A rodent diet. J Nutr. 1993; 123(11): 1939–1951. PMID:8229312
24. Noha Y, Cody S. S, Lee R. K, Fares Z. N, Bruce A. R, Mostafa S. E. Comparison of Species Richness Estimates Obtained Using Nearly Complete Fragments and Simulated Pyrosequencing-Generated Fragments in 16S rRNA Gene-Based Environmental Surveys. Appl Environ Microb. 2009; 75(16): 5277–5236.
25. Zhao G, Nyman M, Jonsson JA. Rapid determination of short-chain fatty acids in colonic contents and faeces of humans and rats by acidified water-extraction and direct-injection gas chromatography. Biomed Chromatogr. 2006; 20(8): 674–682. PMID:16206138
26. Sonnenburg JL, Angenent LT, Gordon JI. Getting a grip on things: how do communities of bacterial symbionts become established in our intestine? Nature Immunol. 2004; 5(6): 569–573.
27. Zhang C, Zhang M, Pang X, Zhao Y, Wang L, Zhao L. Structural resilience of the gut microbiota in adult mice under high-fat dietary perturbations. ISME J. 2012; 6(10): 1848–1857. doi:10.1038/ismej.2012.27 PMID:22495068
28. Birt D. F, Boylston T, Hendrich S, Jane J. L, Hollis J, Li L, et al. Resistant starch: promise for improving human health. Adv Nutr. 2013; 4(6): 587–601. doi:10.3945/an.113.004325PMID:24228189
29. Gill SR, Pop M, DeBoy RT, Eckburg PB, Turnbaugh PJ, Samuel BS, et al. Metagenomic analysis of the human distal gut microbiome. Science. 2006; 312(5778): 1355–1359. PMID:16741115
30. Martens EC, Koropatkin NM, Smith TJ, Gordon JI. Complex glycan catabolism by the human gut micro-biota: the Bacteroidetes Sus-like paradigm. J Biol Chem. 2009; 284(37): 24673–24677. doi:10.1074/ jbc.R109.022848PMID:19553672
31. Davila A-M, Blachier F, Gotteland M, Andriamihaja M, Benetti P-H, Sanz Y, et al. Intestinal luminal nitro-gen metabolism: role of the gut microbiota and consequences for the host. Pharmacol Res. 2013; 68 (1): 95–107. doi:10.1016/j.phrs.2012.11.005PMID:23183532
32. Gilbert JA, Bendsen NT, Tremblay A, Astrup A. Effect of proteins from different sources on body com-position. Nutr Metab Cardiovasc Dis. 2011; 21 Suppl 2: B16–31. doi:10.1016/j.numecd.2010.12.008 PMID:21565478
33. Corring T, Chayvialle J, Gueugneau A-M, Bernard C, BRACHET G, Cointepas F. Diet composition and the plasma levels of some peptides regulating pancreatic secretion in the pig. Reprod Nutr Dévelop. 1987; 27(6):967–77.
34. Reichardt N, Duncan SH, Young P, Belenguer A, Leitch CM, Scott KP, et al. Phylogenetic distribution of three pathways for propionate production within the human gut microbiota. ISME J. 2014; 8(6): 1323–1335. doi:10.1038/ismej.2014.14PMID:24553467
36. Marco ML, de Vries MC, Wels M, Molenaar D, Mangell P, Ahrne S, et al. Convergence in probiotic Lac-tobacillus gut-adaptive responses in humans and mice. ISME J. 2010; 4(11): 1481–1484. doi:10.1038/ ismej.2010.61PMID:20505752
37. Cani PD, Bibiloni R, Knauf C, Waget A, Neyrinck AM, Delzenne NM, et al. Changes in gut microbiota control metabolic endotoxemia-induced inflammation in high-fat diet—induced obesity and diabetes in mice. Diabetes. 2008; 57(6): 1470–1481. doi:10.2337/db07-1403PMID:18305141
38. Zhang C, Zhang M, Wang S, Han R, Cao Y, Hua W, et al. Interactions between gut microbiota, host genetics and diet relevant to development of metabolic syndromes in mice. ISME J. 2009; 4(2): 232–
241. doi:10.1038/ismej.2009.112PMID:19865183
39. Zhu Q, Jin Z, Wu W, Gao R, Guo B, Gao Z, et al. Analysis of the intestinal lumen microbiota in an animal model of colorectal cancer. PLOS One. 2014; 9(6): e90849. doi:10.1371/journal.pone.0090849PMID: 24603888
40. Arthur JC, Perez-Chanona E, Mühlbauer M, Tomkovich S, Uronis JM, Fan T-J, et al. Intestinal inflam-mation targets cancer-inducing activity of the microbiota. Science. 2012; 338(6103): 120–123. doi:10. 1126/science.1224820PMID:22903521
41. Grivennikov SI, Wang K, Mucida D, Stewart CA, Schnabl B, Jauch D, et al. Adenoma-linked barrier defects and microbial products drive IL-23/IL-17-mediated tumour growth. Nature. 2012; 491(7423): 254–258. doi:10.1038/nature11465PMID:23034650