ISSN 1546-9239
© 2010Science Publications
Corresponding Author: Murni M. Ahmad, Department of Chemical Engineering, University Technology PETRONAS, 31750 Perak, Malaysia
Upgrading of Bio-Oil into High-Value Hydrocarbons via Hydrodeoxygenation
Murni M. Ahmad, M. Fitrir R. Nordin and M. Tazli Azizan
Department of Chemical Engineering, University Technology PETRONAS,
31750 Perak, Malaysia
Abstract: Problem statement: World energy consumption is forecasted to grow significantly for the foreseeable future with fossil fuel remains the governing energy source. The demand in the need to explore alternative fuel source was further triggered by the overwhelmingly inconsistent cost of gasoline. Bio-oil is an alternative energy source produced from pyrolysis of biomass. However it is undesirable as a ready alternative transportation fuel due to its unfavorable nature i.e., highly oxygenated and low octane number. To overcome these physicochemical issues, hydrodeoxygenation reaction is a possible upgrading method i.e., by partial or total elimination of oxygen and hydrogenation of chemical structures. Hence, this study aimed to investigate feasible routes and to develop the process route to upgrade the pyrolytic bio-oil from biomass into value-added chemicals for the production of transportation fuel, i.e., benzene and cyclohexane, via hydrodeoxygenation process via simulation in PETRONAS iCON software. Approach: In this study, hydrodeoxygenation of phenols and substituted phenols was used to represent the hydrodeoxygenation of the major oxygen compound in bio-oil due to their low reactivity in HDO. Results: By assuming the feedstock used was 1% of the total palm shell available in Malaysia, i.e., 2,587 kg h−1 bio-oil, the simulation predicted the production of 226 kg h−1 benzene, 236 kg h−1 cyclohexane and 7 kg h−1 cyclohexene, with the yield of 34, 81 and 3% respectively. The preliminary economic potential was calculated to be positive. It was also observed that hydrogen was the limiting reactant in the hydrogenation reaction. Conclusion/Recommendations: The simulation study indicated positive technical and economic feasibility of hydrodeoxygenation of pyrolytic bio-oil from biomass into benzene and cyclohexane for the transportation fuel industry. This potential can be explored in more details and further findings can promote the prospect of co-processing bio-oil in standard refinery units to produce chemicals and fuels.
Key words: Bio-oil, simulation, hydrodeoxygenation, flowsheet design, biomass
INTRODUCTION
World energy consumption is predicted to grow significantly and continuously close with the global population. Contributing approximately 79% (US Energy Information Administration, 2009) of the worldwide energy demand, fossil fuel is expected to remain the governing energy fuel as it has been for decades. However, the supply for this high demand may be retarded by the decreasing reserve of fossil oil. The dramatic fluctuations of fossil oil price furthermore raise the question of fossil oil dependability as the primary energy fuel. Despite the increasing energy needs, the utilization of fossil oil as an energy source is also becoming increasingly controversial from an environmental standpoint (US Energy Information Administration, 2009). A growing concern on the
harmful environmental effects from burning fossil fuels was best portrayed via today’s catastrophic greenhouse effects.
Hence, renewable energy are essential contributors to the energy portfolio as they contribute to world supply security, renovate the energy sources structure, reduce the dependency on fossil oil resources and provide opportunities to mitigate greenhouse gases. In response towards the energy crisis, an extensive study on the production of transportation fuels from an alternative renewable source i.e., bio-oil obtained via pyrolysis of biomass.
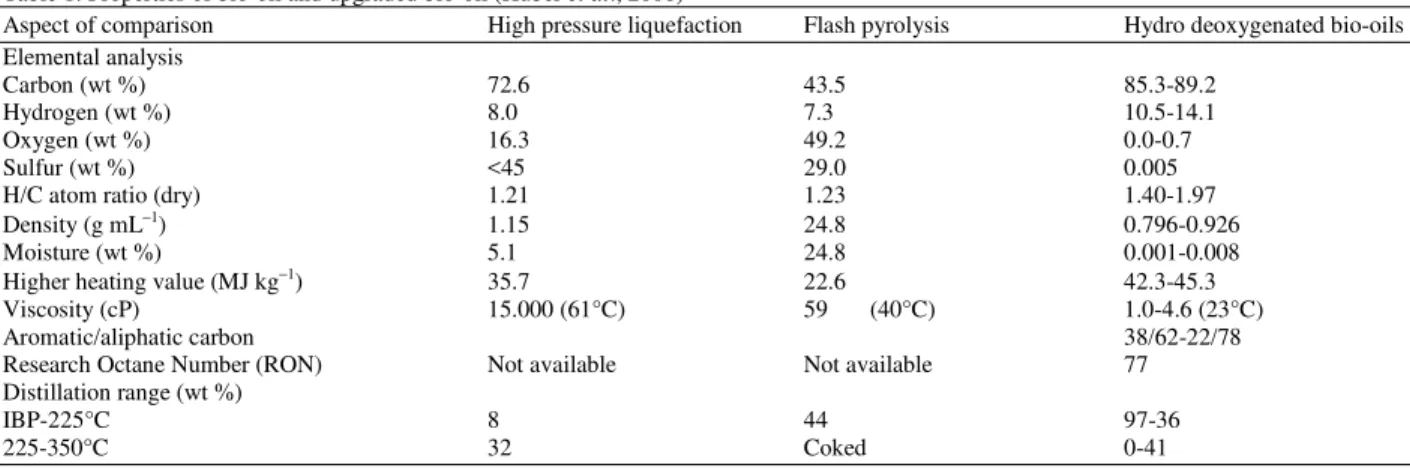
Table 1: Properties of bio-oil and upgraded bio-oil (Huber et al., 2006)
Aspect of comparison High pressure liquefaction Flash pyrolysis Hydro deoxygenated bio-oils
Elemental analysis
Carbon (wt %) 72.6 43.5 85.3-89.2
Hydrogen (wt %) 8.0 7.3 10.5-14.1
Oxygen (wt %) 16.3 49.2 0.0-0.7
Sulfur (wt %) <45 29.0 0.005
H/C atom ratio (dry) 1.21 1.23 1.40-1.97
Density (g mL−1) 1.15 24.8 0.796-0.926
Moisture (wt %) 5.1 24.8 0.001-0.008
Higher heating value (MJ kg−1) 35.7 22.6 42.3-45.3
Viscosity (cP) 15.000 (61°C) 59 (40°C) 1.0-4.6 (23°C)
Aromatic/aliphatic carbon 38/62-22/78
Research Octane Number (RON) Not available Not available 77
Distillation range (wt %)
IBP-225°C 8 44 97-36
225-350°C 32 Coked 0-41
and gasoline fuels. Even so, properties such as low heating value, incompatibility with conventional fuels, ash content, high viscosity, incomplete volatility and chemical instability negatively affect the quality of bio-oil as a transportation fuel (Huber et al., 2006). Due to the physicochemical properties of bio-oil, an upgrading process can be used to convert bio-oil into a ready alternative to the petroleum fuel in the transportation industry. An example of the upgrading process is hydrodeoxygenation.
Hydrodeoxygenation (HDO) is one of the examples of the hydrotreatment process in which hydrogen is used to reduce the high oxygen content in bio-oil in the presence of suitable catalysts such as Cobalt-Molybdenum (CoMo) or Nickel-Molybdenum (NiMo) sulphides (Senol, 2007; Mahfud, 2007; Gutierrez et al., 2007). Theoretically for bio-oil, the reaction is performed in two stages, which is characterized by a low temperature treatment in the range of 200-250°C and then a more severe treatment at 350-450°C. Through the reaction, water was produced as one of the major by-products (Gutierrez et al., 2007) and it is expected that the quality of the hydrodeoxygenated bio-oil, in terms of the content of high-value hydrocarbons i.e., cyclohexane and benzene, satisfies the standard of a ready transportation fuel.
Table 1 shows that the oxygen and moisture content in bio-oil are decreased via HDO, resulting in significant increase of heating value. HDO also reduces the viscosity to that required for fuel applications. Furthermore, the formation of saturated C-C bonds and water from the reaction of oxygen and hydrogen increases the stability of the oil and reduces the acidity level of the oil. On the other hand, the octane number was taken into consideration as it measures the maximum compression ratio which can be utilized in an engine without some of the fuel/air mixture self ignited
(Astron International, Inc., 2009). Currently, no significant comparison can be made directly as there is limited data on the octane number for high pressurized liquefaction and flash pyrolysis bio-oil. However, here it is assumed that these properties are enhanced via the decrement in the highly-oxygenated compounds composition and the increment in the benzene and cyclohexane compositions in the bio-oil.
Nevertheless, the scope of investigation on this upgrading route is quite extensive, making the experimental work exhaustive and expensive. Hence, a less expensive yet systematic simulation approach is proposed to investigate the preliminary feasibility of producing high-value hydrocarbons i.e., cyclohexane and benzene, from bio-oil in the search for potential alternative source for transportation fuel industry. The work is implemented in PETRONAS iCON simulation software.
MATERIALS AND METHODS
Chemical reaction analysis: The main process reaction on the model compound with respect to the upgrading process of bio-oil via HDO is described by Mahfud (2007) as:
H2 + -(CH2O)- →-(CH2)- + H2O (1)
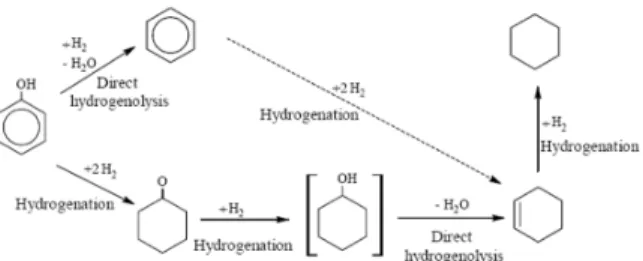
Fig. 1: Reaction scheme for the catalytic hydrotreating of phenol (Senol, 2007)
Table 2: Overall process reactions of model compounds
Model compound Reaction
Guaiacol→Catechol C6H4(OH)(OCH3) + H2→C6H4
(OH)(OH) + CH4 (2)
Catechol→Phenol C6H4(OH)(OH) + H2→C6H5
(OH) + H2O (3)
Phenols→Benzene C6H5(OH) + H2→C6H6 + H2O (4) Phenols→Cyclohexanone C6H5(OH) + H2→C6H10O (5) Cyclohexanone→ C6H10O + H2→C6H11(OH) (6) Cyclohexanol
Cyclohexanol→ C6H11(OH)→C6H10 + H2O (7)
Cyclohexene
Cyclohexene→ C6H10 + H2→C6H12 (8)
Cyclohexane
Based on the reaction scheme in Fig. 1 and reports by Furimsky (2000) and Gutierrez et al. (2007), the overall process reactions of the model compounds can be summarized as listed in Table 2.
Process development: The conditions employed during the upgrading of bio-oil differ depending on its source of origins i.e., either through highly pressurized liquefaction or pyrolysis process. In this study, the bio-oil from the biomass fast pyrolysis is upgraded via HDO which consists of two stages. At the end of the second stage, the oxygen content in the bio-oil is expected to decrease significantly.
Viljava (2001) states that most of the HDO studies reported in the literature have been carried out using model compounds and mixtures of model compounds to represent bio-oil. A recent review by Furimsky (2000) that extensively summarizes the HDO experimental work, highlights that most work on the process to produce transport fuel grade from bio-oil were focused on phenols and furans due to their low reactivity in HDO. Hence, in this study, phenols and substituted phenols, which are the major oxygen compound found in bio-oil, are considered to represent the bio-oil in the simulation.
Based on the recommendations proposed by Furimsky (2000) and supported by Gutierrez et al. (2007), Guaiacol (GUA) and substituted GUAs are selected as the initial model compounds to represent bio-oil in the simulation. This is acceptable due to the
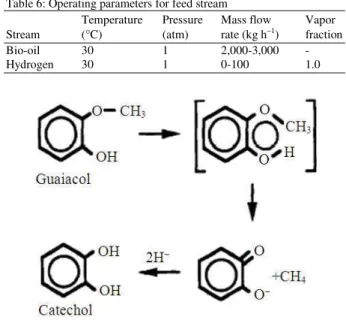
Fig. 2: Mechanism of HDO of GUA (Astron International, Inc., 2009)
Fig. 3: Overall process flow block diagram for upgrading process of bio-oil via HDO
relatively high concentrations and low stability of these compounds in bio-oil. The study by (Astron International, Inc., 2009; Furimsky, 2000) states that most of the results on the HDO of bio-oil focus on the GUA disappearance, meanwhile phenols are accounted for most of the disappearance of GUA. Figure 2 below illustrates the mechanism of HDO of GUA.
As the reactions proceed as proposed in Table 2, the simulated conversion of the reactant along with the yield and selectivity of the products provides valuable information in determining the amount of product formed and reactant consumed throughout the reaction.
Nevertheless, Furimsky (2000) notes that for the upgrading of bio-oil from pyrolysis, an additional hydrogenation stage may be needed because of a high aromatics content of products after a two-stage upgrading. The main objective of the second upgrading stage conducted under typical hydroprocessing conditions is to have a complete HDO. Furimsky (2000) reports that the feed treatment prior to upgrading is usually neglected although it may slow down catalyst deactivation. Therefore, a three-stage process is proposed for this simulation work.
Process flow description: Figure 3 shows the overall process flow block diagram developed for the simulation to upgrade bio-oil via HDO. The feeds to this process consist of bio-oil and hydrogen. The process developed is described in more details.
Process simulation using iCON:
Assumptions: The major assumptions used in the simulation are:
938 kg 1 year
Availability 4,165, 215 ha year.ha 365 days
1 ton 10,704.03 ton 1000 kg day
= × ×
× =
• Based on the conversion of the bio-oil obtained from the pyrolysis of palm shell, the bio-oil flowrate used in the simulation is 2,586.81 kg h−1, i.e. approximately 1% of the total biomass available from palm shell in Malaysia annually. The detailed calculations are shown in Table 4:
Flowrate of liquid product
ton 1 day 1000 kg 1% 6, 208.34
day 24 h 1 ton kg
2,586.81 h
= × × ×
=
• A mixture of 4.82% GUA, 28.30% phenol and 66.88% inert is used to represent the fraction of bio-oil (Islam et al., 1999)
• HDO of bio-oil is represented as the HDO of GUA to phenol and HDO of phenol to hydrocarbons (Gutierrez et al., 2007; Furimsky, 2000; Viljava, 2001)
• 1,2-benzenediol is selected as the hypothetical compound for catechol in the simulation(Afifi et al., 1996)
• Conversion of cyclohexene to cyclohexane is assumed to be 97% (Senol, 2007)
• Main HDO products of phenols are benzene, cyclohexane and cyclohexene (Senol,2007) • Side HDO product of GUA is methane while water
is the side HDO products of 1,2-benzenediol and phenol
Table 3: Annual availability of palm shell in Malaysia Oil palm Dry amount Price
waste (kg year ha−1) Areas (ha) (RM ton−1) References
Palm 938 4,165,215 40 (Islam et al., 1999; shell Noor et al., 1990;
United Nations Development Programme, 2007)
Table 4: The calculation on flowrate of bio-oil as used in the simulation work in comparison with other work
Flowrate of bio-oil mixture calculated using results by
Islam et al. (1999) and Flowrate of bio-oil Parameter Viljava (2001) mixture in this study Feed (ton day−1) 0.012 10,704.03 Liquid product 58 58 yield (wt %)
Flowrate of liquid = 0.012×0.58 = 10,704.03×0.58 product (ton day−1) = 0.0070 = 6,208.34
Property package: The Soave-Redlich-Kwong property package is selected to calculate the thermodynamic data of the phases (Viljava and Krause, 1996). Besides its success in applications, the Soave-Redlich-Kwong property package is also used to allow comparison between the results obtained from this study and to those by others that have used the same property package.
Feed stream: Table 5 lists the composition of bio-oil assumed in the simulation.
The operating parameters for the feed streams are summarized in Table 6.
The bio-oil flowrate was used to calculate the minimum hydrogen flowrates to be consumed in the HDO reaction.
HDO of GUA: This stage consists of the hydrogenolysis of the methoxy group from GUA which produces a fraction of Catechol (CAT) and methane. Figure 4 illustrates the primary mechanism of the reaction.
The operating parameters for the reactor are given in Table 7.
Table 5: The composition of bio-oil (Islam et al., 1999)
Quantification
Chemical compound identification (wt % of bio-oil)
Guaiacol (GUA) 4.82
Phenol 28.30
Inert (hypothetical compound) 66.88
Table 6: Operating parameters for feed stream
Temperature Pressure Mass flow Vapor
Stream (°C) (atm) rate (kg h−1) fraction
Bio-oil 30 1 2,000-3,000 -
Hydrogen 30 1 0-100 1.0
Table 7: Operating parameters for conversion reactor for HDO of GUA
Parameter Reference
Temperature (°C) 250 (Gutierrez et al., 2009) Pressure (MPa) 8.0 - 8.2 (Gutierrez et al., 2007; 2009)
Conversion (%) 48 (Gutierrez et al., 2009)
Catalyst CoMo/Al2O3 (Gutierrez et al., 2007; 2009)
Table 8: Properties of 1,2-benzenediol and catechol
Compound 1,2-benzenediol Catechol
Chemical formula C6H6O2 C6H6O2
Molecular weight 110.11 110.11
Normal boiling point (°C) 245.50 245.50
Liquid density @ 298 K (kg m−3) 1225.78 1275.00
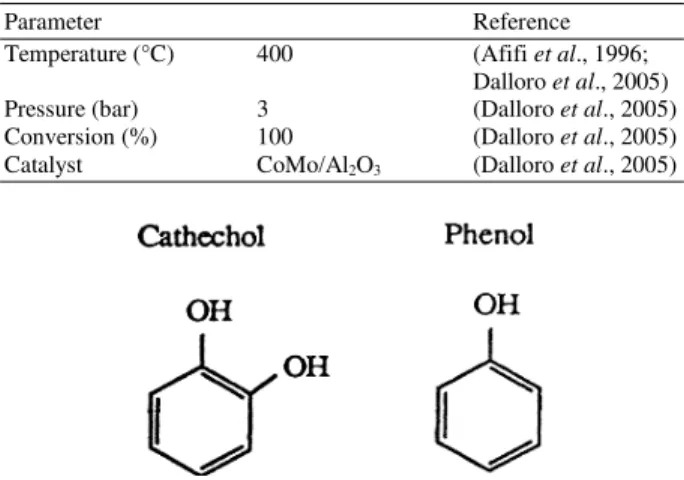
Table 9: Operating parameters for conversion reactor for HDO of CAT
Parameter Reference
Temperature (°C) 400 (Afifi et al., 1996;
Dalloro et al., 2005)
Pressure (bar) 3 (Dalloro et al., 2005)
Conversion (%) 100 (Dalloro et al., 2005)
Catalyst CoMo/Al2O3 (Dalloro et al., 2005)
Fig. 5: Reaction scheme for the hydrotreating of CAT (Afifi et al., 1996)
CAT, the product of the GUA hydrogenolysis, is represented as 1,2-benzenediol. This is due to the complexity and error in the simulation that was encountered when assuming a hypothetical compound for CAT. To justify the assumption, the comparison between the properties of 1,2-benzenediol and CAT compounds are listed in Table 8.
Based on the comparison in Table 8, the relative deviation in the liquid density was calculated to be 3.86% and was taken into consideration in representing 1,2-Benzenediol as CAT compound.
The next stage is the reaction that consists of the elimination of one OH group from CAT to produce phenols which are the predominant primary products. In this case, phenols as the major oxygen containing products underwent the stabilization stage as the main reactant. Figure 5 illustrated the reaction scheme for the hydrotreating of CAT.
The operating parameters for the second stage of HDO are given in Table 9.
Table 10: Operating parameters for conversion reactor for stabilization stage
Parameter Reference
Temperature (°C) 300 (Gutierrez et al., 2009)
Pressure (MPa) 8.0-8.2 (Gutierrez et al., 2007; 2009)
Conversion (%)
Phenol → Benzene 34 (Gutierrez et al., 2009) Phenol → Cyclohexanone 34 (Gutierrez et al., 2009) Cyclohexanone → Cyclohexanol 100 (Senol, 2007) Cyclohexanol → Cyclohexene 100 (Senol, 2007)
Cyclohexene → Cyclohexane 97
Catalyst CoMo/Al2O3 (Viljava, 2001;
Gutierrez et al., 2009)
Stabilization stage: The breakdown of the whole reaction involved in this stage along with the operating parameters for the reactor, are given in Table 10. Initially, benzene and cyclohexanone were formed simultaneously from the conversion of phenol. A series of reactions occur, leading to the formation of hydrocarbon products; cyclohexane and cyclohexene (Senol, 2007).
RESULTS
Process simulation: To develop the bio-oil upgrading process flowsheet, the iCON (Virtual Materials Group Inc., 2009) process simulation package is employed. This commercial process simulator that is developed by PETRONAS, Malaysia’s national oil corporation, in collaboration with Virtual Materials Group (VMG) Inc., is based on Sim 42 and runs on VMGThermo as the plug-in thermodynamics property package database standard.
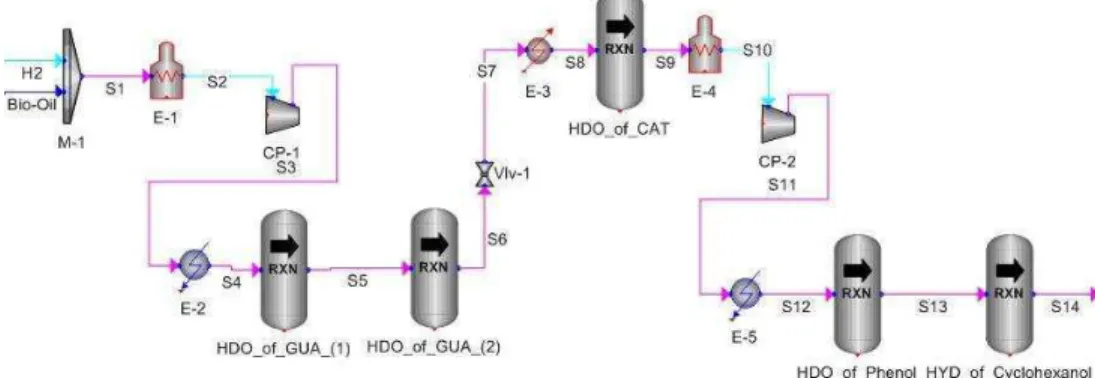
The simulated process flowsheet shown in Fig. 6 has been modeled as a steady-state system to produce a base case without the potentially complex consideration of dynamics. The Soave-Redlich-Kwong property package is used in the simulation so that results comparison can be made to the simulation work done by others that used the same property package.
Referring to Fig. 6, bio-oil and hydrogen, initially in the mixture phase of liquid and vapor, are heated up using a furnace to achieve a full vapor phase for better mixing effects. The vapor phase is compressed to the operating pressure of 8.6 MPa before entering conversion reactor 1 as a liquid-vapor mixture with a vapor fraction close to 1. The mixture is then cooled to 250°C before it enters the first stage of the hydrogenolysis of GUA which produces CAT as the major product and methane as the by-product in the conversion reactor.
Fig. 6: iCON process simulation of the HDO of bio-oil Table 11: Operating parameters and component mass flows for the simulation of the HDO of bio-oil
Name Bio-oil H2 S1 S2 S3 S4 S5 S6 S7 S8 S9 S10 S11 S1 S13 S14 VapFrac 0 1 0.3901 1 0.6029 0.4134 0.4154 0.4169 0.5829 0.6042 0.6046 1 0.603 0.4749 0.4461 0.4688 T (°C) 30 30 30 1939.2 1316.6 250 250 250 249.8 400 400 2453.4 1573.9 300 300 300 P (kPa) 101.33 101.33 101.33 50.66 8600 8400 8200 8000 340 320 300 280 8400 820 8000 7800 Mass flow 1730.06 0 1730.06 1730.06 1730.06 1730.06 1730.06 1730.06 1730.06 1730.06 1730.06 1730.06 1730.06 1730.0 1730.06 1730.06 inert*(kg h−1)
Mass flow guaiacol 124.68 0 124.68 124.68 124.68 124.68 64.84 33.71 33.71 33.71 33.71 33.71 33.71 33.71 33.71 33.71 (kg h−1)
Mass flow 1,2 0 0 0 0 0 0 53.09 80.69 80.69 80.69 0 0 0 0 0 0 -Benzenediol (kg h−1
)
Mass flow 732.07 0 732.07 732.07 732.07 732.07 732.07 732.07 732.07 732.07 801.03 801.03 801.03 801.03 256.33 256.33 Phenol (kg h−1
)
Mass flow 0 32 32 32 32 32 31.03 30.52 30.52 30.52 29.50 29.50 29.50 29.50 11.54 0.0514 Hydrogen (kg h−1
)
Mass flow 0 0 0 0 0 0 7.73 11.76 11.76 11.76 11.76 11.76 11.76 11.76 11.76 11.76 Methane (kg h−1
)
Mass flow 0 0 0 0 0 0 0 0 0 0 13.2 13.2 13.2 13.2 65.34 117.47 Water (kg h−1
)
Mass flow 0 0 0 0 0 0 0 0 0 0 0 0 0 0 226.05 226.05 Benzen (kg h−1)
Mass flow 0 0 0 0 0 0 0 0 0 0 0 0 0 0 284.02 0 Cyclohexanone
(kg h−1 )
Mass flow 0 0 0 0 0 0 0 0 0 0 0 0 0 0 0 0
Cyclohexanol (kg h−1
)
Mass flow 0 0 0 0 0 0 0 0 0 0 0 0 0 0 0 7.13
Cyclohexane (kg h−1
)
Mass flow 0 0 0 0 0 0 0 0 0 0 0 0 0 0 0 236.25 Cyclohexane
(kg h−1 )
The operating pressure of the product stream from reactor 2 is reduced using a valve to 3.4 MPa before the stream is heated to 400°C prior to its entrance into the third conversion reactor. In this reactor, CAT as the main reactant, is hydrotreated with hydrogen to produce phenol as the reaction’s major product and water as the by-product.
The product mixture from this reactor is once again heated up to achieve a vapor fraction of 1, compressed to 8.4 MPa and cooled to 300°C before it undergoes the next stage of the reaction. HDO of phenol, which produces hydrocarbons as the major product and water as the by-product, occurs here in the conversion reactor.
During this reaction, phenol is hydrotreated with hydrogen and converted into benzene through
hydrogenolysis and into cyclohexanone through hydrogenation, simultaneously. Cyclohexanone is further hydrogenated completely to produce cyclohexanol where these two compounds are the reaction intermediates for the formation of hydrocarbons. Complete hydrogenolysis of cyclohexanol produces cyclohexene as one of the hydrocarbon products and cyclohexane was formed through the hydrogenation of cyclohexene.
cyclohexene are produced from 2,586.81 kg h−1 of bio-oil.
Economic potential: Benzene and cyclohexane are valuable materials especially in the transportation and petrochemical industries. For one, benzene and cyclohexane can be sold as a solvent for the production of ethanol fuel. Benzene is used to produce intermediates such as ethylbenzene for styrene production and cumene for phenol and acetone, while cyclohexane is consumed to produce nylon (ICIS.com, 2008a; 2008b). Table 12 shows the cost for raw materials and selling prices for products of HDO of bio-oil.
The preliminary Economic Potential i.e., level 1 (EP1) for HDO of bio-oil process hourly is:
EP 1 = Revenue-Cost of raw materials
EP1 = Benzene produced + Cyclohexane produced -Bio-oil consumed - Hydrogen consumed ≈ MYR 1934
(Note: Currency exchange USD 1.00 = MYR 3.70 as of 21 February 2009)
≈ USD 523
The calculated EP1 value indicates positive potential for the process.
Results comparison: Table 13 shows the product yield and selectivity calculated based on the results obtained from the simulation using iCON using Eq. 1-3:
moles of reactant converted in reactor
Conversion 100
moles of reactant fed to reactor
= × (1)
moles of desired product formed
Selectivity 100
moles of reactant converted in reactor
= × (2)
moles of desired product formed
Yield 100
moles of reactant fed to reactor
= × (3)
Table 12: Cost of bio-oil and hydrogen and selling prices of benzene and cyclohexane
Selling price (RM ton−1) Material Cost (RM ton−1) (ICIS.com, 2008a; 2008b)
Bio-oil 40.00
Hydrogen 4217.00
Benzene 4,275.00
Cyclohexane 5,106.25
Table 13: Product yield and selectivity Total mole
Product of product Selectivity (%) Yield (%)
Benzene 2.89 50.00 34.00
Cyclohexane 2.81 83.28 81.19
Cyclohexene 0.09 3.06 3.06
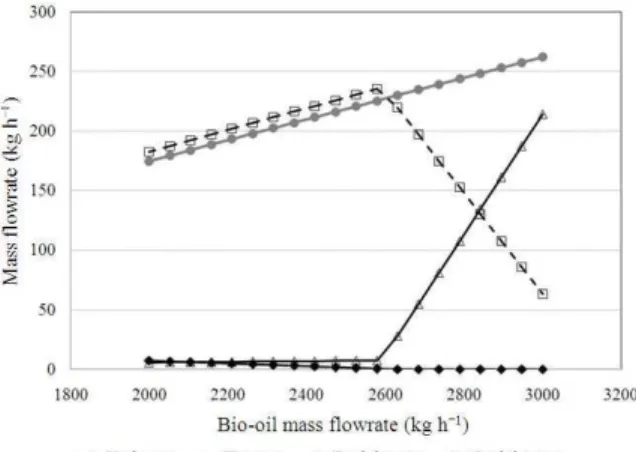
Fig. 7: The effect of bio-oil flowrate on the products distribution
From Table 13, the selectivity for benzene is approximately 50%. This phenomenon can be explained by the fact that HDO of phenol simultaneously produces benzene and cyclohexanone as its major products. The selectivity for cyclohexane is higher compared to selectivity for cyclohexene. This explains why the major products for the HDO of phenol (Senol, 2007) are benzene and cyclohexane, while the yield for cyclohexene never exceeds 2%.
The relative deviation between the cyclohexene yields predicted in this study and published by Senol (2007) is 53%.
Profiles for the products distribution: Figure 7 illustrates the relationship between the bio-oil flowrate and the products distribution which comprises of the mass flowrate of hydrogen consumed and of other products for HDO of phenol i.e. benzene, cyclohexane and cyclohexene. From the graph, it is clearly observed that as the flowrate of bio-oil is increased from 2000-3000 kg h−1, the formation of benzene increases. Meanwhile, cyclohexene amount increases slowly at first then drastically after a certain increment in the bio-oil flowrate. The amount of cyclohexane increases with the increasing amount of bio-oil and beyond a certain point, it drops dramatically.
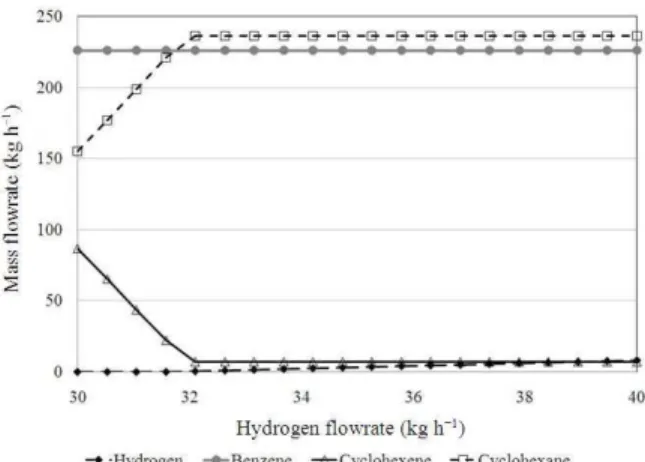
Fig. 8: The effect of hydrogen flowrate on the product distribution
Fig. 9: The effect of hydrogen flowrate on the product distribution
Figure 8 plots the trend for the hydrogen flowrate varying from 31-40 kg h−1 where beyond this range, there is no dramatic change observed. Figure 9 on the other hand, zooms into the region in which drastic change is observed, i.e., from 31-33 kg h−1.
DISCUSSION
Process simulation: The simulation of the upgrading process was performed at the operating conditions within a selected range based on empirical data from referred literatures. The simulation indicates the feasibility of producing benzene and cyclohexane through a series of reactions that eliminate the oxygen compound present in bio-oil. Overall, the simulation converged to predict the production of the expected products as by other work.
Economic potential: The positive preliminary economic potential indeed indicates the economic viability and promising return, especially as this calculation is based on only 1% of the total available palm shell in Malaysia. Furthermore, in the midst of the recent instability of global fossil oil price, the demand for benzene and cyclohexane is expected to rise significantly in the South East Asia region especially for the transportation and petrochemical industries which produces goods to meet the population’s needs.
Results comparison: The comparison study on yield and selectivity of the process shows that our results match to some extent with empirical results from literatures. This comparison study cannot be more extensive as the available literature is comparable only in terms of the reaction kinetics, element balance, reaction time and compounds concentration. Furthermore, there is a limited similarity between the thermodynamic properties for HDO of phenol used in the simulation compared to those in the experimental work.
Profiles for the products distribution: The trends observed for cyclohexene and cyclohexane amounts with respect to bio-oil flowrate increment indicates that more hydrogen is required for the hydrogenation of the increasing amount of cyclohexene to produce cyclohexane and the hydrogen feed is not enough to compensate this.
Figure 8 and 9 further indicate that hydrogen appears as the limiting reactant in producing the product of interest and it is important to determine the minimum hydrogen demand for the reaction. Based on Fig. 7-9, the optimal flowrates of bio-oil and hydrogen for the process are determined to be at 2,587 and 32 kg h−1 where maximum yields of benzene and cyclohexane are obtained. In addition, it is observed that hydrogen supply is the limiting agent in producing cyclohexane rather than cyclohexene.
Model limitations: Detailed analysis and comparison of the designated results could not be performed as there was no available inclusive literature on simulation work of similar compounds. The preliminary process flowsheet was designed based on the process synthesized and developed, resulting in the association of high degree of uncertainties based on the respective process schemes, reactions and operating parameters.
mix liquid bio-oil and gaseous hydrogen before they are fed to the first reactor for the production of 1,2-benzenediol. There is also an issue on the necessity to heat up the bio-oil to a gaseous phase to react with hydrogen gas. Nevertheless, feasible and promising solutions may perhaps be recommended to tackle the flawed nature of the mixer by injecting hydrogen bubbles into the bio-oil feed or using a multi-zone reactor to promote the reaction contact between bio-oil and hydrogen.
Due to the limited availability of the kinetic parameters data for HDO of bio-oil, attempts to predict the reaction profiles based on the changes in the operating conditions cannot be performed in this study despite the previous reports on significant effect of temperature and pressure on product mass flow, especially with catalyst (s) utilization.
CONCLUSION
In summary, there are several challenges in upgrading bio-oil via HDO especially o the significant aspect of choosing an appropriate model compound to represent the fraction of bio-oil. However, in this study, the simulation process of upgrading bio-oil via HDO into value added chemicals is successfully performed using iCON. The simulation indicates the feasibility of producing hydrocarbons through a series of reaction by eliminating the oxygen compound present in bio-oil. This simulation work provides a platform for further investigation and process optimization that allows and promotes the concept of co-fed and co-processing in existing refineries as the results indicate the success of simulating hydrocarbons production with conventional catalysts. However, this study only includes an investigation that is focused on studying the effect of feed flowrates towards the product distribution. Hence, additional validation and extended work are essential in contributing towards the reliability of this study for further development. Nevertheless, the preliminary economic potential calculated for this study indicates good economic viability.
ACKNOWLEDGEMENT
The authors wish to thank University Technology for the facilities for the work.
REFERENCES
Afifi, A.I., E. Chornet, R.W. Thring and R.P. Overdent, 1996. The aryl ether bond reactions with H-Donor solvents: Guaiacol and tetralin in the presence of catalyst. Fuel, 75: 509-516. DOI: 10.1016/0016-2361(95)00199-9
Astron International, Inc., 2009. FCC Octane MON versus RON.
http://www.refiningonline.com/engelhardkb/crep/tc r4_29.htm
Dalloro, L., A. Cesana, R. Buzzoni and F. Rivetti, 2005. Process for the preparation of phenol by means of the hydrodeoxygenation of benzene-diols. United States Patent No. US 6,936,738 B2, 2005.
Furimsky, E., 2000. Catalytic hydrodeoxygenation. Applied Catal. A: Gen., 199: 147-190. DOI: 10.1016/S0926-860X(99)00555-4
Gutierrez, A., M.E. Domine and Y. Solantausta, 2007. Co-processing of upgraded bio-liquids in standard refinery units-fundamentals. Proceeding of the 15th European Biomass Conference and Exhibition,
May 7-11, Berlin, pp: 1-15.
http://www.biocoup.com/fileadmin/user/pdf/results /06_BIOCOUP_May07.pdf
Gutierrez, A., R.K. Kaila, M.L. Honkela, R. Slioor and A.O.I. Krause, 2009. Hydrodeoxygenation of guaiacol on noble metal catalysts. Catal. Today, 147: 239-246. DOI: 10.1016/j.cattod.2008.10.037 Huber, G.W., S. Iborra and A. Corma, 2006. Synthesis
of transportation fuels from biomass: Chemistry catalysts and engineering. Chem. Rev., 106: 4044-4098. DOI: 10.1021/cr068360d
ICIS.com, 2008a. Benzene uses and market data. http://www.icis.com/v2/chemicals/9075159/benzen e/uses.html
ICIS.com, 2008b. Cyclohexane (CX) uses and market data.
http://www.icis.com/v2/chemicals/9075207/cycloh exane/uses.html
Islam, F.N., R. Zailani and F.N. Ani, 1999. Pyrolytic oil from fluidised bed pyrolysis of oil palm shell and its characterization. Renew. Energy, 17: 73-84. Mahfud, F.H., 2007. Exploratory studies on fast
pyrolysis oil upgrading. Doctoral Thesis, University of Gronigen, The Netherlands.
Noor, M.J.M.M, A. Jusoh and A.H. Ghazali, 1990. Management and utilization of oil palm wastes, a review. University Pertanian Malaysia, ISBN: 967-9952-61-4.
Senol, O.I., 2007. Hydrodeoxygenation of aliphatic and aromatic oxygenates on sulphided catalysts for production of 2nd generation biofuels. Doctoral Thesis, Helsinki University of Technology, Finland.
US Energy Information Administration, 2009. EIA-Annual Energy Outlook 2009. Early release overview. http://www.eia.doe.gov/oiaf/ieo/
Virtual Materials Group Inc., 2009. VMGSIM. http://www.virtualmaterials.com/node/6
Viljava, T.R. and A.O.I. Krause, 1996. Hydrogenolysis reactions in a batch reactor-effect of mass balance inaccuracies on the kinetic parameters. Applied Catal. A: Gen., 135: 317-328. DOI: 10.1016/0926-860X(95)00262-6