Locating the Upper Body of Covered Humans in
application to Diagnosis of Obstructive Sleep
Apnea
Ching-Wei Wang*, Amr Ahmed and Andrew Hunter
Abstract—Obstructive Sleep Apnea is increasingly seen as a common and important condition, contributing to sleep disturbance and consequential daytime sleepiness. According to recent research findings, the best predictors of morbidity in individual patients, as assessed by improvements with CPAP (continuous positive airway pressure therapy), are nocturnal oxygen saturation and movements during sleep. Although pulse oximetry is a well-established technique to analyze oxygen saturation, video monitoring and interpretation is less well developed both from a processingand analysis viewpoint. This is due to the relative computational complexity of video processing analysis, as well as application-related technical challenges, involving night vision, the body being obscured by cover, variation on human size and behavior and massive video and audio data. In this paper, we propose a novel approach to locate upper body parts of the covered human body. The locations of the upper body parts allow further analysis of covered body postures and human activity recognition in sleep. The experimental results show that the proposed model is promising to estimate the head and torso locations of the covered human body with various postures, body activities and filming environmental settings.
Index Terms—biomedical pattern analysis, covered human body, image analysis, obstructive sleep apnea.
1.INTRODUCTION
Obstructive Sleep Apnea is increasingly seen as a common and important condition, contributing to sleep disturbance and consequential daytime sleepiness. This has potentially serious consequences for the individual, employers and society as a whole. A wide range of parameters including EEG (electroencephalogram) sleep staging, snoring, change in airway resistance, airflow and respiratory effort as well as oxygen saturation and body movement during “normal sleep” in a Sleep Lab lead to an understanding of the pathophysiology
of sleep apnea [1]. According to recent research findings [2]—[4], the best predictors of morbidity in individual patients, as assessed by improvements with CPAP (continuous positive airway pressure therapy), are nocturnal oxygen saturation and movements during sleep. In addition, these parameters have the advantage of being relatively non-intrusive.
Manuscript received March 6, 2007. This work is supported jointly by the United Lincolnshire Hospital NHS Trust and the University of Lincoln, UK.
Ching-Wei Wang is with the Video Surveillance and Machine Perception Research Centre, University of Lincoln, Brayford Pool, Lincoln LN6 7TS, United Kingdom (phone: +44 (0)1522837107; fax: +44 (0)1522886771; e-mail: [email protected]).
Amr Ahmed is with the Video Surveillance and Machine Perception Research Centre, University of Lincoln, Brayford Pool, Lincoln LN6 7TS, United Kingdom (e-mail: [email protected]).
Andrew Hunter is with the Video Surveillance and Machine Perception Research Centre, University of Lincoln, Brayford Pool, Lincoln LN6 7TS, United Kingdom (e-mail: [email protected]).
Video Monitoring has been adopted to assist diagnosis on obstructive sleep apnea. Sivan et al [6] indicate that results from traditional Polysomnography, which requires intrusive measurements and costly measurement equipment, are highly correlated with video test results. Although pulse oximetry is a well-established technique to analyze oxygen saturation, video monitoring and interpretation is less well developed both from a processingand analysis viewpoint. This is due to the relative computational complexity of video analysis, as well as application-related technical challenges, involving night vision / low illumination, body obscured by cover, variation on human size and behavior and massive video and audio data.
Recognition of covered human body activity appears to be a challenging task. Existing monitoring techniques in the sleep lab [5] utilize motion sensors, patterned sheets and infrared light to compute gross degrees of motion from video recorded throughout the night. However, gross motion suggests only periods of time with movements rather than identifying what the activities are, which still require clinicians to look into substantial amounts of video data for analyzing detailed human sleep activities. This is thus a time-consuming and expensive process.
properties, the thermal imaging system often fails to locate a true human posture because the heat tends to remain on the sheet or over the bed after the body posture has changed. Figure 1 illustrates the issue, showing an image shortly alter a leg movement. The image of the leg on the right indicates the current position; the ghost on the left indicates its previous location.
Fig. 1. Test on a Thermal Imaging System, which fails to locate a true body posture since the heat remains on the bed after movements. The right leg in the image is the real leg and the left one is the heat left on the bed.
There is clearly a need for more automated non-invasive methods to recognize human activities during sleep. Thus, our research is focused on developing an intelligent video monitoring system, which will be capable of identifying body postures for covered humans and recognizing human activities during sleep, such as leg movement, body rotation, arm movement, and head movement. To minimize sleep disturbance, monitoring is done using invisible IR lights and cameras.
This research addresses the problem of detecting and segmenting the covered human body. In our case, difficulties arising from night vision, the shifts of the cover surface with movements, obscure body borders under cover, and wrinkle noises are compounded by human articulated deformation. Traditional computer vision methods such as correlation, template matching, background subtraction, contour models and related techniques for object tracking become ineffective [7], [8] because of the large degree of occlusion for long periods. Current research in machine vision [9]—[14] for monitoring or tracking occluded objects focuses on temporary occlusion rather than constant obscuration. The main technical difficulty here is to observe objects constantly under fully or partially cover. Jaeggli et al. [15] developed a learned statistical model to predict unobserved features based on partial measurements. However, the method requires data without occlusion to train first and initialize the model, which is not applicable in our case, as each patient comes for one night only. Huang and Jiang [7] presented an iterative method of weighted region consolidation to track a camouflaged object in an outdoor environment. As obscured or camouflaged objects become visible only (or mainly) while in motion, the method locates the object based on pixels with high motion probabilities. However, movements of covered objects lead to motion of the surface around rather than the exact area of the objects, leading to difficulties in segmentation in comparison to camouflaged objects.
In this paper, we propose an approach to locate the upper body parts of a covered human body. The location of the upper body parts allow further analysis on covered body postures and human activity recognition in sleep. The method includes a combination of image processing techniques for extracting object features effectively, an edge box map for further shape abstraction to locate the torso, a hierarchical-ensembles head
detector and a torso detector (See Figure 2). The experimental results show that the proposed model is promising to estimate the head and torso locations of the covered human body precisely with various postures, body activities and smoothness of the cover.
Original Image
Edge Image
Edge Box Map
Head Position Torso Detector Torso Position Edge Abstraction Hierarchical Ensembles Head Detector Combined Image Processing
Fig. 2. System Framework
The structure of this paper is as follows. In section 2 we describe methods used for feature extraction. Section 3 and 4 provides the details of the head and torso detectors respectively. The experimental results are presented in section 5. Finally, we discuss the conclusion and future works in section 6.
2.FEATURE EXTRACTION
As the surface of the cover has uniform texture and color, segmentation methods utilizing texture or color information are not applicable. Hence, the edge information is employed here for extracting object features. Nonetheless, due to the nature of the sheet, large amounts of wrinkle noise are produced. Thus, the first step is to explore a solution that obtains important edges and removes redundant ones at the same time. A combined image processing technique is proposed in section 2.A, producing edge images, which then are used for detecting the head in section 3.
As the remaining edges in the edge images tend to be discontinuous and scattered, an edge box map is created for shape abstraction, which proves to generate a robust and clear outline of the human body. The method is demonstrated in section 2.B. The edge box map is utilized in searching for the torso part in section 4.
A.Edge Image
We attempt to extract important edges from the outline of the human body while discounting the wrinkles in the sheet. General edge detectors such as Sobel Kernels, Prewitt Kernels, Kirsch Compass Kernels and Laplacian [18] inevitably produce noisy information from wrinkles. Due to the horizontal layout of the bed, we propose an oriented horizontal edge detector to effectively generate object edges aligned with the body, and to remove noise. The oriented horizontal edge detector can be formulated in Equation 1.
⎥ ⎥ ⎥ ⎦ ⎤ ⎢ ⎢ ⎢ ⎣ ⎡− − − − − − − = = + ′ − − = ⊗ = ′
∑ ∑
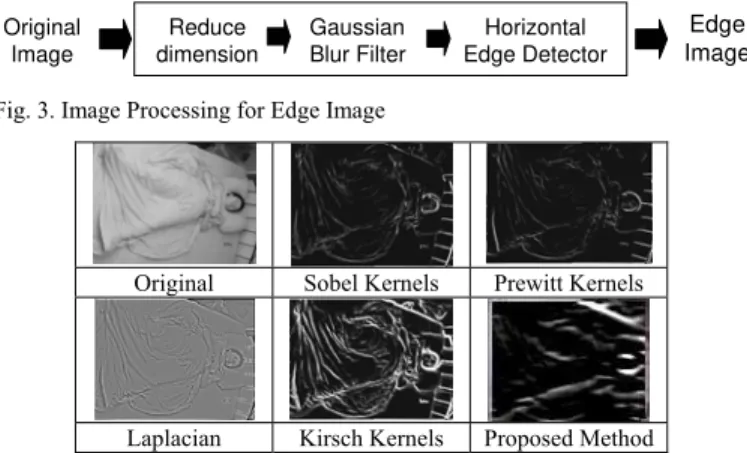
− = =− 1 1 1 1 1 1 1 0 0 0 0 0 0 0 1 1 1 1 1 1 1 ) , ( 1 2 , : ) , ( , : ) , ( , ) , ( ) , ( ) , ( ) , ( ) , ( g g of size N image output y x I image input y x I where g y x I g y x I y x I N N N N υ ω υ ω υ ω υ ωIn addition, in order to preserve stability of the edge quality and avoid influences from environment factors, a Gaussian blur filter [19] is applied before the edge detector. Moreover, the image dimension is reduced initially. There are two advantages using down-scale images: scene abstraction; and an increase in computational speed. Figure 3 displays the sequence of the combined image processing techniques for generating edge images, and Figure 4 compares different edge detectors over a sample image, showing that the proposed approach outperforms others in both producing the outline of the human body and removing noisy edge information.
Original Image
Gaussian Blur Filter
Horizontal Edge Detector
Edge Image Reduce
dimension
Fig. 3. Image Processing for Edge Image
Original Sobel Kernels Prewitt Kernels
Laplacian Kirsch Kernels Proposed Method
Fig. 4. Resulting images by general edge detectors and the proposed method.
B.Edge Box Map
As the targeted human body is covered, a portion of the edge information is lost. Hence, we develop an edge box map approach for further shape abstraction, to deal with the issue of discontinuous and scattered edges. Figure 5 displays two edge box maps calculated from edge images, which extract edge information from the original images in the left column. The resulting edge box maps are then utilized by the torso detector to find the covered torso part. The torso detector is introduced in section 4.
Given an (m × n) edge image and an (s × s) edge box, we generate an edge box map B(i, j), which can be formulated as follows.
{
⎣m s⎦}
j{
⎣n s⎦}
k l{
s iwhere
l k f otherwise
if j
i
B ij
,..., 1 , / ,..., 1 /
,..., 1 ,
) , ( 0
1 ) , (
∈ ∈
∈
≥ ∑
⎩ ⎨ ⎧
= τ
}
(2)( (
−)
+(
−)
+)
≥υ⎩ ⎨ ⎧
= I i s k j s l
otherwise if l
k fij
1 , 1 0
1 ) ,
( (3)
where I(x, y) is the intensity value of the edge image at location (x, y). In this work, the following values are used based on our experiments. (s = 3, τ = 50, υ = 30).
Original Image Edge Box Map Original Image Edge Box Map
Fig. 5. Original Images and Edge Box Maps.
3.HEAD DETECTOR:HIERARCHICAL ENSEMBLES
There has been considerable work on face detection in computer vision research over the past ten years. However, most of the face detection systems require at least portions of the face to be shown, such as both eyes. Patients may sleep on their side, presenting only half or less of the face. Here, a head detector invariant to facial direction is built, utilizing an ensemble machine learning algorithm [17], which is presented below.
Ensemble Machine Learning Algorithm Inputs:
1. A training set T < X, Y >, where X represents the instances and Y are the classes. X: a set of instances: {x | x = <a1,…, aq>}, where ai is an attribute value and q is the
number of attributes.
Y: a set of classes (with z different classes)
T: {<x1, y1>, …, <xn, yn> | x ∈X, y∈Y}, where n is the size of the training set.
2. R: Number of base classifiers. R=10. 3. L: The limit value of bootstrap times. L=10. 4. Base Learner / Inducer: C4.5 decision tree [16].
Output:
Function C*
Steps:
1.Initialize instances’ weights, Weight: W1( i ) =1/n, where i = 1 to n
2.Generate a copy of the training data(T) as S, where T is for evaluating base classifiers and S is for building them.
3.Repeat 3.1 to 3.9 R times
3.1 Data-Bootstrap S dataset from previous round S dataset
3.2 Build a new base Classifier Cr(X) using weighted S dataset (X, Wr) by base learner.
3.3 Evaluate the base classifier Cr(X) with training data T. Error rate = Sum of the
weights of the misclassified instances by the base classifier Cr(X)
3.4 Check if the error rate equals to 0 and the number of bootstrap <= L. If both true, go back to 3.1 to do the bootstrap.
3.5 If error > 0.5, go to step 4. 3.6 Br = error rate / (1 - error rate)
3.7 Set sum of instance weights for next round to 0: SumWr+1 = 0 ** Update instances’ weights
3.8 For i = 1 to n, check if Cr misclassifies instance i. 3.8.1 If true, Wr+1(i) = Wr(i) * Br. Otherwise, Wr+1(i) = Wr(i)
3.8.2 SumWr+1 = SumW r+1 + Wr+1(i)
** Normalise instances’ weights 3.9 For i = 1 to n, Wr+1(i) = Wr+1(i) / SumW r+1
4.Produce the ensemble model Function C*(instance) by Voting
Auxiliary algorithm: Data Bootstrapping Input: A dataset with n instances
Output: A bootstrapped dataset with the same size of the input dataset
Steps:
1. Generate n random numbers: R1 to Rn.
2. Compute n accumulated probabilities: P(i) = ΣRi, where i =1 to n.
3. Normalize probabilities’ values: P(m) = [ P(m) / ΣP(i) ] * ΣW(i), where m = 1 to n, i = 1 to n.
4. Initialize two indices: k = 1, the index of the probability list; x = 1, the index of the weight list.
** Compare accumulated probabilities with accumulated weights 5. Check if k <= n and x <=n
5.1 If true, sumW(x) =ΣW(i), where i = 1 to x. 5.1.1 Check if k <= n and P(k) < sumW(x)
5.1.1.1 If true, add instance x to the output dataset, set the weight of instance k of the output dataset as x and plus 1 to k.
5.2 Otherwise, plus 1 to x. 6. Terminate with the output dataset
Auxiliary algorithm: Voting
Function C*(instance)
Steps:
1. Initialise votes of classes y1∼ yz to 0: V(i) = 0, where i = 1 to z
2. For j = 1 to R, V(i) = V(i) + log( 1/ Bj ), where j = 1 to R and i = the class index generated
by base classifier j.
3. Terminate with the predicted class yi with the largest vote V(i)
model for head detection is constituted of 3-layer hierarchical ensembles. Each ensemble consists of 10 decision tree base classifiers. The training procedure is decomposed as follows, and the overview of the training scheme is presented in Figure 6(b).
Step 1: Prepare Training Data (See Figure 6(a)) Step 1.1: Select 15 different frontal head images Step 1.2: Select 15 different head images on sides Step 1.3: Randomly select 10 different non-head images
Step 1.4: Set the head images as class T and non-head images as class F. Step 2: Train 1st
layer ensemble machine learning head model using the data collected in Step 1.
Step 3: Test 1st
layer machine learning model and generate a number of false positive instances
Step 4: Prepare Training Data for 2nd layer model
Step 4.1: Randomly select 10 different false positive instances from Step 3 Step 4.2: Set the instances from step 4.1 as class F.
Step 5: Train 2nd
layer ensemble machine learning head model using the data collected in Step 1 and Step 4.
Step 6: Test 2 layers hierarchical machine learning models and generate a number of false positive instances
Step 7: Prepare Training Data for 3rd
layer model
Step 7.1: Randomly select 10 different false positive instances from Step 6 Step 7.2: Set the instances from step 7.1 as class F.
Step 8: Train 3rd
layer ensemble machine learning head model using the data collected in Step 1, Step 4 and Step 7.
Step 9: Terminate with 3 layers ensemble machine learning models.
Category: Head
Category: Non-head
Selected Edge Image Set:
…
10 images
...
15 Frontal
15 Sides
...
Fig. 6 (a). Collect Training Data Procedure: The format of the training data is intensity values of a 14 ×14 edge image. I [x, y], where x is valid from 1 to 14 and y is valid from 1 to 14.
...
Head data Non-head data
...
Layer 1: Ensemble1
10 selected false positive instances
(non-heads)
Train
10 selected false positive instances
(non-heads)
Train Layer 2: Ensemble2
Layer 3: Ensemble3
Train
Testing Data
Testing Data Training Data
Fig. 6 (b). Training Scheme. Hierarchical structure allows continuously refining patterns and rules by focusing on the false positive instances from previous learning experiences.
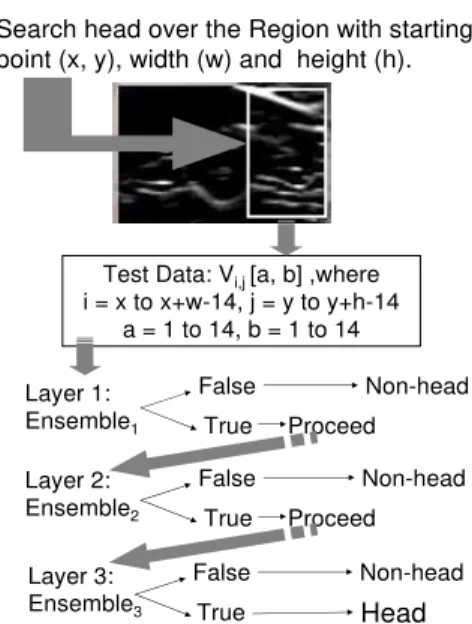
The hierarchical structure allows patterns and rules to be continuously refined by focusing on the false positive instances from the previous learning experience. The proposed method utilizes a relatively small number of instances to build the machine learning models, and moreover all training data is selected from one single video clip. In evaluation, the experimental results show that the head detector works robustly for locating the head in testing all 17 video data, which are recorded with 4 different filming angles and in 2 different environments. Figure 7 presents the head searching scheme.
Search head over the Region with starting point (x, y), width (w) and height (h).
Test Data: Vi,j[a, b] ,where i = x to x+w-14, j = y to y+h-14
a = 1 to 14, b = 1 to 14 Layer 1:
Ensemble1
False Non-head True
Layer 2: Ensemble2
Head Layer 3:
Ensemble3
Proceed False
True Proceed Non-head
False Non-head True
Fig. 7. Search Scheme of the Head Detector.
4.TORSO DETECTOR
Humans are articulated objects composed of connecting parts. Hence, the coordinates of the head position are used as the starting point to locate the torso. The torso detector searches over the edge box maps, which largely abstract the output images from edge images and hence reduce the data complexity. Figure 8 presents several edge box maps with the head region found, illustrating more clean views for segmentation of the torso part.
Original Edge Box Map Original Edge Box Map
Fig. 8. Edge Box Maps with the Head found.
of the range is 2 × height of the head.
Head on one side of the bed
Head on middle of the bed
Head on the other side of the bed
Search Location: (xs, ys)
Head Location: (xh, yh)
x s= x h–△g
y s= y h–△k ( y h ) Head
location
Torso Search Region
Fig. 9. The location of the torso search region (xs, ys) is derived from the head
location (xh, yh). Given the head size (w, h) and the bed size (W, H), ∆g = 1½ ×
w and ∆k (yh) = (1) 0, where ys < H/3 – h/3; (2) h , where ys > 2H/3 – h/3; (3)
h/2, otherwise.
A voting mechanism is created to locate the torso by find the most flat region inside the search area. Given the search area, it is divided into 4 rows equally. We then select two connecting rows with the lowest edge box count (See Figure 10).
r’ = Argmin ( Σn (r) + Σn (r + 1) )
,where r = {1, 2, 3} and n is (1: edge box, 0: blank box) Terminate with row r’ + row (r’+1)
r1 r2 r3 r4
Fig. 10. Voting mechanism to select the smoothest area. Σ n(r) is the accumulation of valid edge boxes within row r.
5.EXPERIMENTS
In evaluation, the experiments are conducted on a number of video clips in two different environments with various body postures, human activities and camera shooting angles. The human activities include head movements, limb movements and body rotation. For a quantitative evaluation on the proposed method, we firstly systematically sample 2090 frames from 17 video clips, secondly generate 200 non-repeating random numbers between 1 and 2090, and then select 200 frames according to those random numbers. The randomly sub-selected frames are then manually marked to produce a reference standard by an independent individual. The output of the system is then compared to the reference standard. Given the overlapped area ζ of the manually marked area and the estimated area by the proposed algorithm ω, the precision rate P of each frame is equal to ζ / ω. Furthermore, a recognition rate is defined as R(P) = n(P) / N, where n(P) is the sum of frames with precision rate P and N is the total number of frames sampled from individual video clip. Figure 8 presents the recognition rates of the head detector and the torso detector with three levels of precision rate, i.e. P ≥ 0.7, P ≥ 0.5 and P < 0.5. The recognition rates are presented in Table 1.
Table I. Recognition Rates.
R(P) P ≥ 0.7 P ≥ 0.5 P < 0.5
Head Detector 0.79 0.99 0.01
Torso Detector 0.9 0.96 0.04
R(P) = n(P) / N, where n(P) is the sum of frames with precision rate P and N is the total number of frames sampled.
Although the proposed model is trained and built by using a small number of frames from one single video clip, the experimental results on 200 randomly selected frames from 17 video clips show that the proposed approach works robustly despite different environmental set-up, camera shooting angles,
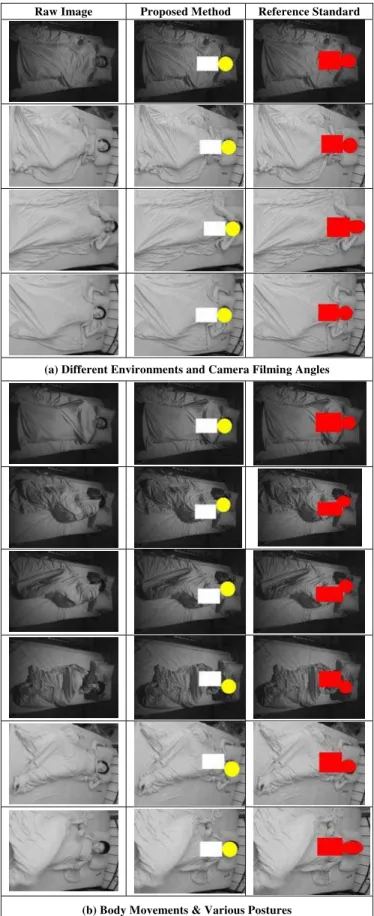
and variations of body postures and movements. Figure 11 illustrates some image outputs from our system, presenting that the approach is invariant to different body postures, human activities and environmental set-up.
Raw Image Proposed Method Reference Standard
(a) Different Environments and Camera Filming Angles
(b) Body Movements & Various Postures
Regarding the computing efficiency, the system is implemented in C# and able to process 25 fps on a P4 2.4GHz CPU power. The video was acquired with a resolution of 320*240, using a SONY infrared camcorder (DCR-HC-30E).
6.CONCLUSIONS &FUTURE WORKS
Analysis of the covered human body is a challenging task. We have presented a novel technique for locating the upper body parts on the covered human. The method includes a combination of image processing techniques for extracting object features effectively, an edge box map for further shape abstraction to locate the torso, a hierarchical-ensembles head detector and a torso detector. Although the proposed model is trained and built by using a small number of frames from one single video clip, the experimental results show that the proposed approach works robustly to estimate the positions of the head and the torso on the covered human on 17 video clips despite different environmental set-up, camera shooting angles, and variations of body postures and movements.
The proposed method allows further analysis of the activities of the covered human body. The locations of the upper body parts and the proposed edge box map can be utilized to identify the limb posture, allowing recovering / estimating a full human body posture and advanced recognition on covered human body activities, such as leg movements, arm movements, body rotation, getting up, head movements, going to bed, etc.
Apart from assisting diagnosis of obstructive sleep apnea, the monitoring technique can be applied to other sleeping disorders or syndromes.
We will continuously develop and enhance methods to locate the rest of the body parts and to recognize human activities during sleep. Currently, we are investigating methods for tracking the covered human body parts. As the detection is applied to every frame in the initial stage, tracking will be added to associate temporal relationships among frames, to stabilize locations of detected body parts and to further improve the computational speed.
Amounts of experiments will be conducted using patients and volunteers in the Sleep Lab at the Lincoln County Hospital to determine performance on a large scale and to generalize across the variations in human sizes, shapes, and behavior. Furthermore, we will develop a system to diagnose movements characteristic of sleep disturbances.
ACKNOWLEDGMENT
We thank Yen-Ting, Fang for marking the head and the torso of the covered human on the 200 randomly selected images as the reference standard in evaluation of the proposed method.
REFERENCES
[1] W. W. Flemons, M. R. Littner, J. A. Rowley, P. Gay, W. M.
Anderson, D. W. Hudgel, R. D. McEvoy, and D. I. Loube, Home Diagnosis of Sleep Apnea: A Systematic Review of the Literature An Evidence Review Cosponsored by the American Academy of Sleep Medicine, the American Thoracic Society CHEST 124(4), 2003, pp.
1543-1579. Available:
http://www.chestjournal.org/cgi/reprint/124/4/1543
[2] J. C. T. Pepperell, R. J. O. Davies, and J. R. Stradling, Sleep studies for sleep apnoea, Physiological Measurement, 23, 2002, pp. R39 – R74. Available:
http://www.iop.org/EJ/article/0967-3334/23/2/201/pm22r1.pdf [3] L. S. Bennett, B. A. Langford, J. R. Stradling, and R. J. O. Davies, Sleep
fragmentation indices as predictors of daytime sleepiness and nCPAP response in obstructive sleep apnea, Am J Respir Crit Care Med, 158, 1998, pp. 778 – 786.
[4] R. N. Kingshott, M. Vennelle, C. J. Hoy, H. M. Engleman, I. J. Deary, and N. J. Douglas, Predictors of improvements in daytime function outcomes with CPAP therapy, Am J Respir Crit Care Med, 161, 2000, pp. 866 – 871.
[5] Visi-3 Digital Video System, http://www.stowood.co.uk/page26.html [6] Y. Sivan, A. Kornecki, and T. Schonfeld, Screening obstructive sleep
apnoea syndrome by home videotape recording in children, Eur Respir J, 9, 1996, pp. 2127 – 2131.
[7] Z. Q. Huang and Z. Jiang, Tracking Camouflaged Objects with Weighted Region Consolidation, Proceedings of the IEEE Digital Image Computing: Technqiues and Applications, 2005, pp. 161 – 168.
[8] T. E. Boult, R. Micheals, X. Gao, P. Lewis, C. Power, W. Yin, and A. Erkan, Frame-Rate Omnidirectional Surveillance & Tracking of Camouflaged and Occluded Targets, Proceedings of the Second IEEE Workshop on Visual Surveillance, 1999, pp. 48 – 55.
[9] H. T. Nguyen and A. W. M. Smeulders, Fast Occluded Object Tracking by a Robust Appearance Filter, IEEE Transactions on Pattern Analysis and Machine Intelligence, 26, 2004, pp. 1099 – 1104.
[10] A. Ghafoor, R. N. Iqbal, and S. Khan, Robust image matching algorithm. Proceedings of Video/Image Processing and Multimedia Communications, 4th EURASIP Conference focused on Vol. 1, 2003, pp. 155 – 160.
[11] H. L. Eng, J. Wang, A. H. Kam, and W. Y. Yau, A Bayesian framework for robust human detection and occlusion handling using human shape model. Proceedings of the 17th International Conference on Pattern Recognition, 2004, pp. 257 – 260.
[12] J. Winn and J. Shotton, The Layout Consistent Random Field for Recognizing and Segmenting Partially Occluded Objects. Proceedings of IEEE Computer Vision and Pattern Recognition, 2006, pp. 37 – 44. [13] B. Chalmond, B. Francesconi, and S. Herbin, Using Hidden Scale for
Salient Object Detection. IEEE Transactions on Image Processing, 2004, pp. 2644 – 2656.
[14] R. T. Collins, Y. Liu, and Leordeanu, M., Online Selection of Discriminative Tracking Features. IEEE Transactions on Pattern Analysis and Machine Intelligence, Vol. 27, 2005, pp. 1631 – 1643.
[15] T. Jaeggli, G. Caenen, R. Fransens, and L. V. Gool, Analysis of Human Locomotion Based on Partial Measurements. Proceedings of IEEE Motion, 2005, pp. 248 – 253.
[16] J. R. Quinlan, Bagging, boosting, and C4.5. Proceedings of the Thirteenth National Conference on Artificial Intelligence, 1996, pp. 725 – 730. [17] C. W. Wang, New Ensemble Machine Learning Method for Classification
and Prediction on Gene Expression Data. Proceedings of 28th IEEE EMBS Annual International Conference, 2006, pp. 3478 – 3481. [18] M. Seul, L. O'Gorman, and M. J. Sammon, Practical Algorithms for Image
Analysis with CD-ROM. Cambridge University Press, 2000.
[19] X. Jiang, Advanced Techniques for Assessment Surface Topography. Kogan Page, 2003.
[20] Raytek Corporation, Fluke ThermoView Ti30 thermal imager, Available:
http://www.radir.com/thermalimager.htm
[21] S. Matusiewicz [Position: Consultant Physician], Personal Interview, Medical Physics Department of Lincoln County Hospital in United Kingdom, 2006
[22] D. Mack, M. Alwan, B. Turner, P. Suratt, and R. Felder, A Passive and Portable System for Monitoring Heart Rate and Detecting Sleep Apnea and Arousals: Preliminary Validation, Proceedings of the Transdisciplinary Conference on Distributed Diagnosis and Home
Healthcare (D2H2), 2006. Available: